SEPA's Sea Lice Regulatory Framework
The science and evidence used to justify and inform SEPA’s Sea Lice Regulatory Framework are areas of concern for the aquaculture industry. Ministers requested CSA Marine to engage with the sector and report back on these concerns.
Annex C: Process Description and SLRF implementation
189. This Annex provides a detailed description of SLRF screening model and relative risk matrix, including newly created diagrams. The lack of a single coherent document of this nature made this a necessary undertaking to inform accurate reporting.
190. Sea lice screening model characteristics are relatively simple, conservative, limited to site-specific calibration and validation, relatively resource efficient and quick to run. The purpose of the screening models is to increase efficiency of assessment process by avoiding use of resources on more detailed assessments where screening can show they are unnecessary and enable relative risk-targeted further assessment where appropriate.
191. Refined model characteristics apply similar general principles as the screening model but with additional sophisticated representation of transmission processes and at higher spatial resolution, particularly with vertical resolution of the hydrodynamic model. These refined models are to be calibrated and evaluated against relevant environmental data. Refined modelling results in an increase in resource to develop and generally take longer to run. The purpose of refined models are to improve accuracy of predicted environmental capacity in WSPZs (Wild Salmon Protection Zones) and ensure confidence in setting sea lice limit conditions in permits for salmon farm developments that will ensure sea lice exposure is not exceeded (or further exceeded).
Annex C1.1 Overview of the screening model
192. SLRF uses observations and predictive numerical models to solve two aspects of the classic “encounter problem”: that is, how many sea lice a wild salmon post-smolt (hereafter post-smolt) encounters on its journey from river to ocean, and from where do those sea lice which they do encounter originate. This problem is trivial to state and complex to solve.
193. SLRF simulates water movement in which both sea lice and post-smolts live using a predictive hydrodynamic model, which uses the same physics principles as a weather forecasting model. In SLRF screening model, every salmon farm is treated as a point source of sea lice, with their numbers based on salmon farm authorised biomass limit, and a standardised number of adult female sea lice per fish (of 0.4). The routes taken by migrating smolts is simulated in SLRF by moving virtual smolts through the simulated moving water that contains sea lice released from point-source salmon farms. By varying the smolt route many times an uncertainty estimate is made of how much the precise route matters to the number of sea lice encountered. SLRF only attempts to solve the encounter problem at the critical period where the vast majority of post-smolt migration from rivers to sea occurs during April-May. These elements of SLRF are shown in the top boxes of the flow diagram in Figure C1.
194. SLRF keeps track of the exposure that each virtual post-smolt experiences from predicted infective-stage sea lice concentrations in a WSPZ. If the total number of encounters is less than some threshold deemed acceptable for wild post-smolt health, this is expressed as a remaining environmental capacity for post-smolts to encounter more sea lice whilst swimming through that WSPZ without detriment. This value forms the x-axis of the “relative risk matrix” in Figure C1.
195. SLRF also keeps track of how much each salmon farm contributes to the total number of encounters (in addition to the total number of encounters). This forms the y-axis of the relative risk matrix.
196. In this way every single salmon farm occupies a single box in the relative risk matrix: x-axis determined by all salmon farms in the WSPZ, y-axis determined by the salmon farm in question. The x-axis (remaining environmental capacity) is divided into three categories (little-or-none, intermediate, large). The y-axis (contribution by salmon farm) is divided into four categories (negligible, small, moderate, substantial). The matrix is then partitioned diagonally into four relative risk categories (1=low/green, 2=medium/yellow, 3=considerable/amber, 4=high/red).
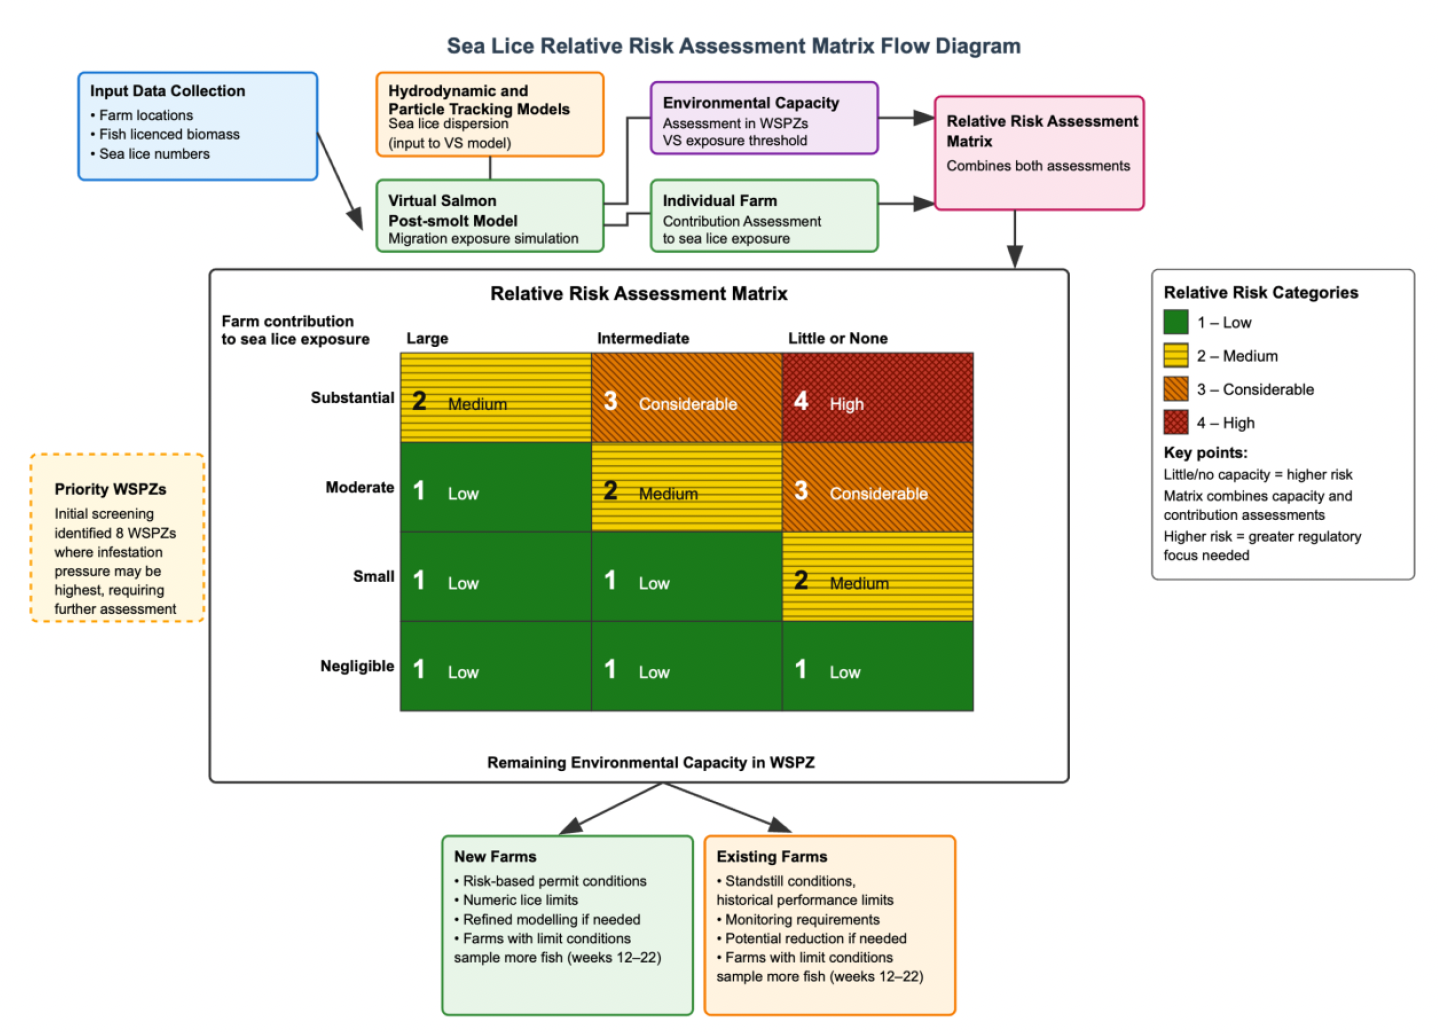
The diagram is flow process of determining the risk framework matrix
The components of the process are:
1. Input Data Collection including information of Farm locations, it’s licensed Fish biomass, and sea lice number information
2. Hydrodynamic and Particle Tracking Models (Sea lice dispersal to Wild salmon protection zone)
3. Virtual Salmon Post-smolt Model (Migration exposure simulation)
4. Environmental Capacity Assessment in Wild salmon protection zone (Sea lice exposure threshold)
5. Individual Farm Contribution Assessment (Sea lice exposure)
6. Priority Wild salmon protection zones
Initial screening identifies Wild salmon protection zones where infestation pressure may be highest, requiring further assessment.
7. Relative Risk Assessment Matrix
Horizontal Axes : Remaining Environmental Capacity in Wild salmon protection zone (Large, Intermediate, Little or None)
- Vertical Axes: Farm contribution to sea lice exposure (Substantial, Moderate, Small, Negligible)
There is an accompanying relative risk matrix showing the following 12 combinations
Substantial contribution with large remaining environmental capacity is classified as category 2, Medium relative risk:
Substantial contribution with intermediate remaining environmental capacity is classified as category 3, Considerable relative risk:
Substantial contribution with little or none remaining environmental capacity is classified as category 4, High relative risk:
Moderate contribution with Large remaining environmental capacity is classified as category 1, low relative risk:
Moderate contribution with intermediate remaining environmental capacity is classified as category 2, medium relative risk:
Moderate contribution with little or none remaining environmental capacity is classified as category 3, considerable relative risk:
Small contribution with Large remaining environmental capacity is classified as category 1, low relative risk:
Small contribution with intermediate remaining environmental capacity is classified as category 1, low relative risk:
Small contribution with little or none remaining environmental capacity is classified as category 2, medium relative risk:
Negligible contribution with Large remaining environmental capacity is classified as category 1, low relative risk:
Negligible contribution with intermediate remaining environmental capacity is classified as category 1, low relative risk:
Negligible contribution with little or none remaining environmental capacity is classified as category 1, low relative risk:
8. Conditions for New versus Existing Farms describes the conditions associated with new and existing farms
New Farms conditions include: risk-based permit conditions, Numeric sea lice limits, Refined modelling if needed, Potential reduction of conditions, Extra fish sampling (weeks 12–22)
Existing Farms conditions include: Standstill conditions, Historical performance limits, Monitoring requirements, Potential reduction if needed, Extra fish sampling (weeks 12–22)
197. The four relative risk categories are then translated into differing actions on existing and new developments.
198. All salmon farms with a relative risk category 1 or “low/green relative risk” are not subject to sea lice limit conditions. They will be subject to sea lice monitoring and reporting conditions allowing SEPA to track sea lice numbers on the salmon farms and intervene if those numbers rise to levels likely to result in the sea lice exposure threshold being exceeded. Salmon farms in relative risk categories 2, 3 and 4 have interventions applied by the regulator, explained in detail below.
199. Applications for new or expanded salmon farms are run in the screening model. If screening concludes that the proposed salmon farm development would be in relative risk category 2, sea lice limits are based on the limits proposed by the developer in their application. If screening concludes that the proposed salmon farm development would be in relative risk category 3 or 4, an appropriate further modelling assessment is required to (a) improve the accuracy of the predicted remaining environmental capacity for sea lice in the WSPZ concerned; and (b) identify a sea lice limit that SEPA are confident will prevent the sea lice exposure threshold from being exceeded (or further exceeded).
200. The “screening model” assesses exposure of wild salmon post-smolts to predicted infective sea lice concentrations in WSPZs. The contributions to infective sea lice concentrations in WSPZs of salmon farms that are located outside of WSPZs, as well as those located within WSPZs, are included[81]. SEPA has created the geographical boundaries of WSPZs using a set of four rules. There are 120 distinct WSPZs drawn up by SEPA. For sea trout which was intended to be implemented in March 2025[82] on the west coast, western isles and the Northern Isles (where there are no designated salmon rivers), protection, the WSPZs cover confined areas of sea. Within sea loch systems, the consultation proposal was that they will extend up to 20 km from the relevant river mouths. For rivers flowing out into open sea areas, they will extend outward from the river mouth for 5 km. More details on sea trout have been put forward by SEPA after the research period for these annexes.
201. Under the SLRF, SEPA will normally undertake refined modelling required for higher-relative risk proposals. Refined models are validated against environmental data to ensure confidence in outputs. SEPA is currently developing and testing refined models (East of Skye WSPZ), including sensitivity analysis for oceanographic and meteorological variability and particle tracking assumptions. Following testing, SEPA will publish the refined modelling methodology and seek stakeholder review before progressing models for other sea areas. Developers may propose their own refined model; in such cases, SEPA reviews the method statement during the pre-application process to confirm acceptability
Annex C1.2 Modelling tools detailed description
202. Three modelling tools are used within the screening model: a hydrodynamic model, a particle tracking (dispersal) model, and a particle encounter model. The underlying physical principles of each of these models are well-established and are not contested per se. The models do however require some parameters values to be chosen, and they require data to specify initial values for some of the predicted outputs, the choice of values and their likely range were raised in discussion with CSA Marine as requiring description and justification.
Hydrodynamic model
203. The hydrodynamic model simulates time-evolving physical characteristics of the marine environment: temperature, salinity and currents. It translates the existing Marine Scotland (now Marine Directorate) Scottish Shelf Sub Area models from FVCOM to MIKE 3 modelling systems and provides 3D representation of water currents, temperature, and salinity evolving over time.
204. The Hydrodynamic model applies a 3D 10-layer sigma coordinate scheme with uniform layer spacing. Model features and setup include:
- Low order, fast algorithm solutions for the shallow water momentum equations and temperature and salinity equations.
- Density as a function of temperature and salinity.
- Horizontal Eddy Viscosity: Smagorinsky formulation with Constant of 0.28
- Vertical Eddy Viscosity: Log-law formulation
- Horizontal Dispersion for Temperature and Salinity: Scaled eddy viscosity formulation with a constant of 1.
- Vertical Dispersion for Temperature and Salinity: Scaled eddy viscosity formulation with a constant of 0.01.
205. The hydrodynamic data requirements document by SEPA in the May 2023 consultation is described to consist of[83]:
- Tidal Boundaries: Firth of Clyde (FOC) – 2019 tides, re-predicted from 1993 “average” tides used in the sub area climatology forcing. SEPA intend to re-run with 1993 average tides for final screening. Wider Loch Linnhe System (WLLS) and East Coast of Lewis and Harris (ECLH) – 1993 "average” tides.
- Meteorological Forcing: climatology forcing for wind speed and direction. For heating, SEPA have used a mixture of climatology factors and a simple analytical heating model.
- Freshwater Forcing: climatology forcing for many large and small rivers derived from the Centre for Ecology and Hydrology (CEH) Grid 2 Grid model.
206. SEPA have separate model domains which cover three areas: Firth of Clyde (20 salmon farms), Wider Loch Linnhe System (42 salmon farms), East Coast of Lewis and Harris extending to the Northwest of the mainland (102 salmon farms). The models are spun up to similar initial conditions for 19th March start date. The models are run from 19th March until 1st June using a 30-second timestep, with T, S, U and V recorded at every grid node at 15-minute intervals for subsequent sea lice particle tracking.
Particle Tracking Model
207. SEPA have applied the MIKE Agent Based Modelling Lab package to simulate dispersion of sea lice from existing and proposed salmon farms, tracking individual particles representing sea lice through their lifecycle to predict concentrations of infective-stage sea lice.
208. Key assumptions include:
- Particles released into hydrodynamic flow fields every 5 minutes from 1m below surface.
- Sea lice become infective after 4 days and remain so until 17 days old.
- Mortality rate of 17% per day.
- Horizontal dispersion coefficient (eddy diffusivity) of 0.1 m²/s.
- Vertical dispersion coefficient (eddy diffusivity) of 0.001 m²/s.
209. To drive the particle tracking model release locations are chosen using positions from Scotland's Aquaculture website (SAW). The input data (not held SAW) provides number of fish, adult female sea lice per fish, and new sea lice production rate and collectively defines the sea lice input from each salmon farm. The model uses environmental data from the Hydrodynamic model outputs (velocity, temperature, salinity).
210. Particles are released every 5 minutes from each site at 1m below surface, and movement is advected by 3D velocity components with dispersion following a Random Walk with the specified coefficients. There is buoyancy providing a small upward velocity (0.0014 m/s) which keeps particles within the top 10 m. The particles are tracked as they age to determine their infectivity. The particles information is tracked at 15-minute intervals allowing concentration calculations enabling the Conversion of sea lice/m² over top 2m using scaling factors.
Virtual post-smolt sea lice encounter model
211. The virtual Salmon Post-smolt Model (VPSM) simulates potential exposure of migrating post-smolts as they pass virtually through zones of the model designated as WSPZs during April and May. Virtual post-smolts follow representative routes through WSPZs at a constant rate of 12.5 cm per second (equivalent to 1 body length per second for a 12.5 cm post-smolt).
212. Multiple, different representative paths through WSPZs are simulated by releasing salmon particles at hourly intervals during April-May, each taking a different route. Enabling an exposure calculation of the cumulative exposure in sea lice per m² days for each virtual fish. The exposure value is determined as the 95th percentile exposure value derived from ordered results (this the highest 5% of calculated exposures are discarded). SEPA’s 2023 documentation[84] indicates that the VPSM has been run for 164 salmon farms on the west coast and western isles.
213. To determine the salmon particle migration, representative speeds are (or will be) based on tracking studies. For swim paths, at screening a range of representative paths are used, including the longest straightline path through the WSPZ. Additional information required on swimming speed (body length per second) is held constant (12.5 cm per second). The sea lice concentration fields are established from the previous particle tracking model outputs.
214. The analysis identifies individual salmon farm contributions to total exposure of the salmon particles.
215. The relative risk to the salmon particle is considered based on the 0.7 sea lice per m² days exposure threshold to 95th percentile. For initial screening, the average number of adult female sea lice per fish is standardised to 0.4.
Input data needed to run the VPSM
216. Three pieces of data are required to run the VPSM model:
Salmon farm location – held by SEPA and published on Scotland’s aquaculture website/satellite imagery.
Fish numbers - derived from maximum permitted biomass using the formula 1.75 x which appears to be a multiplier within the range suggested by Moriarty et al (2023)[85] and is used to account for overstocking for fish that are harvested early or die during production. Maximum permitted biomass in kg / 5 kg average harvest weight. No documented description is provided as to why 1.75 is applied, note however it is consistent with Moriarty et al (2023) and their reasoning given above.
Sea lice counts - For initial screening standardised 0.4 sea lice per fish applied
For all salmon farms, regardless of relative risk category, weekly sea lice counts, and fish numbers reporting are required between weeks 12 to 22 which approximately corresponds with 16th March - 30th May each year adhering to SEPA specified counting protocols. These data will be used to run screening assessments each year. To the best of our knowledge, the use of actual sea lice count data has not been implemented in the screening model, though there is a stated intention to do so in the future.
Annex C1.3 Relative risk categories and relative risk matrix
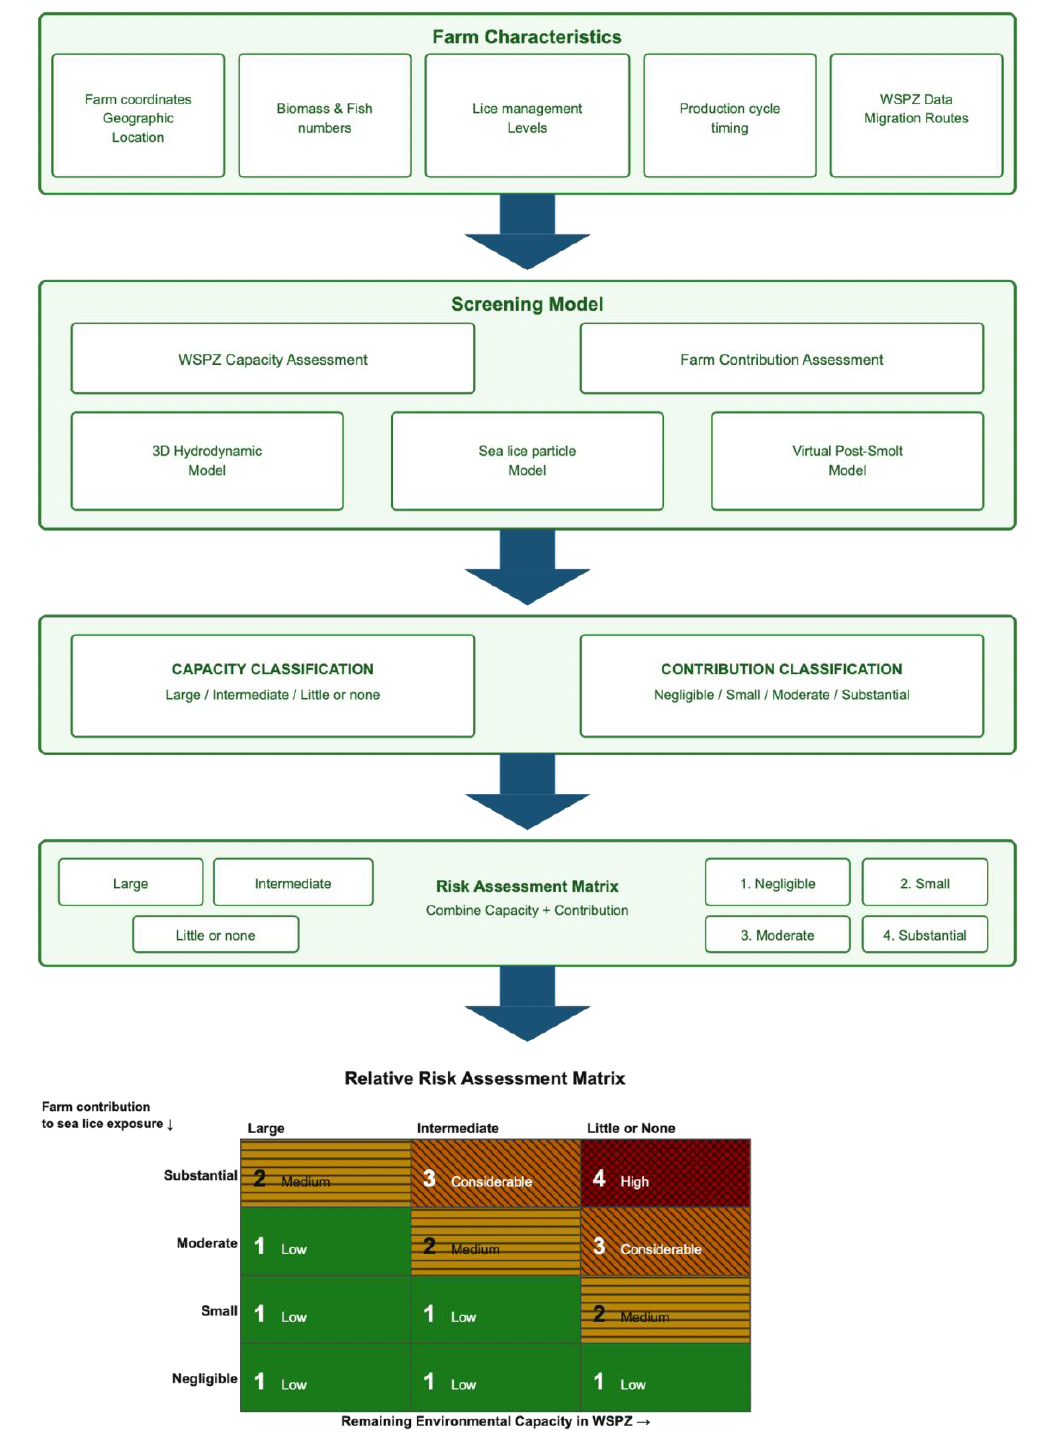
This is a flow diagram outlining the detailed components of the screening process for determing the relative risk matrix
The first component uses the farm characteristics comprising of Farm coordinates for geographic location, on site Biomass & fish numbers, Lice management levels, Production cycle timings and wild salmon protection zones data migration routes information.
Next step is the Screening Model which considers the wild salmon protection zone Capacity Assessment, the Farm Contribution Assessment, inclusion of a 3D hydrodynamic model and Sea lice particle model along with the Virtual post-smolt model.
This provides Output Classifications
Which are: Capacity Classification and Contribution classification
Capacity Classification determined as three categories: Large, Intermediate and combined category of Little or none
Contribution Classification as four categories: Negligible, Small, Moderate, Substantial
The Risk Assessment Matrix combines the contribution and capacity categories to produce a 3 by 4 relative risk matrix.
The Relative Risk Assessment Matrix has:
Horizontal Axes : Remaining Environmental Capacity in Wild salmon protection zone (Large, Intermediate, Little or None)
- Vertical Axes: Farm contribution to sea lice exposure (Substantial, Moderate, Small, Negligible)
There is an accompanying relative risk matrix showing the following 12 combinations
Substantial contribution with large remaining environmental capacity is classified as category 2, Medium relative risk:
Substantial contribution with intermediate remaining environmental capacity is classified as category 3, Considerable relative risk:
Substantial contribution with little or none remaining environmental capacity is classified as category 4, High relative risk:
Moderate contribution with Large remaining environmental capacity is classified as category 1, low relative risk:
Moderate contribution with intermediate remaining environmental capacity is classified as category 2, medium relative risk:
Moderate contribution with little or none remaining environmental capacity is classified as category 3, considerable relative risk:
Small contribution with Large remaining environmental capacity is classified as category 1, low relative risk:
Small contribution with intermediate remaining environmental capacity is classified as category 1, low relative risk:
Small contribution with little or none remaining environmental capacity is classified as category 2, medium relative risk:
Negligible contribution with Large remaining environmental capacity is classified as category 1, low relative risk:
Negligible contribution with intermediate remaining environmental capacity is classified as category 1, low relative risk:
Negligible contribution with little or none remaining environmental capacity is classified as category 1, low relative risk:
217. The predictive models described above generate data for two assessments that are subsequently combined in the relative risk matrix. The relative risk matrix has two axes. The x-axis is “environmental capacity available within the WSPZ”, the y-axis is “contribution made by each farm” to the exposure of salmon to infective-stage sea lice. Both x- and y-axes values are derived from the screening model. The x-axis (capacity available) is divided into three categories (little-or-none, intermediate, large). The y-axis (contribution by farm) is divided into four categories (negligible, small, moderate, substantial). The matrix is then partitioned diagonally to create four relative risk categories (low, medium, considerable, high) – see Figures D1 and D2. The four relative risk categories translate into differing actions on existing and new/expanding salmon farms, before dealing with those a few words on the x- and y-axes.
Environmental Capacity Assessment
218. This assessment determines how much additional sea lice exposure a WSPZ can accommodate before exceeding the sea lice exposure threshold of 0.7 infective-stage sea lice per m² days. The capacity assessment considers:
- Current sea lice exposure levels from existing salmon farms.
- Variance from the exposure threshold (95th percentile of virtual post-smolt exposures).
- Cumulative effects of all salmon farms contributing to the WSPZ.
219. WSPZs are categorised as having little or none, intermediate, or large remaining capacity based on how close current exposure levels are to the threshold.
Individual Salmon Farm Contribution Assessment
220. This assessment quantifies each salmon farm's contribution to the total sea lice exposure within WSPZs. Salmon farms are categorised based on their average contribution over April and May, these are:
- Substantial: ≥0.04 infective-stage sea lice per m² days
- Moderate: Between 0.02 and 0.04 infective-stage sea lice per m² days
- Small: Negligible: contribution below 0.02 infective-stage sea lice per m² days
221. A salmon farm's contribution depends most significantly on its location relative to salmon migration routes and how local currents disperse sea lice from the salmon farm during their planktonic transmission stage.
222. Figure C2 expands on Figure C1, with greater detail on the inputs to the screening model and reports the actual number of salmon farms assigned to each relative risk category as of December 2024. Figure C3 lists the numerical values of the technical parameters used in the screening model, based on scientific literature. Their individual accuracy and the combinatory effects of their accuracy on the outcomes of the screening process are relevant to the recommendation of this report.
223. Much of this explanation has been extracted from the text of SEPA’s documentation[86], and from discussions with SEPA. The reason to revisit in such detail here is also relevant to this report’s recommendation R1.
| Technical Parameter | Value | Notes |
|---|---|---|
| Post-smolt speed | 12.5 cm/s | ≈ 1 body length/second |
| Exposure threshold | 0.7 lice m⁻² days | 95th percentile |
| Lice development |
After 4 days to attachment: Mortality at 17 days Temperature dependent (10°C applied) |
|
| Protection period |
Salmon: Weeks 12–22 Sea trout: Weeks 12–44 |
|
| Lice mortality | 17% daily mortality post-hatching | Applied to particle mass |
| Lice production | 30 new sea lice per female/day | |
| Sea lice biology (post-hatching) |
Mortality: 17% per day (applied to particle mass) Infective window: age> 4 days and < 17 days Upward swimming speed velocity: 0.0014 m/s |
|
| Relative contribution categories |
Negligible: <10% Small: 10 – <20% Moderate: 20 – <30% Substantial: ≥30% |
These are not exposure thresholds but categories of relative contribution to exposure as percentage of the sea lice exposure threshold |
Annex C1.4 Relative risk categorised interventions
224. Here we explain the interventions applied to salmon farms according to which of the four relative risk categories they are assigned, and whether they are an existing salmon farm or an application or a new site or expansion of an existing site.
Some general considerations
- Weekly sea lice counts, and fish numbers reporting are required between Weeks 12 – 44 following SEPA specified counting protocols.
- Definition of “Standstill/ no deterioration conditions”: These are seasonal sea lice limits imposed during the spring migration period ( weeks 12 -22 ), when wild salmon are reportedly most vulnerable to exposure during their migration as small post-smolts. The limits are based on historic sea lice data and are intended to prevent sea lice levels from increasing beyond those historic levels during this critical migration period.
- All existing salmon farms other than those categorised in relative risk category 1 are to be subject to sea lice (standstill) limit conditions. Only those in relative risk category 1 are screened out from the default position of limit conditions.
- For new or expansion applications, data from the preapplication process is used to run the screening model to assign appropriate categories. All new and expanding salmon farms, must provide for pre applications, proposed location coordinates of the salmon farm, maximum number of fish by production year, planned sea lice management levels, production cycle timings and fallowing details, sea lice control measures and coordination agreements. During pre-application screening, community engagement is required.
Category 1: Existing low-relative risk salmon farm
225. Green boxes in the relative risk matrix of Figure 1, As of December 2023 applies to 63% of salmon farms (103 out of 164).
226. No numeric sea lice limits are set. Permit authorises the operation of a marine salmon farm proposed in the original salmon farm application. Salmon farms are subject to randomised inspections with periodic annual compliance checks.
Category 1: New or expanding low-relative risk salmon farm
227. Identified low relative risk (category 1 salmon farms) have no additional numeric sea lice limits imposed, and salmon farms are authorised to operate a marine fish farm. The weekly monitoring is required to provide fish numbers and average sea lice per fish.
228. The first function of a screening assessment is to identify proposals that SEPA can conclude (triage), without further assessment, are not likely to have a significant adverse impact on the water environment (e.g. unlikely to breach, or further breach, of the sea lice exposure threshold).
229. If SEPA cannot conclude this is the case using a screening assessment, further assessment will be required using refined models. In cases where SEPA conclude that a development proposal is not likely to have a significant adverse impact (either based on a screening assessment or a further assessment), SEPA use the output of that modelling to assign the proposed salmon farms to the appropriate relative risk category.
Category 2: Existing medium-relative risk
230. Yellow boxes in the relative risk matrix of Figure 1, As of December 2023 applies to 13.5% of salmon farms (23 out of 164).
231. An upper limit on the total number of sea lice is imposed. At first implementation, the value is equal to the reported number of sea lice, averaged over a fixed 3-year reporting periods (weeks 12 -22 of 2018, 2019, 2021,2022, 2023). The logic is to maintain typical performance for that salmon farm. Cat 2 salmon farms are a secondary focus for inspections (randomised subsets in areas/company) and early season discussions between regulator and salmon farmers.
232. The sea lice limit conditions would only be varied if:
(a) the operator applies to vary them and the variation is granted; or(b) SEPA vary the limits after determining based on environmental monitoring evidence and refined modelling assessments that wild salmon are being adversely impacted by sea lice in a wild salmon protection zone and action to reduce sea lice on salmon farms in relative risk categories 3 and 4 would not be sufficient to address the impact.
Category 2: New or expanding medium-relative risk salmon farm
233. Medium relative risk (category 2) salmon farms have sea lice conditions based on applicants proposed performance with a maximum limit of the product of number of fish on site and 2 adult female sea lice per fish. This is assessed as a 28-day rolling average between weeks 12 -22. There is a maximum daily limit of four times the rolling average. The weekly counting and reporting conditions apply.
Category 3: Existing considerable-relative risk salmon farm
234. Amber boxes in the relative risk matrix of Figure 1, as of December 2023 applies to 11.5% of salmon farms (19 out of 164).
235. Sea lice limits are derived in the same way for existing category 2, 3 and 4 salmon farms. Cat 3 salmon farms are the secondary focus for targeted inspections (after category 4) and early season discussions with salmon farmers before March period. Enhanced monitoring may be required to ensure accurate sea lice count estimates.
Category 3: New or expanding considerable-relative risk salmon farm
236. If screening concludes that the proposed salmon farm development would be in relative risk category 3 or 4, an appropriate further modelling assessment is undertaken to (a) improve the accuracy of the predicted remaining environmental capacity for sea lice in the WSPZ concerned; and (b) identify a sea lice limit that we are confident will prevent the sea lice exposure threshold from being exceeded (or further exceeded). SEPA performance standard for sea lice surveillance[87] sets out the normal counting requirements for salmon farms with sea lice limit conditions. These require greater numbers of farmed salmon to be sampled during the compliance period for sea lice limits (weeks 12 to 22). This applies to all salmon farms with sea lice limit conditions irrespective of relative risk category.
Category 4: Existing high-relative risk salmon farm
237. Red boxes in the relative risk matrix of Figure 1, as of December 2023 applies to 11.5% salmon farms (19 out of 164).
238. SEPA performance standard for sea lice surveillance sets out the normal counting requirements for salmon farms with sea lice limit conditions. These require greater numbers of farmed salmon to be sampled during the compliance period for sea lice limits (weeks 12 to 22). This applies to all salmon farms with sea lice limit conditions irrespective of relative risk category.
Category 4: New or expanding high-relative risk salmon farm
239. SEPA performance standard for sea lice surveillance sets out the normal counting requirements for salmon farms with sea lice limit conditions. These require greater numbers of farmed salmon to be sampled during the compliance period for sea lice limits (weeks 12 to 22). This applies to all salmon farms with sea lice limit conditions irrespective of relative risk category.
240. Applications for new or expanded salmon farms are run in the screening model. If screening categorises the proposed salmon farm development in relative risk categories 3 or 4, SEPA will require that the proposal is modelled in more detail with a suitable model.
241. SEPA will normally build and run the model needed, with any additional environmental data required to test and evaluate the model collected by the applicant.
Contact
Email: CSAMarine@gov.scot