Seasonal migrant workers in Scottish agriculture: research report
Outlines the main findings of research into seasonal migrant workers in Scottish agriculture, including: their number and demographics; the experiences of employers and seasonal migrant workers; and the long-term viability of this sector.
Appendix K: Employer Survey Results on Employers and Workforce
Agricultural employers
The vast majority (90%) of employers who responded to the survey were an owner or partner in the agricultural business (figure K.1). Only 5% of respondents were in a managerial/supervisory role. Other responses included: Tenant, HR/Admin as well as those people who did not run a business from their land.
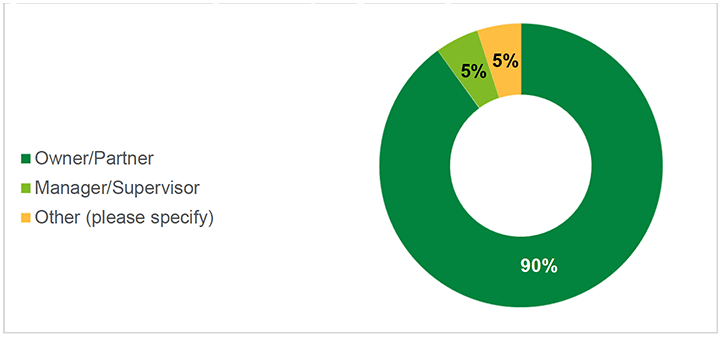
Q1. What is your main role in the business?
Base: n=1,089, all respondents
Four out of every five employers who responded to the survey owned their land (81%) while around one in three (32%) rented all or part land on a full tenancy. There were vast differences in the areas of land each farmer was responsible for. The average hectarage of the owned land was 2,523 whereas the mode, the most commonly reported size of land was three hectares (table K.1).
| Owned land (n=882) | Rented land (full tenancy) (n=351) | |
|---|---|---|
| Mean | 2523 | 854 |
| Median | 42.5 | 34.51 |
| Mode | 3 | 20 |
| Minimum | 0.01 | 0.3 |
| Maximum | 1000000 | 80476 |
Just under half (45%) grew crops on their land. When analysing these farmers in isolation the majority had fallow land (83%). Cereals, oilseed and protein crops were the most popular crop with 43% of farmers with crops producing these. Less than a fifth of farmers grew fruit in the open (18%) or stockfeed (17%).
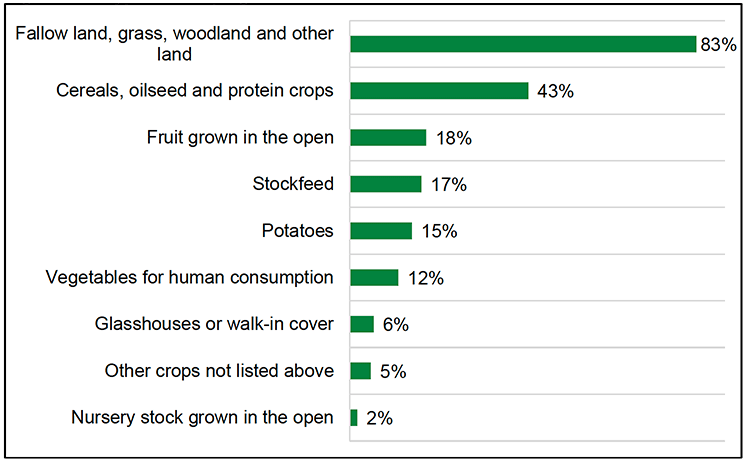
Q2. If you have crops, please tell us your land use in hectares for:
Base: n=436, those who grow crops
As with the differences found in the total area of owned or rented land there was variance within the area of land dedicated to each type of crop. On average, fallow land or woodland was the most predominant with farmers having 264 hectares on average. Cereals, oilseed and protein crops had 116 hectares of land dedicated to growth on average.
Agricultural workforce
The agriculture sector is vast, with differences in the size of holdings, leading to a range of labour demands. According to the survey results, in 2021 43% of people who either owned or rented land did not employ any workers.
Two thirds (66%) of the people who did employ workers hired full-time regular staff. Just under half (46%) employed casual and seasonal staff and 43% hired part-time regular staff.
The average number of workers varied within each of these classifications. The average number of full-time regular staff was 46 with a maximum of 90 workers. Similarly, at farms which employed part-time regular staff there were on average 20 part-time workers in 2021 with a maximum of 60 workers. The most variation was found in the number of casual and seasonal workers. On average there were 27 casual and seasonal staff on farms which employ staff however the maximum was found to be 150.
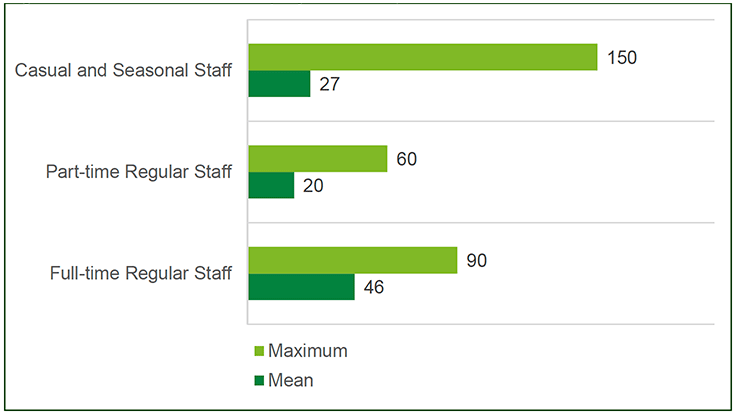
Q9. Approximately how many in 2021?
Base n=431
The majority of employers (84%) did not experience labour shortages in 2021. Where shortages were experienced, 13% were within skilled labour workforce and 9% were within unskilled labour (figure K.4).
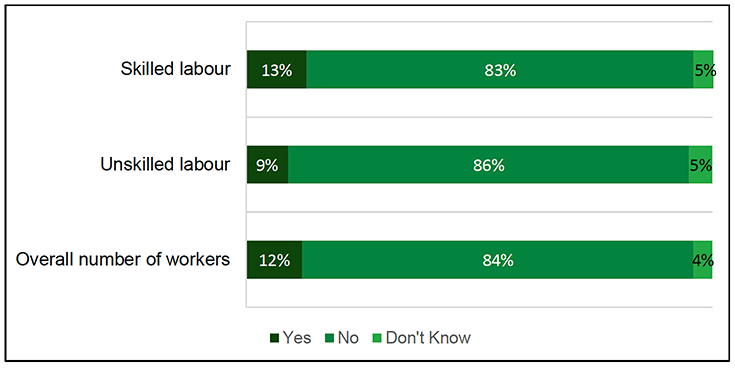
Q7. Did you experience any labour shortages in 2021?
Base: n=1,071
Seasonal migrant workforce
Three quarters of employers with casual or seasonal staff (74%) who responded to the survey stated that these staff members were from the UK only. The most common pathway for those workers from outside of the UK was through EU settled status (15%). Only 7% of those employers with casual and seasonal staff used the Seasonal Workers Pilot (figure K.5).
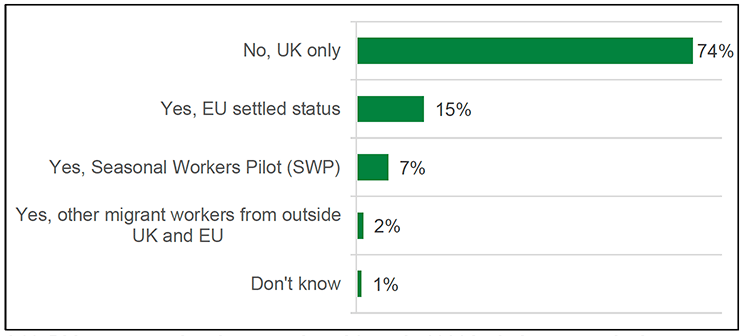
Q11. Did your casual and seasonal workforce in 2021 include seasonal migrant workers?
Base: n=270, those who employ casual and seasonal workers
After removing those who employ casual seasonal workers only from the UK, 38 employers of seasonal migrant workers responded to the survey. These farmers were more likely to grow crops (68%) than those without seasonal migrant workers (43%).
The majority of farms that employed seasonal migrant workers experienced labour shortages in 2021 (84%). There were similar shortages experiences finding both skilled (74%) and unskilled (76%) labour.
Employers supplied information about their workers country of origin (see figure J.6). Employers reported having workers from many different countries with almost half of employers having workers travel from Romania (47%). Two out of five farmers reported having workers from Bulgaria (39%) and just under a third had workers from Ukraine (29%).
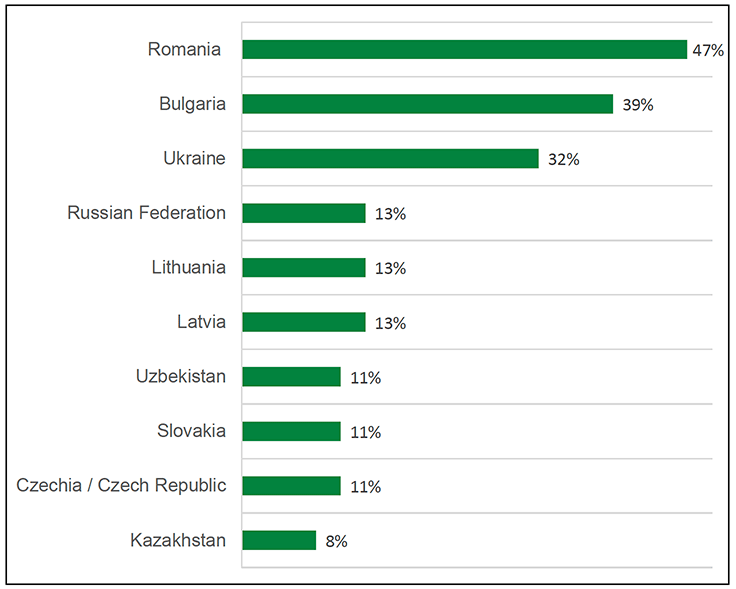
Q15. Please indicate whether seasonal workers in 2021 came from these countries of origin
Base: n=38, those who employ migrant workers
The survey showed that the number of migrant workers in Scotland fluctuates throughout the year. There are typically more migrant workers during the summer months. July 2021 was the peak, with approximately 2,752 migrant workers employed at the 38 farms who hired seasonal migrant workers (figure K.7).
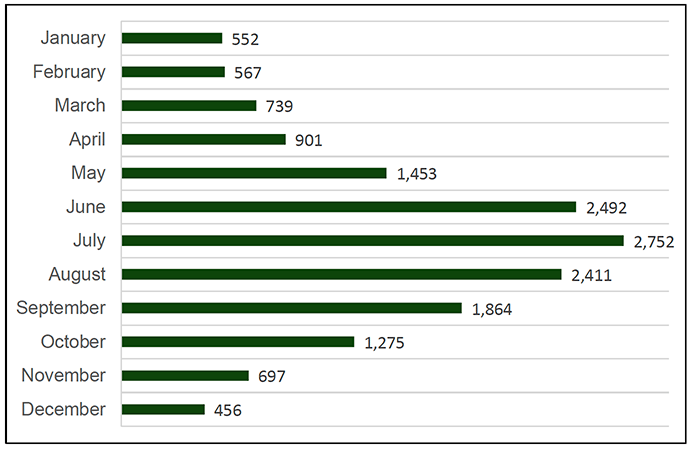
Q16. The approximate total number of seasonal migrant workers you employed each month in 2021
Base: n=34, those who employed seasonal migrant workers
The majority of employers provided accommodation for all seasonal migrant workers (71%), a further 9% to most of their seasonal migrant workers, 21% to under half of their seasonal migrant workers and the remainder (21%) not providing accommodation for any seasonal migrant workers.
| Typical hourly rate of pay | Value (£) |
|---|---|
| Mean | £9.72 |
| Median | £9.05 |
| Mode | £8.91 |
| Minimum | £8.91 |
| Maximum | £13.75 |
Typical hourly rates of pay for seasonal migrant workers ranged from £8.91 to £13.75, with £8.91 the most common rate of pay and an average of £9.72 per hour (table K.2).
Two thirds of employers deducted the cost of accommodation from workers' pay (65%) while 12% covered the cost in addition to employees pay (see figure K.8). Just under half (47%) of employers covered the cost of Wi-Fi in addition to employees pay as well as travel to the nearest village or town. Similarly, 44% of employers covered the cost of travel to or from the airport.
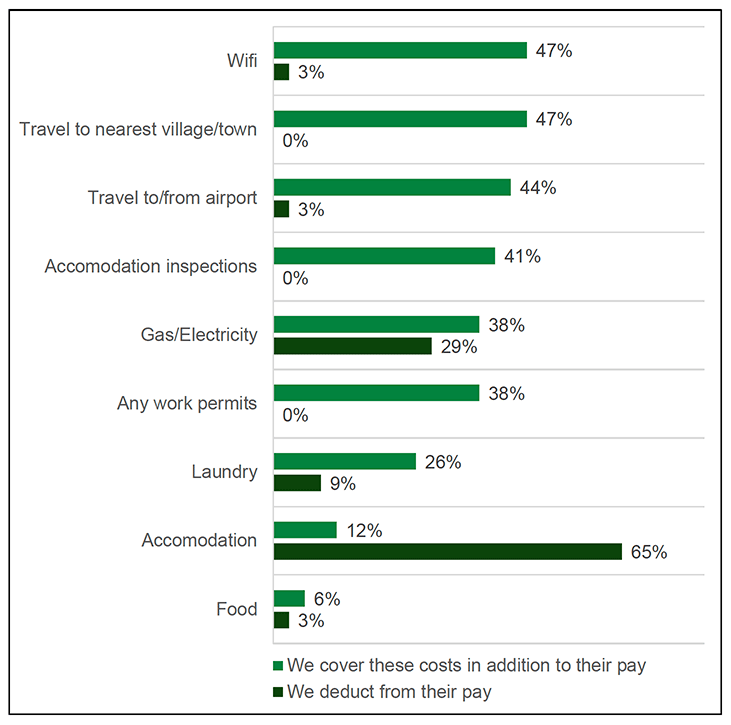
Q19. How do the following relate to the pay of seasonal migrant workers?
Base: n=34, those who employ seasonal migrant workers
Contact
Email: socialresearch@gov.scot