Scottish Sea Fisheries Statistics 2021
National Statistics publication that provides data on weight and value of sea fish and shellfish landed by fishing vessels, structure of the Scottish fishing fleet and employment on Scottish vessels. The supporting documents include accessible tables and a pdf version of the publication.
Part of
5 Employment
In 2021, 4,241 fishers were working on Scottish vessels, representing 0.2 per cent of the total Scottish labour force[12]. The number of fishers working on Scottish vessels fell by two per cent (down 70 fishers) between 2020 and 2021 (Table 44 and Chart 11).
Although employment in the fishing fleet is a small percentage of total employment in Scotland, employment in fishing accounts for a higher percentage of employment in island communities (Shetland four per cent, Orkney three per cent, Na h-Eileanan Siar two per cent) and in Argyll and Bute (one per cent) (Table 46).
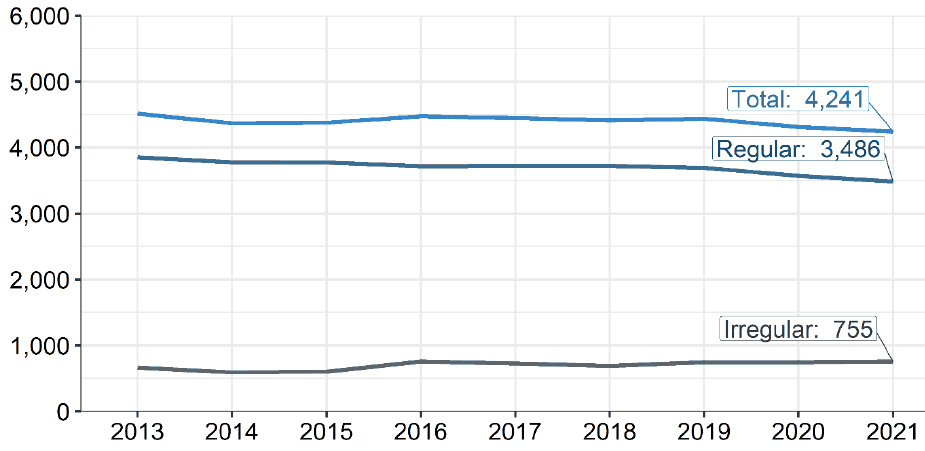
Data source: Table 44.
Since 2013, employment on Scottish-based fishing vessels has fallen by six per cent. There has been a nine per cent decrease in regular employment whilst irregular employment has increased by 14 per cent since 2013.
Fraserburgh is the district with the largest number of fishers (791) accounting for 19 per cent of the total in 2021. It is also the district with the largest number of fishers who work regularly, with 680 regularly employed fishers. Shetland had the most irregular fishers (215), accounting for 28 per cent of the total fishers in this category.