Scottish Sea Fisheries Statistics 2006
Scottish Sea Fisheries Statistics 2006
2. Overview of Catches and Landings
2.1 Landings by Scottish based vessels
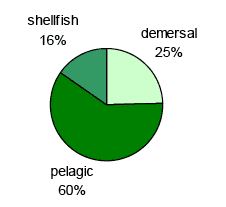
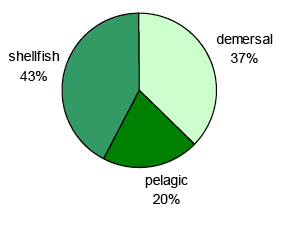
Scottish based vessels made 80 thousand voyages in 2006, a 17 per cent increase on the number in 2005 (Table 18). Some of this increase reflects additional activity of under 10 metre vessels identified as a result of the introduction of the Register of Buyers and Sellers for shellfish landings from early 2006. The value of landings increased by three per cent in real terms to £370 million despite the live weight landed dropping by 100 thousand tonnes (21 per cent) to 380,000 tonnes. The value of shellfish landings increased by 22 per cent in real terms to £140 million in 2006 with the volume of landings in this sector increasing by seven per cent to 59 thousand tonnes. High value shellfish landings formed 16 per cent of the total by weight but 38 per cent by value (Chart I), making shellfish the most valuable sector to the Scottish fleet for the first time ( Chart 11). The value of demersal landings increased by eight percent in real terms to £136 million despite the volume of landings decreasing by six per cent to 94 thousand tonnes. The 2006 pelagic landings have been affected by the repayment arrangements agreed with the Commission for historic undeclared landings of herring and mackerel. Repayment started in 2006 and covered some undeclared landings in 2005 and 2006. The volume of pelagic species landed decreased by 31 per cent to 226 thousand tonnes. Although prices per tonne landed increased, the value landed decreased by 19 per cent to £92 million. Pelagic landings made up 22 per cent in real terms of the total value and 60 per cent of the total volume. The proportion of the value of the annual catch of the Scottish based fleet landed into Scotland remained stable at around 83 per cent (calculated from table 18).
Chart I: Total landings by Scottish based vessels by species type, 2006
Quality: 379,200 tonnes |
Value( 3): £368.5 million |
 |
 |
Looking at the longer term trends, although the value of demersal landings increased in 2006 to reach £136 million, the 2006 figure is still 10 per cent lower in real terms compared with 2002. Over the same period, the value of pelagic landings (at 2006 prices) has decreased by 6 per cent from £108 million in 2002 to £92 million in 2006. The value of shellfish landings has increased by 35 per cent in real terms since 2002 to reach £140 million.
The total quantity of fish landed by Scottish vessels has fallen by 15 per cent since 2002 (calculated from Tables 17 and 27) affecting the demersal sector most (down by 39 thousand tonnes or 29 per cent). Pelagic landings by Scottish based vessels into UK ports have decreased compared with 2002 by 9 thousand tonnes to 141 thousand tonnes while pelagic landings abroad have decreased by 26 thousand tonnes, resulting in an overall decrease of 35 thousand tonnes, or 14 per cent. The quantity of shellfish landed in 2006 was 14 per cent higher than in 2002.
2.2 Total landings into Scotland
The quantity and value of all landings into each Scottish Fishery Office district are shown in Figures 1 and 2, respectively.
In 2006, the total value of fish landed into Scottish ports by vessels of all nationalities was £390 million, representing a three per cent increase over the value of landings in 2005, at 2006 prices. The increase in value compared with 2002 (at 2006 prices) is 12 per cent. In 2006, the total quantity landed into Scottish ports by vessels of all nationalities was 385 thousand tonnes, 13 per cent lower than in 2005, but two per cent higher than in 2002 ( Table 17). The 2006 pelagic landings have been affected by the repayment arrangements agreed with the Commission for historic undeclared landings of herring and mackerel. Repayment started in 2006 and covered some undeclared landings in 2005 and 2006. There has been a substantial switch in the contribution of the demersal and pelagic sectors since 2002, with demersal species declining from 43 per cent to 30 per cent of landed volume, while pelagic species have increased from 44 per cent to 55 per cent ( calculated from Table 17). Since 2002 the quota for key demersal 4 and key pelagic 5 stocks has decreased by 20 and 27 per cent respectively.
Table II: Combined UK quota ('000 tonnes) for key demersal and pelagic stocks 2001-2005 ( based on Table 15)
Quota ('000 tonnes) |
2002 |
2003 |
2004 |
2005 |
2006 |
Change 2002 - 2006 |
|---|---|---|---|---|---|---|
Combined key demersal stocks |
186 |
128 |
141 |
142 |
149 |
-37 (-20%) |
Combined key pelagic stocks |
282 |
276 |
277 |
251 |
206 |
-75 (-27%) |
2.3 Landings by UK vessels into Scotland by area and district
In 2006, UK vessels landed 290 thousand tonnes of all species, at a value of £320 million, into Scottish ports. These landings represent an increase of 2 per cent in value from 2005 (at 2006 prices) but a decrease of 21 per cent in quantity ( Table 17). This decrease in quantity landed is mainly due to the decrease in pelagic landings. The value of landings at 2006 prices by UK vessels into Scotland has increased by 13 per cent since 2002.
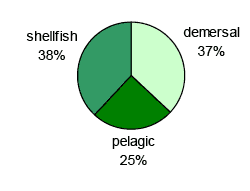
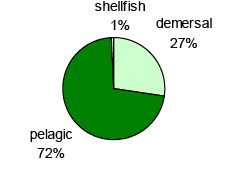
The species combination of these landings was broadly similar to that of landings by Scottish based vessels (Chart I), although pelagic vessels formed a smaller proportion of the UK landings into Scotland total (Chart II) as Scottish vessels landed 85 thousand pelagic tonnes abroad ( Table 17).
Chart II: Landings6by UK vessels into Scotland, 2006
Quality: total 289,200 tonnes |
Value( 6): total £323.7 million |
 |
 |
Regional breakdown
Eastern Area: Eyemouth, Pittenweem, Aberdeen, Peterhead, Fraserburgh, Buckie
(Comparisons calculated from table 21)
- In 2005, the value of landings by UK vessels into the six eastern districts increased by four per cent to £168 million despite the volume of landings decreasing by 19 per cent to 158,000 tonnes.
- Only Aberdeen and Buckie experienced decreases in the value of landings in 2006.
Northern Area: Wick, Orkney, Shetland, Stornoway, Kinlochbervie, Lochinver
- The value of pelagic landings into Shetland decreased by 37 per cent to £26 million causing an overall decrease of £7 million in the total value of all landings into Shetland.
- The value of landings into Stornoway increased by £4 million between 2005 and 2006 due to the increase in the value of shellfish landed. The value of landings into other ports in the Northern area in 2006 were very similar to the values in 2005.
Western Area: Ullapool, Mallaig, Portree, Oban, Campbeltown, Ayr
- The value of landings into the Western area increased by 25 per cent while the volume increased by 2 per cent. This increase in the value of landings is largely a result of the higher prices obtained for shellfish.
- The improved shellfish prices meant that the value of landings increased in all districts in the Western area.
2.4 Landings by foreign vessels into Scotland
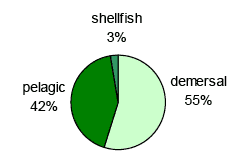
Foreign vessels landed 96 thousand tonnes of fish worth £67 million into Scottish ports in 2006, a 28 per cent increase in quantity and a six per cent increase in value from 2005 (at 2006 prices). The proportion of total tonnage landed by foreign vessels in increased from 17 per cent in 2005 to 25 per cent in 2006 (Table 17). This increase in the proportion of quantity landed by foreign vessels reflects an increase of 25 thousand tonnes of pelagic species landed by foreign vessels and a decrease of 73 thousand tonnes in pelagic landings by UK vessels.
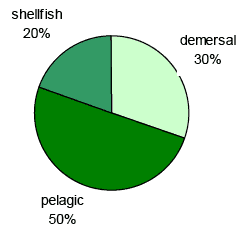
In 2006 the species types landed by foreign vessel was different to recent years, due to an increase in the volume and value of pelagic landings into Scotland, with pelagic forming 72 per cent by volume and 42 per cent by value (Chart III). Most of the remainder comprised demersal species, with negligible landings of shellfish of just 693 tonnes in 2006 ( Table 24).
Chart III: Foreign landings7into Scotland by species type, 2006
Quality: total 95,700 tonnes |
Value( 7): total £66.9 million |
 |
 |
2.5 Uptake of UK quota
2.5.1 Demersal stocks
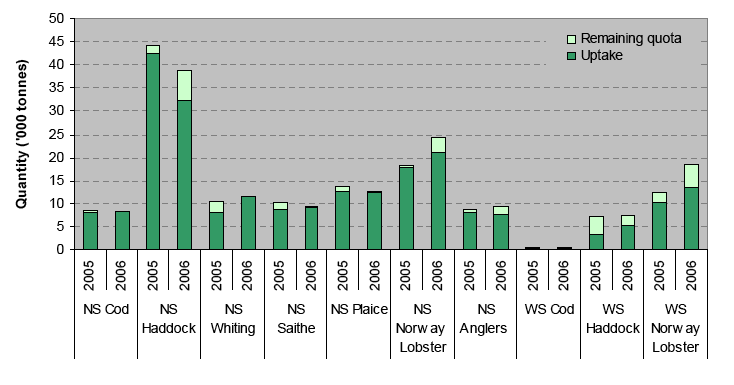
Quota uptake reached 90 per cent or more for four of the ten most valuable demersal stocks ( NS Cod, NS Saithe, NS Plaice, and NS Whiting; Chart IV, Table 15). Uptake of these key quota stocks in 2006 was broadly similar to that in 2005, with some notable exceptions:
- Uptake of NS Whiting increased from 77 to 98 per cent as landings increased by 42 per cent while quota increased by 11 per cent.
- Uptake of NS Haddock decreased from 96 to 83 per cent despite quota decreasing by 11 per cent.
- Uptake of NS Nephrops fell from 100 to 86 per cent, mainly because an increase in quota of 35 per cent resulted in landings increasing by only 16 per cent.
- Uptake of WS Nephrops fell from 83 to 74 per cent, mainly because an increase in quota of 49 per cent resulted in landings increasing by only 33 per cent.
Chart IV: Quota uptake of main North Sea ( NS) and West of Scotland ( WS) demersal stocks by UK vessels in 2004 and 2005
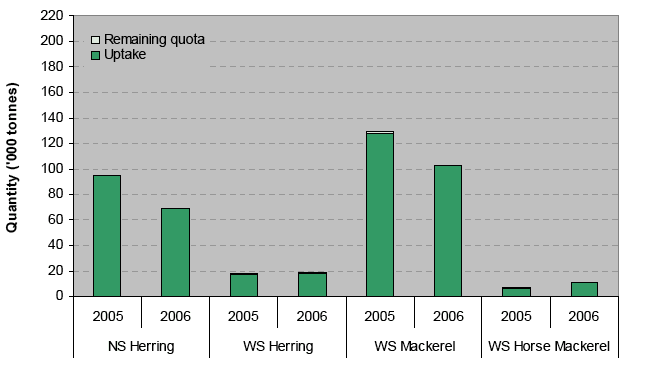
2.5.2 Pelagic stocks
Quota uptake for the four most important pelagic stocks continued to be high in 2006, approaching 100 per cent for NS Herring, WS Herring and WS Mackerel and exceeding 90 per cent for WS Horse Mackerel. This was in spite of large differences in quota from 2005:
- NS Herring quota decreased by 27 per cent due to payback arrangements, landings correspondingly decreased by 27 per cent.
- WS Mackerel quota decreased by 20 per cent due to payback arrangements; landings correspondingly decreased by 20 per cent.
- WS Horse Mackerel quota increased by 68 per cent and landings correspondingly increased by 70 per cent.
Chart V: Quota uptake of main North Sea ( NS) and West of Scotland ( WS) pelagic stocks by UK vessels in 2004 and 2005