Scottish Nitrogen Balance Sheet 2020
The Scottish Nitrogen Balance Sheet brings together evidence on flows of nitrogen in Scotland from across the whole economy to understand and keep track of the use of nitrogen.
Flows of Nitrogen in the Scottish Economy
Overview
The full SNBS dataset contains hundreds of individual flows of nitrogen, which have been aggregated to provide overviews in the sections below[2]. It is clear that nitrogen flows across the Scottish economy and environment are highly complex. In particular, much of the nitrogen which enters into the system (e.g. from fertiliser use) is recycled within it – often in complex ways – before forming either a useful output (e.g. via food products) or a loss to the environment (e.g. via emissions to air).
Nonetheless, by far the largest overall “engine” of nitrogen use in Scotland is associated with food production. Overall, out of the 78.1 kt N / yr of total useful nitrogen-containing outputs produced in Scotland, almost 80% of these are associated with food production (namely 55.4 kt N / yr of foodstuffs from agriculture, with the remainder from aquaculture and landings from sea fisheries).
The nitrogen cycle for food production is also then closely linked with waste management, through the consumption of food for human nutrition and subsequent excretion.
There are also several sets of nitrogen flows that are largely independent of the food production system, including those associated with the combustion of fossil fuels (via transport, industry and wider energy use), although these are generally much smaller in magnitude and much simpler in structure (i.e. direct emissions to the air).
The remaining sub-sections of this chapter provide further detail on the nitrogen flows for key sectors of Scotland’s economy and environment. All of these results are at the national scale.
Summary of nitrogen flows to/from the atmosphere
The atmosphere acts as both a sink for nitrogen-containing emissions from both anthropogenic activities and natural processes, and as a source of the nitrogen deposited to soils and habitats. In addition, the atmosphere acts as a transport medium, bringing imports of air pollutants to Scotland and carrying away some of the pollutants beyond Scotland’s borders (this is referred to as transboundary air pollution).
Total emissions of nitrogen to air in Scotland amount to around 58.7 kt N / yr.
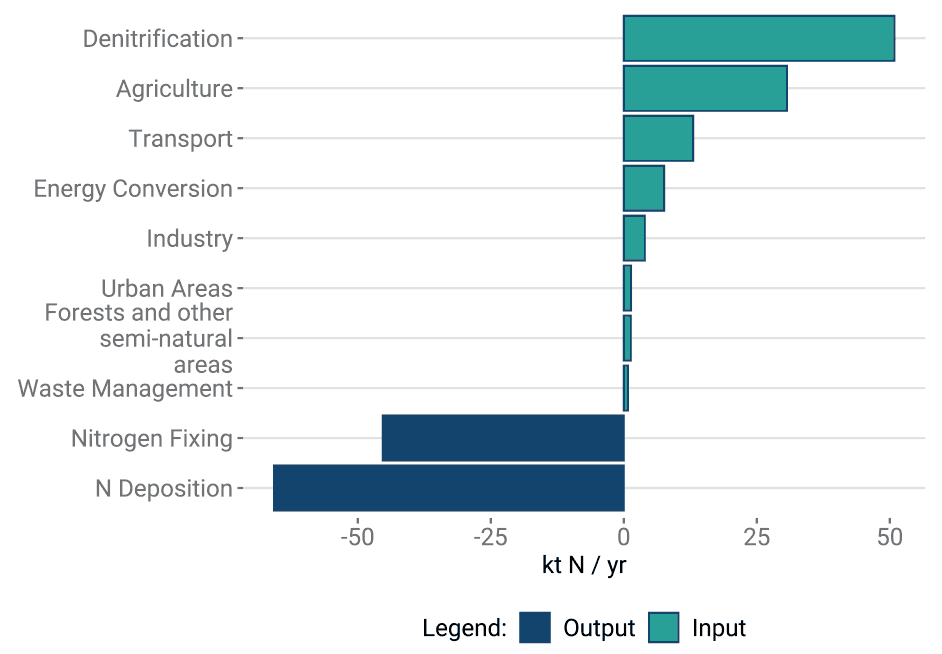
Nitrous oxide (N2O), which is a greenhouse gas, amounts to around 7.8 kt N / yr of these total emissions. The majority of nitrous oxide emissions come from agriculture (5.5 kt N / yr) with other contributions from land use and land use change (1.5 kt N / yr) and more minor ones from industry, transport and waste processing. Nitrous oxide is a potent greenhouse gas, with a global warming potential (i.e. conversion factor to carbon dioxide equivalent) of 298. Scottish greenhouse gas emissions statistics for 2020 show that the 7.8 kt of N in the nitrous oxide emissions amounted to 3.7 Mt of CO2 equivalent, which represents 9.1% of Scotland’s total greenhouse gas emissions for that year. This makes it the third most significant greenhouse gas, after CO2 itself (which represents 65.8% of the total) and methane (which represents 22.4% of the total).
The remaining emissions of nitrogen to the atmosphere are as other (i.e. non-greenhouse gas) air quality pollutants. These total 50.9 kt N / yr, split broadly evenly between nitrogen dioxide (NO2, 25 kt N / yr), mainly from combustion in transport, industry and wider energy use) and ammonia (NH3, 25.9 kt N / yr), mainly from agricultural sources. Compared with these total air quality pollutant emissions from Scotland’s territory, it is also estimated that 64.2 kt N / yr of nitrogen is deposited from the atmosphere, making Scotland a net importer of air pollution. The imported atmospheric nitrogen arrives in Scotland through regional and long-range transport and dispersion of air quality pollutant emissions, from both the rest of the British Isles (UK and Republic of Ireland), international shipping and the European mainland. The nitrogen deposition figures in the SNBS are estimated through modelling (in combination with measurements from the UK’s national monitoring networks), and data are derived annually for Official Statistics on behalf of Defra.
Additional nitrogen inputs to semi-natural habitats from atmospheric deposition can cause substantial biodiversity effects, damaging sensitive vegetation and the wildlife dependent on it for feeding and/or breeding. Atmospheric nitrogen pollutants can also cause damage to both vegetation and human health in areas of high concentrations near the emission sources.
The spatial distribution of air pollutant emissions and atmospheric concentrations therefore matters in terms of where impacts occur. For nitrogen deposition, there are two main pathways, dry deposition (which occurs closer to the sources) and wet deposition (which can travel long distances, often hundreds of kilometres). Impacts on remote areas are typically therefore due to wet deposition, especially in high rainfall areas. By contrast, greenhouse emissions are not re-deposited, but remain in the atmosphere, contributing to climate warming on a global scale.
A further pathway of nitrogen to the atmosphere is through denitrification as di-nitrogen (N2), which is neither a greenhouse gas nor an air pollutant. Denitrification is a microbial process that converts nitrogen from soils (especially wetlands) and water bodies through a series of reactions. Denitrification also plays an important role in sewage treatment, helping to remove nitrogen from water and thereby cleaning it. Denitrification is difficult to estimate as it involves a complex series of processes with high degrees of uncertainty. However, estimates can be made using existing scientific literature and expert knowledge. Overall, about 50.9 kt N / yr are estimated to be emitted as N2 in Scotland, with 36.3 kt N / yr from terrestrial soils (including wetlands) and the remainder from hydrological systems.
Summary of nitrogen flows to/from the hydrosphere and aquatic ecosystems
Scotland’s hydrosphere and aquatic (freshwater and coastal) ecosystems absorb and move nitrogen. The nitrogen mainly originates from anthropogenic activities but also in some cases from natural nitrogen cycling processes. The main direction of these flows is through river catchments and groundwater bodies into coastal waters.
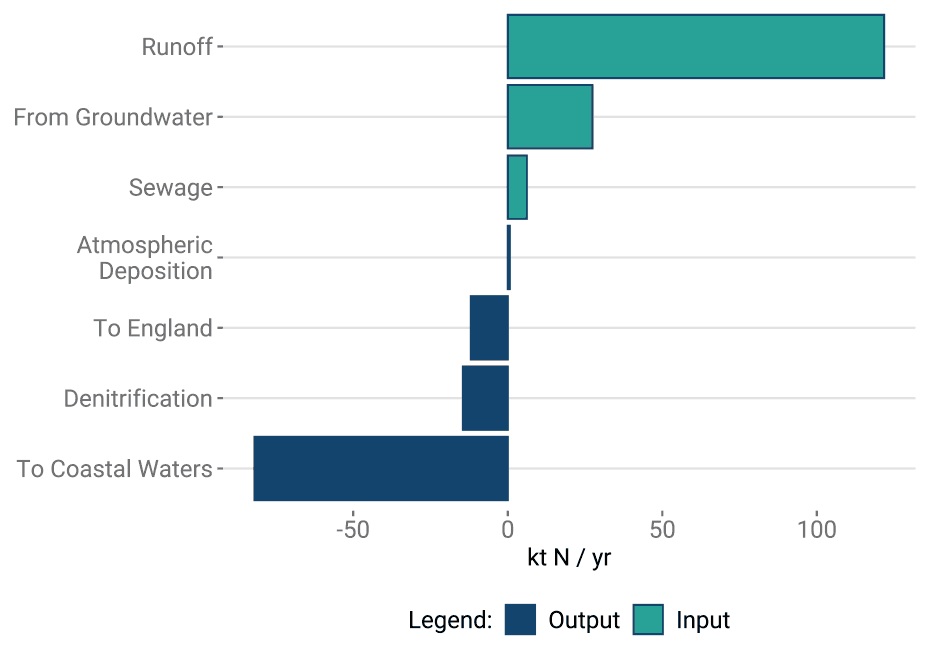
The main hydrological flows of nitrogen within Scotland are due to run-off and leaching from soils, with the majority of these losses linked to grasslands (estimated at 58.5 kt N / yr), arable (45.5 kt N / yr) and semi-natural habitats (17.8 kt N / yr from a combination of woodlands, heaths, grasslands, montane, etc.). Discharges from sewage processing and industrial sources contribute a further 6.1 kt N / yr.
These sources, combined with legacy nitrates in groundwater (mainly in some aquifers in eastern Scotland and estimated at 27.4 kt N / yr), together contribute to a total estimated discharge of nitrogen into Scottish coastal waters of around 155.3 kt N / yr. A further 15.4 kt N / yr is exported to England via the River Tweed, which crosses the border shortly before reaching the coast at Berwick-upon Tweed.
Within coastal waters themselves, excreta from aquaculture are a further source of nitrogen input, estimated at around 13.8 kt N / yr.
Flows of nitrogen into the hydrosphere can lead to eutrophication, with subsequent harmful impacts of marine ecosystems. Eutrophication occurs when the enrichment of waters by nutrients (nitrogen and phosphorus) causes excessive growth of phytoplankton resulting in an undesirable disturbance of the marine ecosystem.
Food production: agriculture
Agricultural activities in Scotland produce a diverse range of useful nitrogen-bearing outputs: crops (for human consumption, livestock feed, biomass and seed production) and also livestock produce (e.g. dairy, meat, eggs, wool), adding up to an estimated total of 55.4 kt N / yr.
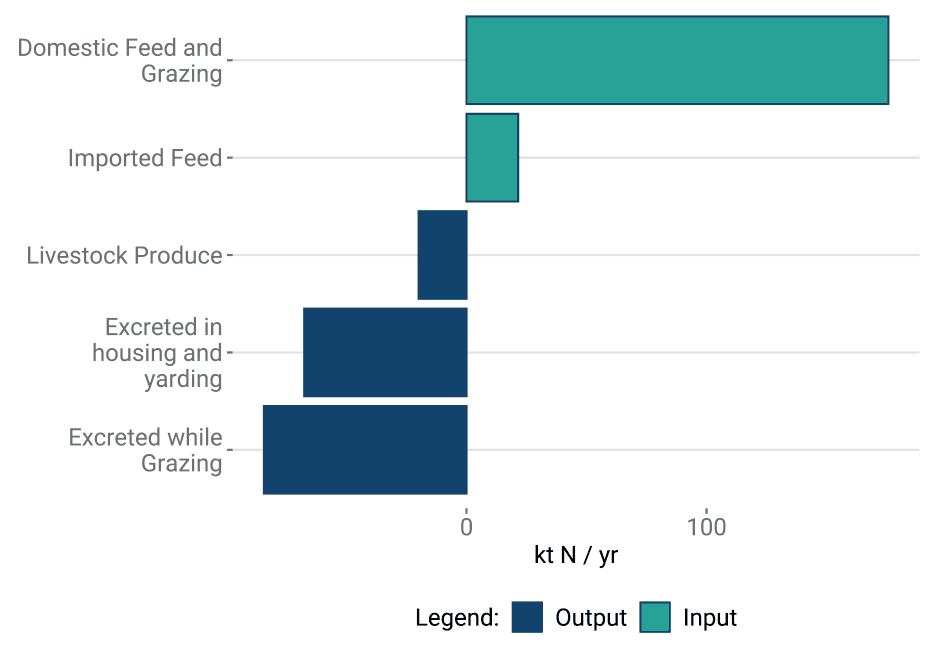
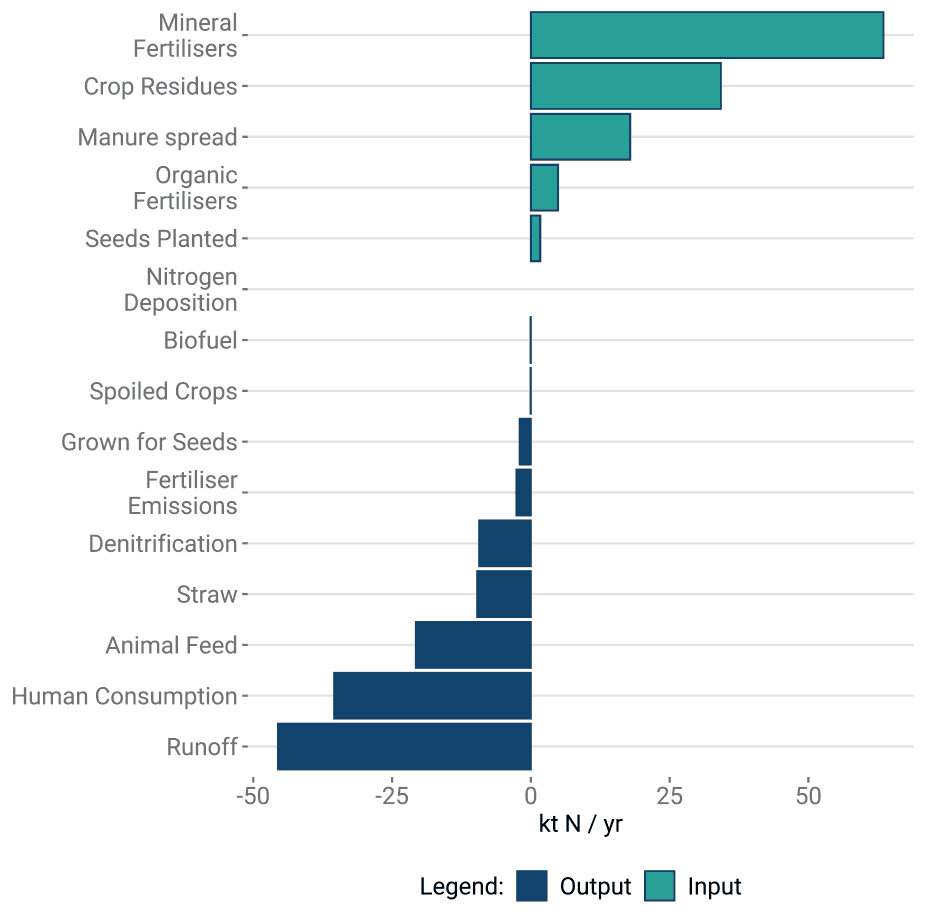
The production of these outputs requires the input of nitrogen as a nutrient to soils, which happens principally through anthropogenic intervention via both mineral (artificial) fertilisers and organic manures and slurries. These are predominantly of artificial origin with 130 kt N / yr of mineral fertilisers are applied compared to 9.8 kt N / yr of organic fertilisers
In addition to the anthropogenic inputs, 18.4 kt N / yr of biological nitrogen fixation through legumes occurs; 1.8 kt N / yr from peas and beans, and 16.6 kt N / yr from clover in grasslands. A further 12.1 kt N / yr is supplied by atmospheric deposition to agricultural areas.
Finally, an estimated 21.5 kt N / yr of nitrogen is imported into Scotland as livestock feed (e.g. soy, maize, beet pulp, etc.) which, when combined with Scottish-grown crops and grass forage, provides a total of 197.3 kt N / yr of nitrogen fed to animals.
Nitrogen losses from agriculture to the environment follow two main pathways:
- emissions to the atmosphere, as the air quality pollutants ammonia (NH3, emissions of 24 kt N / yr) and nitrogen dioxide (NO2, emissions of 1.2 kt N / yr) and as the greenhouse gas nitrous oxide (NO2, emissions of 5.5 kt N / yr).
- run-off and leaching from agricultural soils[3] to catchments and groundwater (flows of 104 kt N / yr, mainly as nitrates, but also dissolved organic and inorganic and particulate forms).
Food production: aquaculture
The dominant activity in terms of nitrogen flows for Scottish aquaculture is fin fish farming, mainly salmon in cages in coastal waters. The sector also includes the much smaller (in nitrogen terms) shellfish and freshwater aquaculture operations.
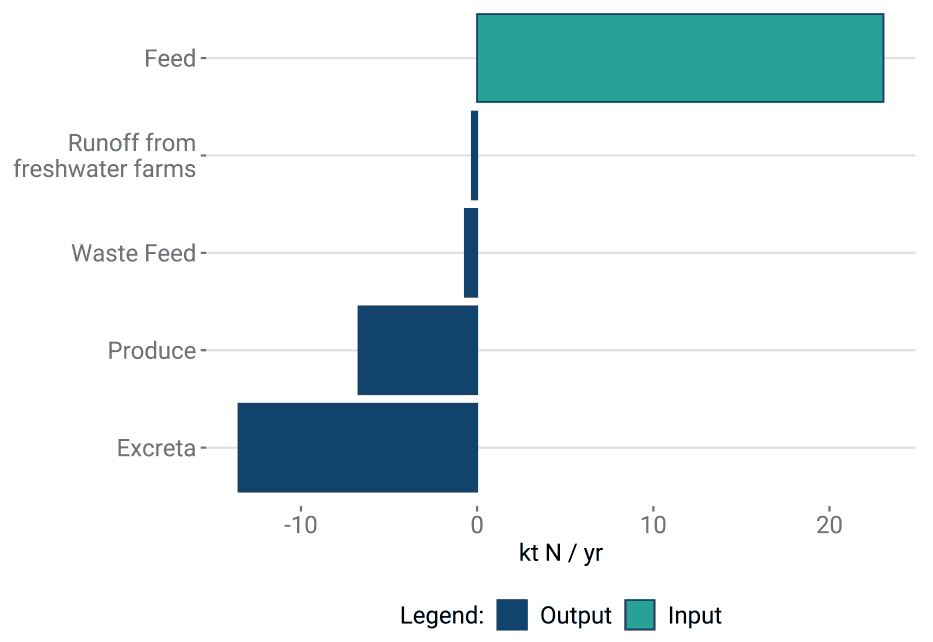
Useful outputs of nitrogen in harvested fish and shellfish produce are estimated at 6.9 kt N / yr, whereas the estimated anthropogenic input of feed into the system is at 23.1 kt N / yr. Losses of nitrogen into coastal waters are estimated at 14.5 kt N / yr, this being mostly in the form of nitrogen excreted by the fish, with only a small amount (estimated at 3%) of feed itself being lost.
Transport
Nitrogen’s use in transport comes from its presence in the fossil fuels burnt by vehicles in Scotland. Most of this nitrogen is in the fossil fuels burnt by road vehicles (1.2 kt N /yr), which burn both petrol and diesel. Air transport (0.21 kt N /yr) and water transport (0.13 kt N /yr) are the next two largest users of nitrogen in transport. Rail transport uses the least amount of nitrogen (0.012 kt N /yr), mostly from diesel.
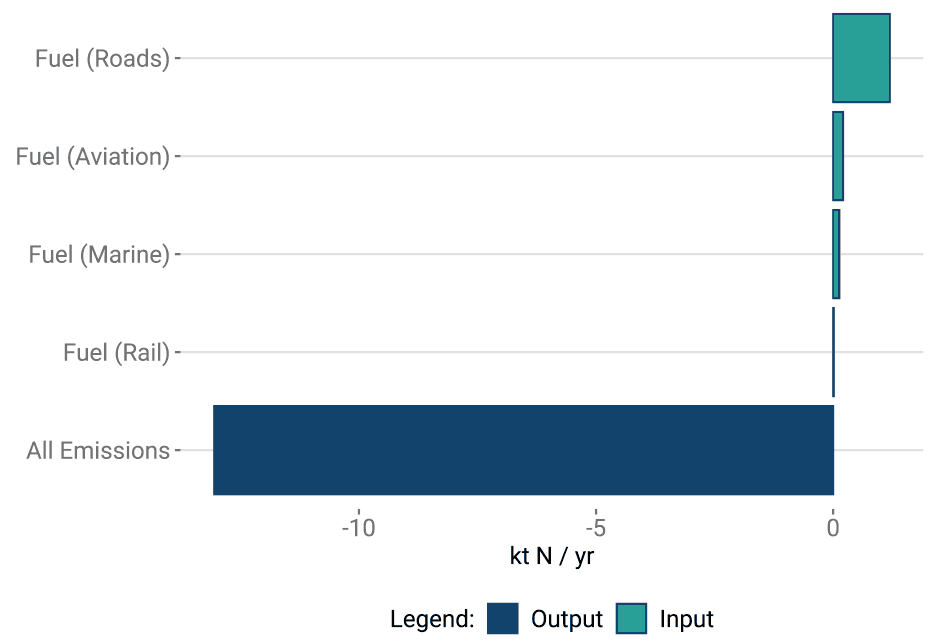
The key nitrogen flows from the transport sector are emissions to the atmosphere (13.1 kt N / yr), resulting from fuel combustion. The majority of these emissions are of air quality pollutants, mainly nitrogen dioxide (NO2, emissions of 12.6 kt N / yr), and small amounts of ammonia (NH3, emissions of 0.25 kt N / yr). Greenhouse gas emissions of nitrous oxide (N2O) only amount to 0.2 kt N / yr, with the main climate effect from transport sources being due to emissions of CO2.
Industry and Energy
As with transport, the key nitrogen flows in the industry and energy sectors relate to fossil fuel combustion emissions to the atmosphere, totalling 11.3 kt N / yr.
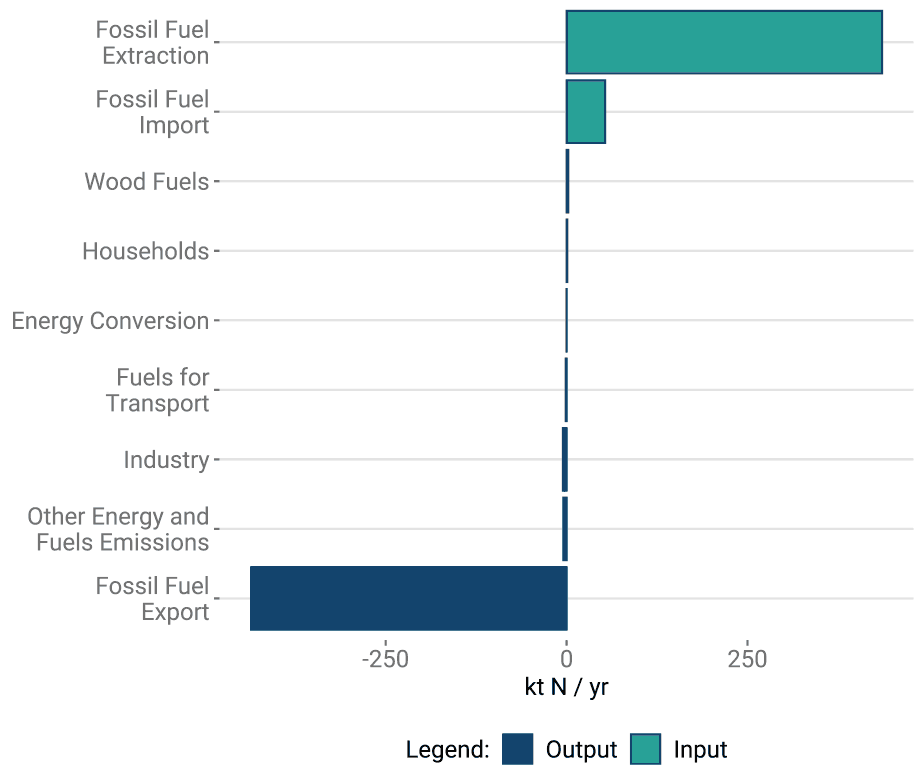
The vast majority of this is emitted as the air quality pollutant nitrogen dioxide (NO2) with a minor contribution from ammonia (NH3). Emissions of the greenhouse gas nitrous oxide (N2O) only make up a small part of the overall emissions from these sectors (at 0.19 kt N / yr). This is because, again in the same way as for transport, the majority of the climate impact from fossil fuel combustion in these sectors occurs as CO2.
Humans and settlements (including waste management)
Important flows of nitrogen related to human activity in Scotland include the food (i.e. protein) intake of the population and the related nitrogen excretion that is collected and processed/recycled or disposed of as sewage (around 23.1 kt N / yr). There are also minor emissions to the atmosphere of ammonia (NH3, emissions of around 1.2 kt N / yr in total).
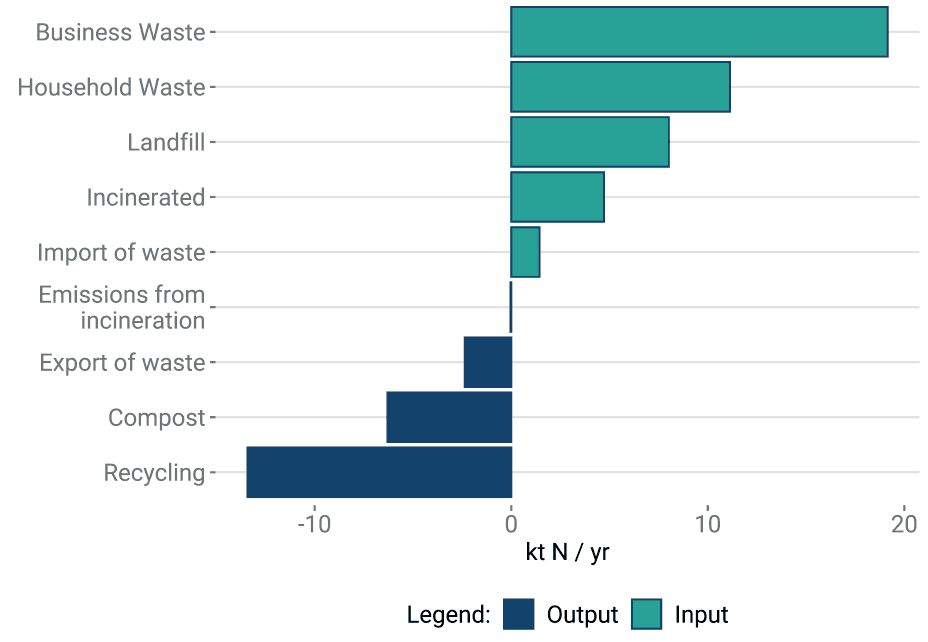
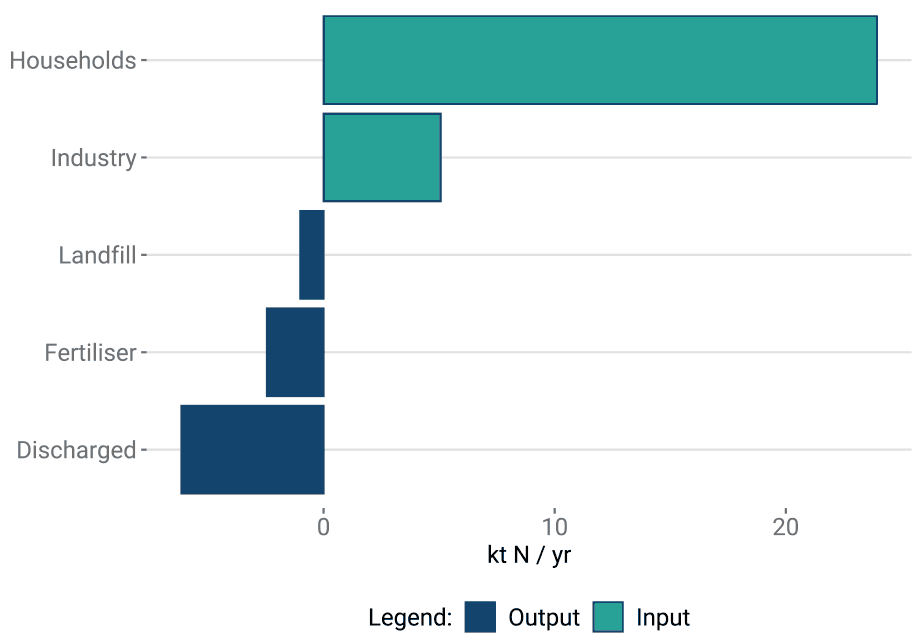
There are then also a range of other nitrogen flows closely linked to the waste management system, comprising activities such as anaerobic digestion, composting and waste water/sewage processing. These processes allow for valuable nutrients, including nitrogen, to be recycled and utilised for growing crops and grass, and land reclamation. However, these activities as well as others within the waste sector (such as incineration and landfill) do also produce some emissions to the air.
Of a total nitrogen flow of around 30.3 kt N / yr from household and business/industrial waste, plus the 23.1 kt N / yr of human excreta generated in Scotland (see above), it is estimated that around 13.1 kt N / yr are applied back to Scottish soils. A further 11.2 kt N / yr are lost to water, of which around half is from human sewage and half from discharge by industry and food production. Atmospheric emissions from waste processing are relatively minor and estimated at less than 0.69 kt N / yr (mainly of ammonia and nitrous oxide).
Other nitrogen associated with the waste sector is re-used within the Scottish economy (estimated at 13.4 kt N / yr) or buried in landfill sites (estimated at 8.7 kt N / yr).
Forests, woodlands and terrestrial semi-natural ecosystems
Scotland’s forest and woodland resource consists of different woodland types and tree species, ranging from traditional mixed Highland estates to the highly productive forests, such as the Tay Forest Park, and from urban forests in and around our cities to the more sensitive (in terms of nitrogen deposition) native woodlands, such as the Atlantic oakwoods in Argyll. These diverse and versatile forests and woodlands provide considerable economic and environmental benefits, as well as helping to improve people’s quality of life.
One of the key economic benefits provided by Scotland’s forests and woodlands is the production of timber and other wood fibre. It should be noted that such wood products are largely composed of carbon and contain relatively little nitrogen, compared with forest residues, including leaf litter and brash, which are generally retained in the forest where nutrients are naturally recycled.
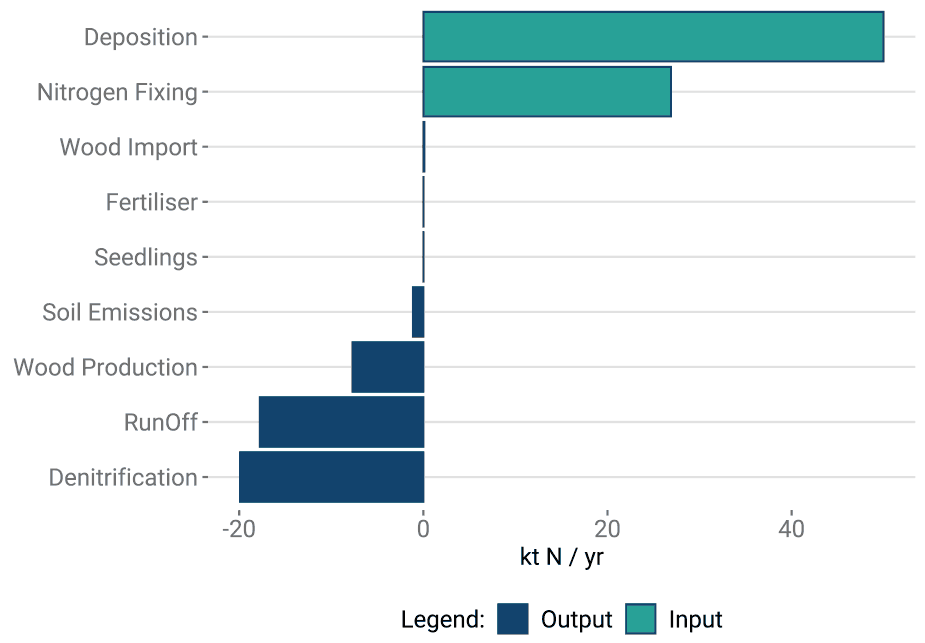
Nonetheless, the full SNBS dataset does allow for estimates to be made of aspects of the forestry nitrogen cycle in isolation. In terms of economic production, the nitrogen in wood harvested in Scotland during 2020 was mostly destined for material (4.9 kt N / yr) and energetic (2.3 kt N / yr) uses, with a further 0.4 kt N / yr exported as roundwood (against a much smaller import of 0.1 kt N / yr).
For re-planting existing woodlands and for establishing new woodlands, nitrogen-containing fertiliser is only applied on a site specific basis where a nutrient deficiency has been identified or is highly likely, with an estimated use of only 0.02 kt N / yr. As such, the vast majority of nitrogen input to Scottish forests and woodlands occurs through either biological nitrogen fixation (10.9 kt N / yr) or nitrogen deposition from the atmosphere (17.1 kt N / yr).
High levels of nitrogen deposition can also pose challenges for sensitive near-natural woodlands, adversely affecting biodiversity - especially lichens that grow on trees and require clean air to thrive. Elevated ammonia concentrations from nearby emission sources can also have a similar effect. Official Statistics are released annually for the UK, with separate country data for Scotland, on the area of habitats and designated sites that exceed critical thresholds for atmospheric nitrogen input for ammonia concentrations (critical level exceedance) and total nitrogen deposition (critical loads exceedance)[4].
Other semi-natural habitats in Scotland, such as bogs, heathlands and montane vegetation, are similarly threatened by nitrogen input from atmospheric deposition (the SNBS estimates the deposition flow to these habitats as 32.8 kt N / yr).
A proportion of the nitrogen deposited from the atmosphere onto forests, woodlands and other semi-natural habitats then makes its way into waterbodies, through leaching and run-off (the SNBS estimates these flows as 17.8 kt N / yr)[5].
Contact
Email: CCStatsModelling@gov.scot