Scottish Local Government Finance Statistics (SLGFS) 2019-20
Annual publication providing a comprehensive overview of financial activity of Scottish local authorities in 2019-20 based on authorities' audited accounts.
5. Debt and Prudential Indicators
5.1 Debt
When a local authority borrows money or uses a credit arrangement to finance capital expenditure a debt liability is created that the local authority has to repay from future revenues. A local authority is required to make loans fund advances in respect of capital expenditure it has determined should be met from borrowing. Loans fund advances are repaid in future years.
Table 5.1 provides a summary of local authorities' debt at 31 March 2020. Total debt across local authorities at 31 March 2020 was £19,377 million, an increase of 6.3 per cent, or £1,153 million, from 31 March 2019.
| General Fund 2 | HRA | Total | |
|---|---|---|---|
| Loans Fund Advances outstanding | 11,564 | 4,082 | 15,646 |
| Credit Arrangements | 3,729 | 2 | 3,731 |
| Total Debt | 15,293 | 4,084 | 19,377 |
Source: LFR CR
Notes
1 Total debt for General Fund and HRA between 2015-16 to 2019-20, including £ per person figures, is provided in Table 5.1a in the 'SLGFS 2019-20 - Publication Tables' Excel file.
2 General Fund figures include amounts relating to Harbour Accounts for Orkney and Shetland.
Total General Fund debt equated to £2,799 per person, an increase of £139 from £2,660 per person at 31 March 2019. Total HRA debt equated to £13,086 per HRA dwelling, an increase of £1,016 from £12,070 per HRA dwelling at 31 March 2019.
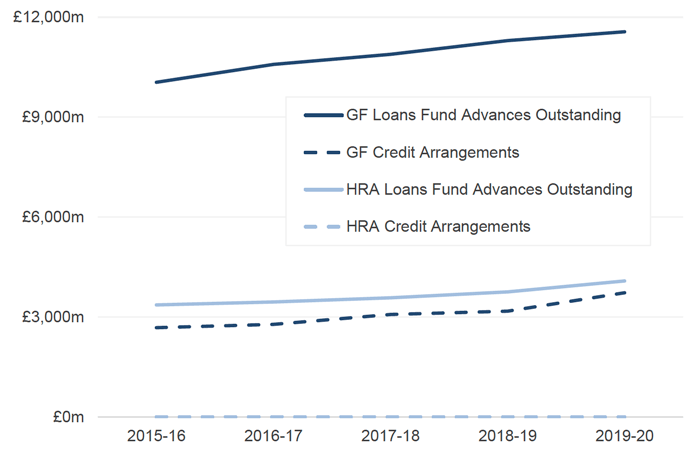
Chart 5.1 shows total debt at 31 March from 2015-16 to 2019-20 by type of debt and split by General Fund and HRA. Total debt has increased by 20.4 per cent, or £3,286 million, over this period. The split of total debt across the four categories shown has remained fairly consistent across this period with General Fund borrowing accounting for around three-fifths of total debt; HRA borrowing accounting for just over one-fifth; and General Fund credit arrangements accounting for just under one-fifth of total debt.
More information on the Loans Fund and credit arrangements, as shown in Table 5.1 and Chart 5.1, are provided in Chapters 5.1.1 and 5.1.2.
Source: LFR CR for 2019-20 and CR Final for all other years
Notes
1 General Fund figures include amounts relating to Harbour Accounts for Orkney and Shetland.
5.1.1 Loans Fund
The Local Authority (Capital Finance and Accounting) (Scotland) Regulations 2016 require a local authority to maintain a Loans Fund. Advances are made from the Loans Fund to record the amount of expenditure a local authority has determined should be met from borrowing, as permitted by legislation. The repayments made to the Loans Fund are the amount to be met in each financial year from a local authorities' revenue accounts.
The value of a Loans Fund will increase whenever an advance is made for expenditure incurred, or loans made, in any financial year. The value of a Loans Fund will decrease when Loans Fund Advances are repaid by making a charge to the General Fund or HRA. The balance on a Loans Fund at 31 March each year represents the amount of past expenditure a local authority has liability to fund from its future revenue budgets.
A local authority will borrow externally to fund the advances made from the Loans Fund. The balance on the Loans Fund should be similar to the value of external borrowing but there may be legitimate differences between the two values. Local authorities may borrow internally, that is use cash reserves, rather than borrowing externally, or may borrow in advance of incurring the actual expenditure to take advantage of favourable interest rates.
Table 5.2 provides a summary of local authorities' Loans Funds in 2019-20. The overall value of the Loans Fund across all local authorities at 31 March 2020 was £15,646 million, an increase of 4.3 per cent, or £640 million, from 1 April 2019.
| General Fund 2 | HRA | Total | |
|---|---|---|---|
| Loans Fund Advances outstanding at 1 April | 11,254 | 3,752 | 15,006 |
| Add: New advances from the Loans Fund | 667 | 460 | 1,128 |
| Less: Repayments made in year | 357 | 131 | 488 |
| Transfer in (+) or out (-) of assets between funds | -0 | 0 | - |
| Loans Fund Advances outstanding at 31 March | 11,564 | 4,082 | 15,646 |
Source: LFR CR
Notes
1 More detailed breakdowns of Loans Fund advances outstanding between 2015-16 and 2019-20 are provided in Tables 5.2a & b in the 'SLGFS 2019-20 - Publication Tables' Excel file.
2 General Fund figures include amounts relating to Harbour Accounts for Orkney and Shetland.
5.1.2 Credit Arrangements
Credit arrangements, such as finance leases, Private Finance Initiatives (PFI) and Public Private Partnerships (PPP)[17] are not charged to the Loans Fund, but are a form of borrowing and so are included in the total debt figures. Table 5.3 provides a summary of local authorities' credit arrangements in 2019-20. The overall value of credit arrangements outstanding across all local authorities at 31 March 2020 was £3,731 million, an increase of 18.9 per cent, or £592 million, from 1 April 2019. As noted in Chapter 3.1, the significant increase in new credit arrangements in 2019-20 can be attributed to sale and leaseback transactions for Culture and Related Services by Glasgow City Council.
| General Fund 2 | HRA | Total | |
|---|---|---|---|
| Credit Arrangements brought forward at 1 April | 3,136 | 2 | 3,139 |
| Add: New Credit Arrangements in year | 724 | - | 724 |
| Less: Repayments made in year | 131 | 0 | 131 |
| Credit Arrangements outstanding at 31 March | 3,729 | 2 | 3,731 |
Source: LFR CR
Notes
1 More detailed breakdowns of Loans Fund advances outstanding between 2015-16 and 2019-20 are provided in Tables 5.3a & b in the 'SLGFS 2019-20 - Publication Tables' Excel file.
2 General Fund figures include amounts relating to Harbour Accounts for Orkney and Shetland.
5.2 Prudential Indicators
The Chartered Institute of Public Finance & Accountancy (CIPFA) Prudential Code sets out a framework for a local authority to demonstrate its capital investment plans are affordable, prudent and sustainable. A number of prudential indicators are set and monitored against three year capital expenditure plans. Further, the Local Government in Scotland Act 2003 places a local authority under a statutory duty to set their own maximum capital expenditure limits and they must be set with regard to the Prudential Code. The key prudential indicators are:
- Capital Financing Requirement
- Total External Debt
- Operational Boundary
- Authorised Limit
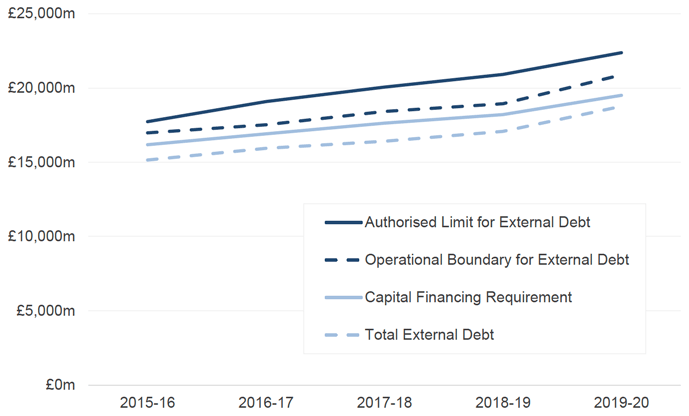
Chart 5.2 shows the change in prudential indicators between 2015-16 and 2019-20. All four indicators have increased at similar rates over this period. More information on the individual indicators is provided in the remainder of this chapter.
Source: LFR CR for 2019-20 and CR Final for all other years
5.2.1 Capital Financing Requirement (CFR)
The Capital Financing Requirement (CFR) represents the amount of capital expenditure a local authority has determined should be met from borrowing or funded from a credit arrangement, with the repayment of the debt met from future local authority budgets.
The CFR will increase each year by the amount of new capital expenditure to be financed by borrowing or credit arrangements, and will decrease by the amounts repaid. The CFR represents an authority's underlying need to borrow money.
Table 5.4 shows the CFR calculation for 2019-20. The CFR increased from £18,280 million at 1 April 2019 to £19,508 million at 31 March 2020. This means that local authorities had a higher amount of new capital expenditure to be financed by borrowing than amounts repaid in 2019-20. This increase in CFR was reflected across both the General Fund and HRA.
| General Fund 2 | HRA | Total | |
|---|---|---|---|
| Capital Financing Requirement at 1 April | 14,433 | 3,847 | 18,280 |
| Add: Capital exp. to be financed by borrowing | 667 | 460 | 1,128 |
| Add: Capital exp. to be financed by credit arrangements | 724 | - | 724 |
| Less: Loans Fund repayments | 362 | 131 | 493 |
| Less: Credit Arrangements repayments | 131 | 0 | 131 |
| Capital Financing Requirement at 31 March | 15,331 | 4,177 | 19,508 |
Source: LFR CR
Notes
1 The total CFR calculation between 2015-16 and 2019-20 is provided in Table 5.4a in the 'SLGFS 2019-20 - Publication Tables' Excel file.
2 General Fund figures include amounts relating to Harbour Accounts for Orkney and Shetland.
Chart 5.2 shows that local authorities' CFR has increased over the last five years which reflects the increase in local authority borrowing over this period.
5.2.2 Total External Debt
Total External Debt reflects local authorities' gross external borrowing and other long term liabilities. This may be less than the CFR where an authority has chosen to utilise cash reserves rather than borrow externally. Total External Debt may be more than the CFR where a local authority has chosen to borrow in advance of actual capital expenditure; however the Prudential Code limits borrowing in advance to the CFR amount plus up to two years planned capital expenditure to be funded from borrowing.
Table 5.5 shows that total external debt at 31 March 2020 was £18,767 million. Around four-fifths of total external debt (80.1 per cent or £15,035 million) related to external borrowing, with the remainder relating to credit arrangements outstanding.
| Total | |
|---|---|
| Actual external borrowing | 15,035 |
| Credit arrangements outstanding | 3,731 |
| Total External Debt | 18,767 |
Source: LFR CR
Notes
1 A detailed breakdown of Total External Debt between 2015-16 and 2019-20, including as a percentage of CFR, is provided in Table 5.5a in the 'SLGFS 2019-20 - Publication Tables' Excel file.
As shown in Chart 5.2, the CFR has remained above total external debt between 2015-16 and 2019-20. This means that local authorities continue to be under-borrowed, that is they are utilising internal cash reserves rather than borrowing externally. At 31 March 2020, total external debt was 96.2 per cent of the CFR, which is broadly consistent with prior years.
5.2.3 Operational Boundary and Authorised Limit
The Operational Boundary is based on local authorities' capital spending plans and should reflect the most likely, or prudent, but not worst case scenario for borrowing. In general, it is not significant if an authority breaches the operational boundary for a short period, however a sustained or regular trend above would be significant. At 31 March, the Operational Boundary across all local authorities was £20,879 million.
The Authorised Limit represents the maximum amount that the authority may borrow and is set at a level that reflects capital expenditure plans but includes headroom to allow for unusual cash movements, i.e. treasury management. The Authorised Limit across all local authorities was £22,379 million at 31 March 2020.
As shown in Chart 5.2, neither the operational boundary nor the authorised limit have been breached in the last five years. This means that local authorities' borrowing has consistently remained below these limits.
Contact
Email: lgfstats@gov.scot