Scottish Index of Multiple Deprivation: 2009 General Report
Scottish Index of Multiple Deprivation 2009: General Report
8. Geographic Access Domain
8.1. The access domain is intended to capture the issues of financial cost, time and inconvenience of having to travel to access basic services. This domain differs from the other domains as it consists of two sub-domains. One looks at public transport times to services and the other looks at drive times. This attempts to account for the fact that not everyone will have access to a car and so may be dependent on public transport. The domain measures aspects of access deprivation that are relevant to all people as it is important to be able to access key services in rural and urban areas. The indicators used in the access domain are listed in Annex B along with their relative weights.
Changes since SIMD 2006
8.2. The drive time : public transport weights for the sub-domains have been changed from _ : _ in SIMD 2006 to ¾ : ¼ in SIMD 2009. Analysis on the impact of this change on the domain is available as an annex to the SIMD 2009 technical report.
8.3. No changes have been made to the domain indicators since SIMD 2006. However, since there has been a change in the computer model used to calculate the travel times for both driving and public transport, the indicators are not directly comparable between SIMD 2006 and SIMD 2009. More information on this change is available in an annex to the technical report on the SIMD website.
8.4. Despite the changes in the access domains between SIMD 2006 and SIMD 2009 the two domains are highly correlated with a Pearson's correlation coefficient of 0.92.
Access Deprivation by Local Authority
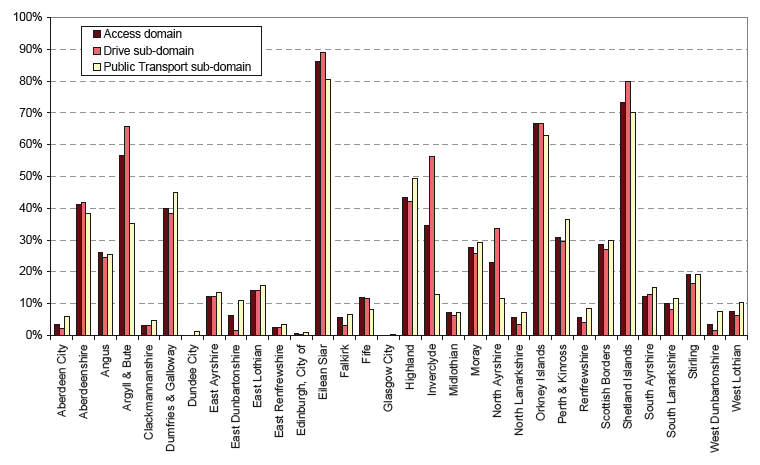
8.5. Chart 8.1 shows the proportion of the datazones in the 15% most deprived datazones in the access domain by Local Authority. Over half of each of Scotland's island Local Authorities are access deprived. 86% of the datazones in Eilean Siar are in the 15% most deprived on the access domain. Shetland Islands and Orkney Islands follow with 73% (no change) and 67% (up 8%), respectively. Argyll & Bute is the fourth most access deprived with 57% (up 14%).
8.6. The cities of Edinburgh and Glasgow show almost no signs of access deprivation in SIMD 2006 or SIMD 2009.
8.7. Some Local Authorities, for example Argyll and Bute, Inverclyde and North Ayrshire see the numbers of access deprived datazones increasing as they have large proportions of datazones in the 15% most deprived on the drive time sub-domain. Analysis of the data shows that for a large number of these datazones, the actual drive times are relatively low (a couple of minutes) but due to other areas having slightly quicker times, these areas are pushed into the 15% most deprived.
Chart 8.1: Proportion of datazones in each Local Authority in the 15% most deprived on the Access Domain of SIMD 2009 and the sub-domains
Access Deprivation by Urban Rural Classification
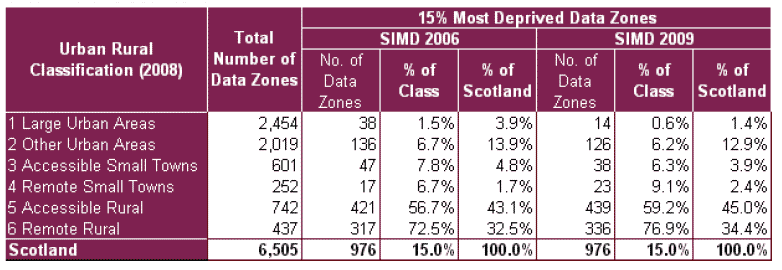
8.8. Table 8.1 shows the percentage of datazones in each category of the Urban Rural Classification 2008 that were in the 15% most deprived on the access domain in SIMD 2006 and SIMD 2009.
8.9. Three quarters of Remote Rural Areas and over half of Accessible Rural Areas are access deprived. Less than 10% of each of the remaining classes are access deprived.
8.10. Over three quarters of the 15% most access deprived datazones in Scotland are found in Accessible Rural Areas and Remote Rural Areas.
8.11. Overall, classes 1 to 3 have shown falls in their respective values for the number of datazones in the 15% most access deprived datazones, and classes 4 to 6 have shown rises.
Table 8.1: Class and National Share of Datazones in the 15% Most Deprived on the Access Domain by Urban Rural Classification
Change Over Time
8.12. There have been changes in methodology used in the access domain over the three updates of the SIMD, however each domain was the best measure of accessibility available at the time to identify deprived areas. It is therefore possible to look at which areas have appeared in the 15% most access deprived on the three versions of the SIMD. More details on the methodology changes can be found in the technical report.
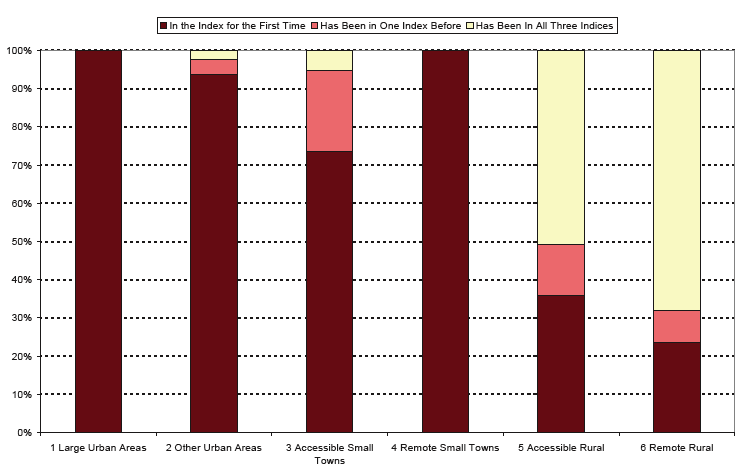
8.13. Chart 8.2 shows that most of the datazones from Rural Areas (Accessible and Remote) in the 15% most access deprived for SIMD 2009 have been deprived across all three versions of the SIMD.
8.14. All datazones from Large Urban Areas and Remote Small Towns in the 15% most access deprived for SIMD 2009 are in the most deprived for the first time, though this is only a small number of datazones. The lack of change in rural areas is unsurprising as access to services in these areas is difficult to change.
Chart 8.2: Datazones in the 15% most deprived (Access Domain) in SIMD 2009 showing the numbers of versions of the SIMD for which they have been in the 15% most deprived
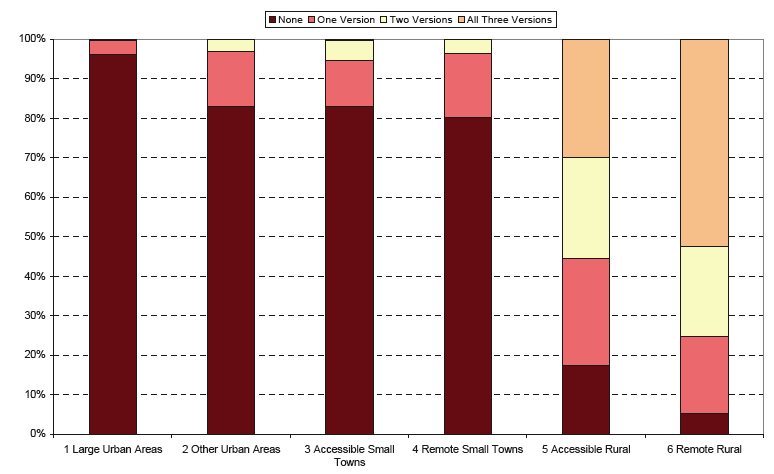
8.15. Chart 8.3 shows over half of all datazones in Remote Rural Areas have been in the 15% most access deprived across all three versions of the SIMD. Around 30% of the datazones in Accessible Rural Areas are in a similar situation.
8.16. Less than 4% of datazones in Large Urban Areas have been in the 15% most access deprived for one or more versions of the SIMD.
Chart 8.3: Proportion of Datazones in the 15% Most Deprived (Access domain) for One, Two, Three or None of the SIMD Versions by Urban Rural Classification