Scottish Household Survey: childcare topic report
This report presents data on the use of childcare by households with a child aged between two and five years old (not yet at school) using data from the 2019 Scottish Household Survey.
Use of Childcare
The Scottish Household Survey provides information on the different types and the number of hours of childcare used in school term-time and during school holidays; and also covers information on the main reasons parents/carers choose to use childcare.
Types of Childcare
The different types of childcare parents/carers use are:
- Local authority nursery or pre-school[9]
- Private nursery or pre-school
- Childminder
- Play group
- Family centre
- A relative or friend.
Among the different childcare options available, some parents/carers choose to use one or a mix of two or more of the types of childcare mentioned above. Some parents did not use any kind of childcare.
Overall, 79 per cent of households with a child aged two to five years used some form of childcare in 2019. Figure 1 shows that the most common form of childcare used was a local authority nursery or pre-school (41 per cent). Twenty seven per cent of households used a private nursery or pre-school for childcare, with 22 per cent using a relative or friend, 21 per cent using no childcare, and eight per cent using a childminder. Only three per cent used a playgroup, a decrease from six per cent in 2018. No households used a family centre or other form of childcare.
Percentage of households, 2018 and 2019 data
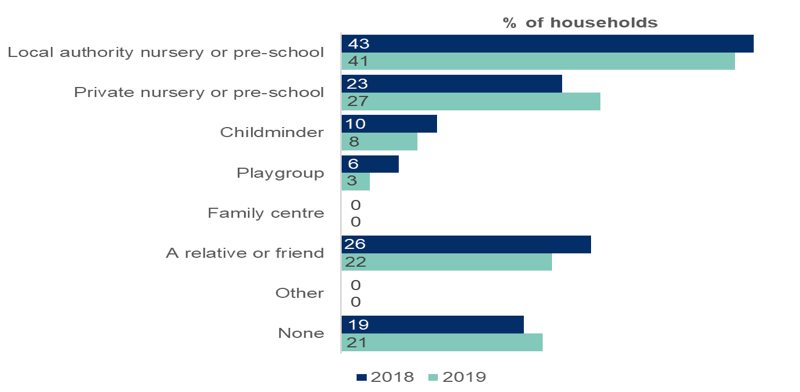
Table 1 shows that local authority nurseries are used by the majority of parents/carers who have children aged three years old (53 per cent) and four or five years old (60 per cent). Only nine per cent of parents/carers of two year olds used this type of childcare. This difference by age is likely to be due to the eligibility criteria for accessing funded Early Learning and Childcare (ELC). The statutory entitlement to funded ELC begins the term after a child's third birthday, although it is estimated that around 25 per cent of two year olds are entitled to funded childcare[10].
Private nurseries were the type of childcare most commonly used by households with a two year old (33 per cent), followed by a relative or friend (23 per cent). Households with a two year old were more likely to use no childcare (33 per cent) than households with a three year old (12 per cent) or a four or five year old (17 per cent).
| 2018 | 2019 | |||||
|---|---|---|---|---|---|---|
| Type of Childcare | 2 | 3 | 4+ | 2 | 3 | 4+ |
| Local authority nursery or pre-school | 13 | 52 | 62 | 9 | 53 | 60 |
| Private nursery or pre-school | 27 | 26 | 16 | 33 | 27 | 21 |
| Childminder | 10 | 10 | 11 | 7 | 10 | 6 |
| Playgroup | 11 | 5 | 4 | 8 | 2 | 1 |
| Family centre | 0 | 1 | 0 | - | - | 0 |
| A relative or friend | 27 | 26 | 26 | 23 | 24 | 19 |
| Other | 1 | - | 1 | - | - | 1 |
| None | 31 | 14 | 12 | 33 | 12 | 19 |
| Base | 210 | 270 | 220 | 230 | 230 | 280 |
Figure 2 shows the type of childcare used according to the level of deprivation in the area in which respondents live (using the Scottish Index of Multiple Deprivation (SIMD 2020)). Use of local authority nursery provision generally increased as area deprivation decreased. Over half (51 per cent) of households in the 20 per cent most deprived areas used local authority nurseries compared with one third (34 per cent) of households in the 20 per cent least deprived areas. However, use of private nurseries generally increased as area deprivation decreased with almost half (48 per cent) of the least deprived households using this type of childcare compared with only 13 per cent of households in the most deprived areas. Households in the 20 per cent least deprived areas were also less likely to use no childcare than households in the 20 per cent most deprived areas (10 per cent and 28 per cent respectively).
Percentage, 2019 data (minimum base: 130)
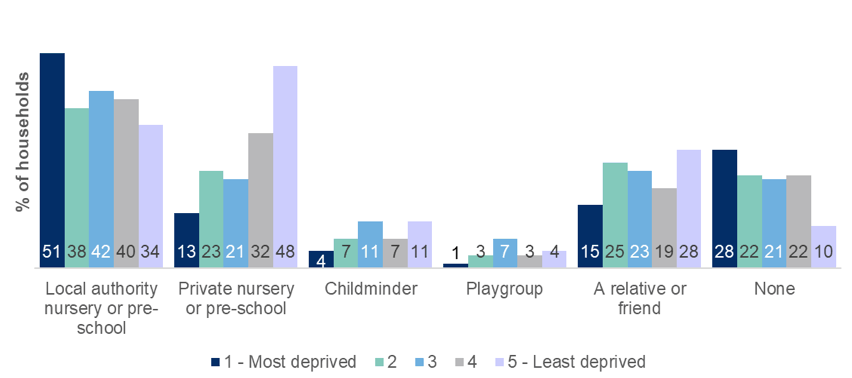
Figure 3 shows that households in remote rural locations are most likely to use no childcare (37 per cent), an increase from 13 per cent in 2018, and are more likely to use no childcare than households in other locations. A further 36 per cent of remote rural households use local authority nurseries for childcare. Local authority nurseries are the most common type of childcare used in all other locations.
Percentages, 2019 data (minimum base: 60)
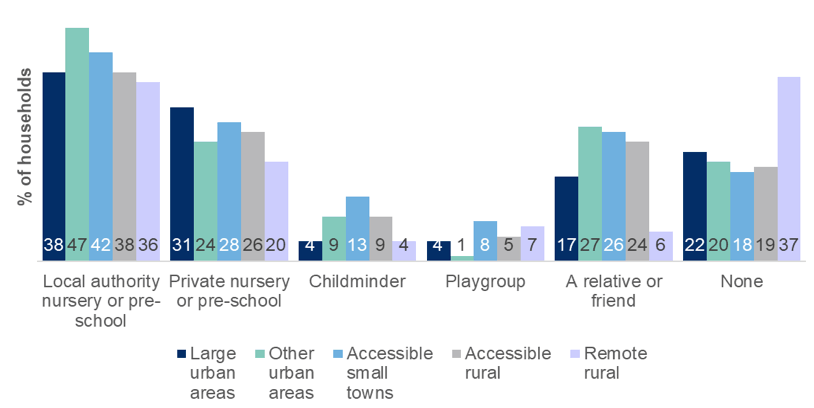
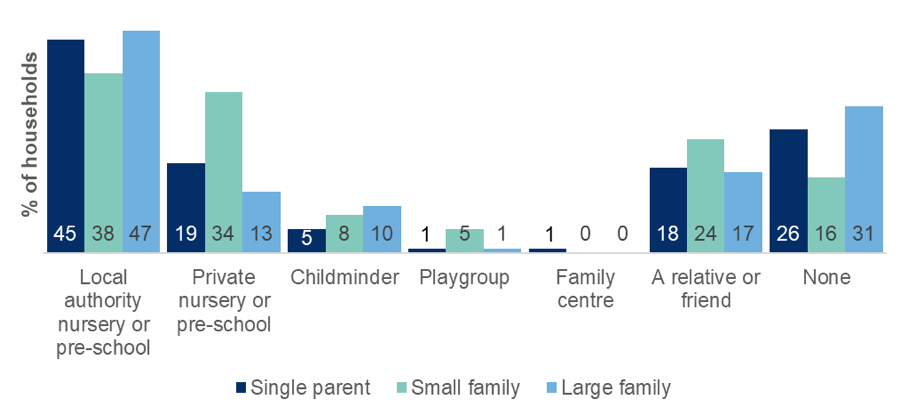
Figure 4 shows that local authority nurseries are the most common type of childcare used by all household types[13]. Small families were more likely to use a private nursery (34 per cent) than single parent[14] or large families (19 per cent and 13 per cent respectively). The proportion of large families using no childcare increased to 31 per cent in 2019 from 15 per cent in 2018, while their use of a relative or friend decreased from 28 per cent in 2018 to 17 per cent in 2019. Childminder use decreased in small families from 13 per cent in 2018 to eight per cent in 2019.
Percentages, 2019 data (minimum base: 140)
Hours of Childcare Used Per Week
The data presented below show the number of hours of childcare used by the families that used one or more of the types of childcare mentioned in the previous section.
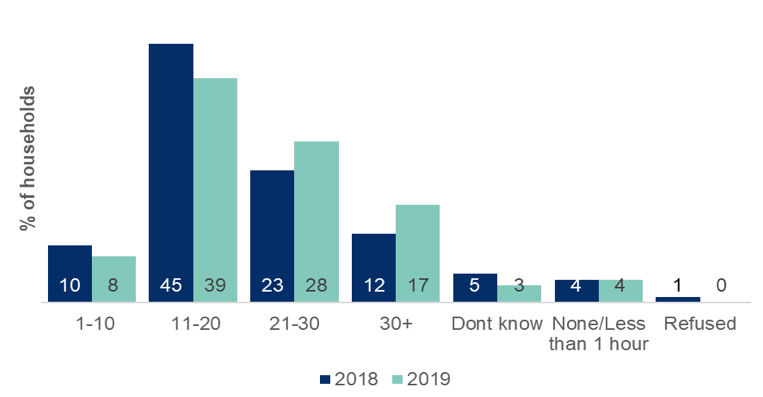
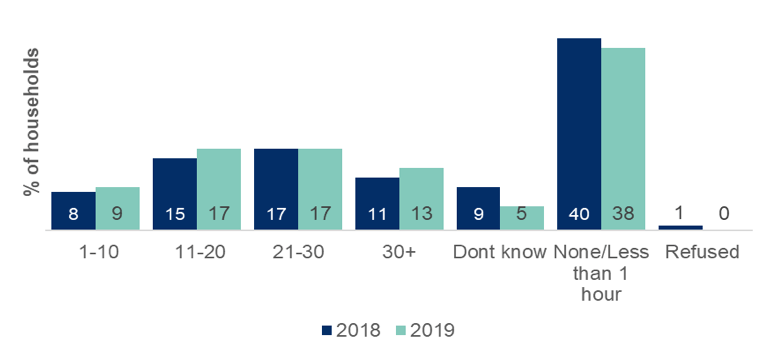
During term-time, 39 per cent of households used between 11 and 20 hours of childcare per week (Figure 5a). A further 28 per cent used between 21 and 30 hours per week, with 17 per cent using more than 30 hours and eight per cent using between one and ten hours. Only four per cent of households used less than one hour or no childcare during term-time, compared with 38 per cent of households during the holidays (Figure 5b). 17 per cent of households used both 11 to 20 and 21 to 30 hours of childcare per week during the holidays, with 13 per cent using more than 30 hours and nine per cent using between one and ten hours.
Figure 5: Hours of childcare used per week during school term-time (5a) and during school holidays (5b) (asked to families that use some type of childcare)
Percentages, 2018 and 2019 data (minimum base: 580)
Households with three year olds and four year olds and above were most likely to use 11 to 20 hours of childcare per week during term time (43 per cent and 44 per cent respectively, Table 2a). This is in line with the current entitlement of around 16 hours of funded ELC per week. Households with four year olds and above were less likely to use more than 30 hours of childcare per week (11 per cent) compared with households with two year olds (22 per cent) and 3 year olds (21 per cent).
During school holidays, households with three year old or four year old and above children most often used no childcare (42 per cent and 48 per cent respectively, Table 2b) compared with 21 per cent of households with two year olds. Use of childcare in the holidays by households with two year olds was primarily split between 11 to 20 hours (22 per cent), 21 to 30 hours (23 per cent) and over 30 hours (20 per cent) per week.
Table 2: Hours of childcare used per week during school term-time
| 2a | 2018 | 2019 | ||||
|---|---|---|---|---|---|---|
| Hours during term-time | 2 | 3 | 4+ | 2 | 3 | 4+ |
| 1-10 | 17 | 7 | 8 | 16 | 5 | 6 |
| 11-20 | 30 | 49 | 52 | 26 | 43 | 44 |
| 21-30 | 27 | 22 | 21 | 28 | 26 | 29 |
| 30+ | 18 | 12 | 8 | 22 | 21 | 11 |
| Dont know | 4 | 6 | 4 | 2 | 2 | 4 |
| None/Less than 1 hour | 4 | 4 | 5 | 5 | 4 | 5 |
| Refused | 0 | 1 | 1 | 0 | - | - |
| Base number | 150 | 230 | 200 | 160 | 200 | 230 |
| 2b | 2018 | 2019 | ||||
|---|---|---|---|---|---|---|
| Hours during holidays | 2 | 3 | 4+ | 2 | 3 | 4+ |
| 1-10 | 10 | 6 | 8 | 9 | 12 | 6 |
| 2b | 20 | 11 | 15 | 22 | 15 | 14 |
| 21-30 | 20 | 17 | 15 | 23 | 14 | 17 |
| 30+ | 15 | 11 | 8 | 20 | 12 | 10 |
| Dont know | 7 | 11 | 10 | 4 | 5 | 6 |
| None/Less than 1 hour | 29 | 43 | 44 | 21 | 42 | 48 |
| Refused | 0 | 1 | 0 | 0 | - | - |
| Base number | 150 | 230 | 200 | 160 | 200 | 230 |
Table 3a shows that during term-time, households in the 20 per cent least deprived areas were more likely to use more than 30 hours of childcare per week than other areas, with 29 per cent of these households using more than 30 hours in 2019, up from 14 per cent in 2018. Use of 21 to 30 hours per week increased in the SIMD quintile four from 21 per cent in 2018 to 36 per cent in 2019. Across all areas, 11 to 20 hours of childcare per week was the most common response.
During the school holidays, almost half of households in the 20 per cent most deprived areas responded that they use less than one hour or no childcare (49 per cent). This generally decreased as deprivation decreased, with 26 per cent of households in the 20 per cent least deprived areas using no childcare. The use of over 30 hours per week doubled in the 20 per cent least deprived areas from 12 per cent in 2018 to 24 per cent in 2019.
Table 3: Hours of childcare used per week during school term-time
| 3a | |||||
|---|---|---|---|---|---|
| Hours during term-time | 1 - most deprived | 2 | 3 | 4 | 5 - least deprived |
| 1-10 | 8 | 9 | 14 | 6 | 6 |
| 11-20 | 43 | 42 | 43 | 36 | 32 |
| 21-30 | 28 | 24 | 21 | 36 | 28 |
| 30+ | 12 | 14 | 17 | 15 | 29 |
| Dont know | 5 | 4 | 1 | 1 | 3 |
| None/Less than 1 hour |
4 | 7 | 4 | 5 | 2 |
| Refused | - | - | - | 1 | - |
| Base | 110 | 110 | 130 | 130 | 110 |
| 3b | |||||
|---|---|---|---|---|---|
| Hours during holidays | 1 - most deprived | 2 | 3 | 4 | 5 - least deprived |
| 1-10 | 5 | 14 | 8 | 7 | 9 |
| 11-20 | 16 | 15 | 18 | 20 | 14 |
| 21-30 | 14 | 12 | 12 | 26 | 22 |
| 30+ | 6 | 14 | 14 | 10 | 24 |
| Dont know | 10 | 5 | 2 | 4 | 5 |
| None/Less than 1 hour |
49 | 40 | 45 | 33 | 26 |
| Refused | - | - | - | 1 | - |
| Base | 110 | 110 | 130 | 130 | 110 |
Main Reasons for Using Childcare by Scottish Index of Multiple Deprivation (SIMD) quintiles
The most common reason for use of childcare across Scotland was so that parents/carers can work (66 per cent, Table 4). The proportion of households reporting this as a reason for use of childcare increased as area deprivation decreased from 56 per cent of households in the areas of highest deprivation to 76 per cent in areas of least deprivation. Other common reasons for using childcare were for the child's social development (including mixing with other children) which was reported by 28 per cent of respondents, to help prepare their child for school (27 per cent) and for their child's learning and language development (24 per cent).
| Reason | 1 - most deprived | 2 | 3 | 4 | 5 - least deprived | All |
|---|---|---|---|---|---|---|
| So that I (or my partner) can work | 56 | 57 | 73 | 71 | 76 | 66 |
| So that I (or my partner) can look for work | 2 | 4 | 4 | 7 | 2 | 4 |
| So that I (or my partner) can study or improve work-related skills | 9 | 3 | 3 | 3 | 5 | 5 |
| So that I (or my partner) can look after the home (for example cooking, DIY, cleaning, etc.) | 7 | 2 | 1 | 3 | 2 | 3 |
| So that I (or my partner) can look after other children | 1 | 2 | 0 | - | 1 | 1 |
| So that I (or my partner) can look after another relative or friend | 1 | - | - | - | - | 0 |
| So that I (or my partner) can socialise, exercise, spend time on hobbies, etc. | 2 | 3 | 4 | 4 | 1 | 2 |
| To give my (or my partner) some time to rest/destress/relax | 4 | 4 | 5 | 2 | 5 | 4 |
| Because my child likes spending time there | 10 | 6 | 9 | 9 | 6 | 8 |
| For my child's social development (including mixing with other children) | 26 | 25 | 27 | 29 | 32 | 28 |
| For my child's learning and language development | 34 | 18 | 19 | 23 | 24 | 24 |
| To improve my child's behaviour | 6 | 4 | 2 | 3 | 4 | 4 |
| To help prepare my child for school | 24 | 34 | 22 | 25 | 31 | 27 |
| To give my child the opportunity to use different toys, books and outdoor equipment | 3 | 6 | 3 | - | 2 | 3 |
| To give my child the opportunity to try new activities and experiences | 17 | 11 | 15 | 13 | 11 | 13 |
| Other | 2 | 3 | - | - | - | 1 |
| Base | 110 | 110 | 130 | 130 | 110 | 590 |
Columns may not add to 100 per cent as multiple responses were allowed.
Contact
Email: children.statistics@gov.scot