Scottish Household Survey 2019: twenty years of Scotland's people - summary report
This publication synthesises 20 years of change (1999-2019) in Scottish society as measured by Scottish Household Survey data.
Economic Activities Are Consistent
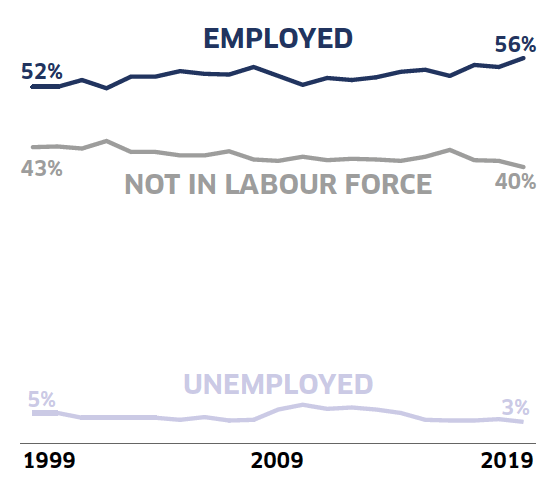
The economic status of adults in Scotland has remained relatively stable over the last 20 years.
The proportion of adults in paid employment increased from 52% in 1999 to 56% in 2019, including those in full and part-time employment and self-employed adults.
The proportion of adults that were not in the labour force decreased in this period, from 43% to 40%.
Additionally, the proportion of adults who were unemployed and looking for work decreased from 5% to 3%.
The proportion of adults caring for their home and family decreased from 8% of adults in 1999 to 4% in 2019 This represents the whole population and does not indicate unemployment rate.
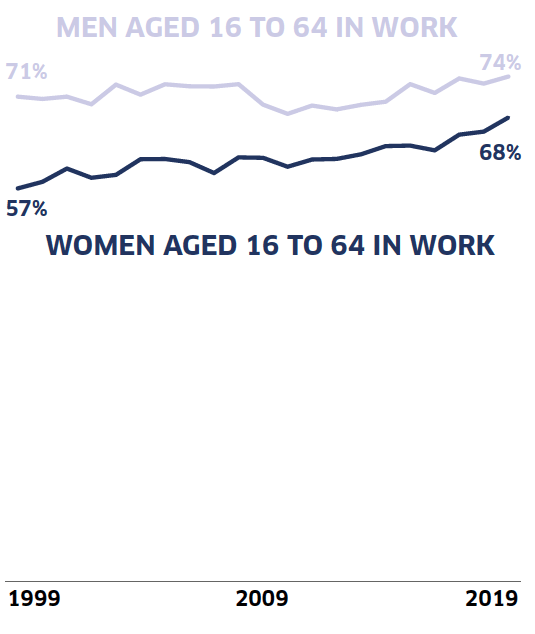
More Women are in Paid Work
The proportion of both men and women aged 16 to 64 who were in paid work had increased between 1999 and 2019.
Over the last 20 years there are declining trends in men reporting to be employed full-time, unemployed and permanently sick or disabled. Increasing trends over the 20 years are evident in men reporting to be employed part-time and permanently retired.
For the economic activity of women, there was an increase in the proportions of those in self-employment and working full-time, and a decrease in women looking after the family or home.
The proportion of women aged 16 to 64 with children in the household working full-time increased from 22% in 1999 and 30% in 2019
More Young Adults are in Higher Education
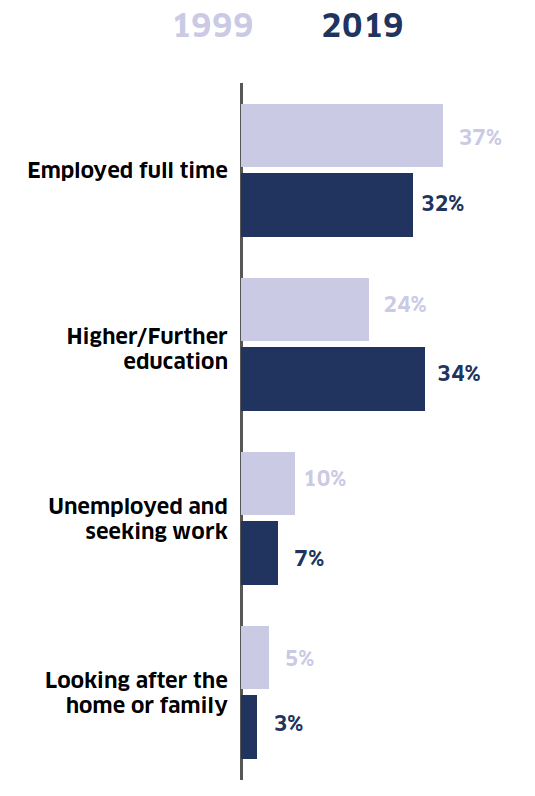
The past 20 years saw an increase in the proportion of young adults, aged 16 to 24, in higher or further education. This increased from 24% of young adults in 1999 to 34% in 2019.
In 1999, 37% of young adults were employed full-time. In 2019 this decreased to 32%. The proportion of young adults that were unemployed and seeking work remained stable, from 10% in 1999 to 7% in 2019.
The number of young adults that looked after the home or family also remained stable, from 5% of all young adults in 1999 to 3% in 2019.
The proportion of adults aged 60 or over reporting to be permanently retired from work decreased from 80% in 1999 to 77% in 2019
More Single Parents are in Paid Employment in 2019
The proportion of single parents at home looking after the home or the family has decreased from 42% of all single parents in 1999 to 20% in 2019.
At the same time, the proportion of single parents that were employed full-time increased from 15% in 1999 to 25% in 2019. The proportion who were employed part-time increased from 20% in 1999 to 28% in 2019.
In 2019, 8% of single parent households reported to be self-employed, increasing from 2% in 1999.
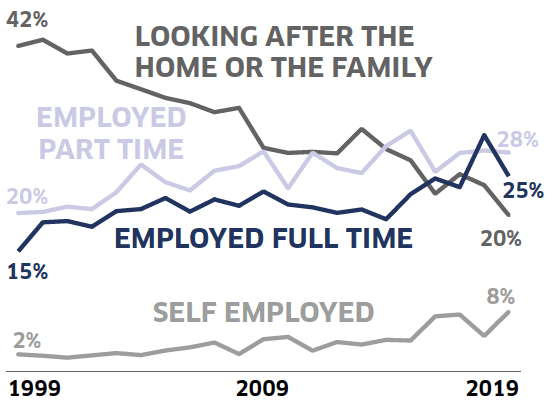
The proportion of single parents in paid employment increased from 38% in 1999 to 61% in 2019
Contact
Email: shs@gov.scot