The Scottish Health Survey 2021 - volume 2: technical report
This publication pesents information on the methodology and fieldwork from the Scottish Health Survey 2021.
Chapter 2: Methods And Definitions
2.1 General Survey Definitions
age standardisation
Age standardisation has been used in some analysis in order to enable groups to be compared after adjusting for the effects of any differences in their age distributions.
When different sub-groups are compared in respect of a variable on which age has an important influence, any differences in age distributions between these sub-groups are likely to affect the observed differences in the proportions of interest.
Age standardisation was carried out, using the direct standardisation method. The standard population to which the age distribution of sub-groups was adjusted was the mid-2020 population estimates for Scotland. All age standardisation has been undertaken separately within each sex.
The age-standardised proportion p' was calculated as follows, where pi is the age specific proportion in age group i and Ni is the standard population size in age group i:
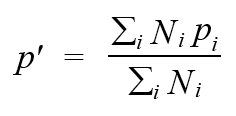
Therefore p' can be viewed as a weighted mean of pi using the weights Ni. Age standardisation was carried out using the age groups: 16-24, 25-34, 35-44, 45-54, 55-64, 65-74 and 75 and over. The variance of the standardised proportion can be estimated by:

Household
A household was defined as one person or a group of people who have the accommodation as their only or main residence and who either share at least one meal a day or share the living accommodation.
Household reference person (HRP)
The HRP is defined as the householder (a person in whose name the property is owned or rented) with the highest income. If there is more than one householder and they have equal income, then the household reference person is the oldest.
Mean
All means in this report are Arithmetic means (the sum of the values for cases divided by the number of cases).
Median
The value of a distribution which divides it into two equal parts such that half the cases have values below the median and half the cases have values above the median.
NHS Health Board
The National Health Service (NHS) in Scotland is divided up into 14 geographically based local NHS Boards and a number of National Special Health Boards. Health Boards in this report refers to the 14 local NHS Boards.
Percentile
The value of a distribution which partitions the cases into groups of a specified size. For example, the 20th percentile is the value of the distribution where 20 percent of the cases have values below the 20th percentile and 80 percent have values above it. The 50th percentile is the median.
P Value
A p value is the probability of the observed result occurring due to chance alone. A p value of less than 5% is conventionally taken to indicate a statistically significant result (p<0.05). It should be noted that the p value is dependent on the sample size, so that with large samples differences or associations which are very small may still be statistically significant. Results should therefore be assessed on the magnitude of the differences or associations as well as on the p value itself. The p values given in this report take into account the clustered sampling design of the survey.
Quintile
Quintiles are percentiles which divide a distribution into fifths, i.e., the 20th, 40th, 60th and 80th percentiles.
Scottish Index Of Multiple Deprivation (SIMD)
The SIMD is the Scottish Government’s official measure of area based multiple deprivation. It is based on 37 indicators across 7 individual domains of current income, employment, housing, health, education, skills and training and geographic access to services and telecommunications. SIMD is calculated at data zone level, enabling small pockets of deprivation to be identified. The data zones are ranked from most deprived (1) to least deprived (6505) on the overall SIMD index. The result is a comprehensive picture of relative area deprivation across Scotland.
This report uses the SIMD 2020 for the 2019 and 2021 data (see Scottish Index of Multiple Deprivation 2020).
Significance Testing
Where differences in relation to a particular outcome between two subgroups, such as men and women, are highlighted in the main report, the differences can be considered statistically significant, unless otherwise stated.
Statistical significance is calculated using logistic regression to provide a p-value based on a two-tailed significance test. One-tailed tests are used when the difference can only be in one direction. Two-tailed tests should always be used when the difference can theoretically be in either direction. For example, even though previous research has shown a higher prevalence of hazardous levels of alcohol consumption among men than among women, and we may expect this to be true in the most recent survey, a two-tailed test is used to confirm the difference.
Standard Deviation
The standard deviation is a measure of the extent to which the values within a set of data are dispersed from, or close to, the mean value. In a normally distributed set of data 68% of the cases will lie within one standard deviation of the mean, 95% within two standard deviations and 99% will be within 3 standard deviations. For example, for a mean value of 50 with a standard deviation of 5, 95% of values will lie within the range 40-60.
Standard Error (of The Mean)
The standard error is a variance estimate that measures the amount of uncertainty (as a result of sampling error) associated with a survey statistic. All data presented in this report in the form of means are presented with their associated standard errors (with the exception of the WEMWBS scores which are also presented with their standard deviations). Confidence intervals are calculated from the standard error; therefore, the larger the standard error, the wider the confidence interval will be.
UNWEIGHTED BASES
The unweighted bases presented in the report tables provide the number of individuals upon which the data in the table is based. This is the number of people that were interviewed as part of SHeS and provided a valid answer to the particular question or set of questions. The unweighted bases show the number of people interviewed in various subgroups including sex, age and Scottish Index of Multiple Deprivation.
Weighted Bases
The weighted bases are adjusted versions of the unweighted bases which involves calculating a weight for each individual so that their representation in the sample reflects their representation in the general population of Scotland living in private households. Categories within the table can be combined by using the weighted bases to calculate weighted averages of the relevant categories.
2.2 Chapter Definitions
2.2.1 Chapter 1 – General Health, Cardiovascular Conditions, And CPR Training
General Health
Long-term conditions & limiting long-term conditions
Long-term conditions were defined as a physical or mental health condition or illness lasting or expected to last 12 months or more. The wording of this question changed in 2012 and is now aligned with the harmonised questions for all large Scottish Government surveys. Long-term conditions were coded into categories defined in the International Classification of Diseases (ICD), but it should be noted that the ICD is used mostly to classify conditions according to the cause, whereas SHeS classifies according to the reported symptoms. A long-term condition was defined as limiting if the respondent reported that it limited their activities in any way.
Self-assessed general health
Each year, participants who are aged 13 and over are asked to rate their health in general with answer options ranging from ‘very good’ to ‘very bad’. For children under the age of 13 the question is answered by the parent or guardian completing the interview on their behalf.
Cardiovascular Conditions
Blood pressure/hypertension
Participants were defined as having self-reported doctor-diagnosed hypertension if they stated during the interview that they had been told by a doctor or nurse that they had high blood pressure.
Cardiovascular disease (CVD)
Participants were asked whether they had ever suffered from any of the following conditions: diabetes, angina, heart attack, stroke, heart murmur, irregular heart rhythm, or ‘other heart trouble’. If they responded affirmatively to any of these conditions, participants were asked whether they had ever been told they had the condition by a doctor and whether they had experienced the conditions in the previous 12 months. For the purpose of this report, participants were classified as having a particular condition only if they reported that the diagnosis was confirmed by a doctor.
It is important to note that no attempt was made to verify these self-reported diagnoses objectively. It is, therefore, possible that some misclassification may have occurred because some participants may not have remembered (or not remembered correctly, or not known about) diagnoses made by their doctor.
Any CVD condition
Participants were classified as having ‘any CVD’ if they reported ever having any of the following conditions confirmed by a doctor: angina, heart attack, stroke, heart murmur, abnormal heart rhythm, or ‘other heart trouble’[1].
Diabetes
Participants were classified as having diabetes if they reported a confirmed doctor diagnosis. Women whose diabetes occurred only during pregnancy were excluded from the classification. In 2018, a new question was introduced asking participants to report if they had been told they had Type 1 or Type 2 diabetes. Prior to 2018 no distinction was made between Type 1 and Type 2 diabetes in the interview.
Any CVD condition or diabetes
A summary measure of the above conditions is presented in the tables as ‘any CVD condition or diabetes’.
Ischaemic heart disease (IHD)
IHD is also known as coronary heart disease. Participants were classified as having IHD if they reported ever having angina, a heart attack or heart failure diagnosed by a doctor.
Stroke
Participants were classified as having a stroke if they reported ever having had a stroke confirmed by a doctor.
IHD or Stroke
A summary measure of the above conditions is presented in the tables as ‘IHD or stroke’.
Cardiopulmonary Resuscitation (CPR) Training
CPR is an emergency procedure that combines chest compressions with artificial ventilation in an effort to manually preserve brain function in a person who is in cardiac arrest.
Participants were asked whether they had ever had any type of training in CPR or learned CPR either through instructor led sessions or self-instruction using DVD/online instruction. Those who reported they had CPR training were asked to provide details of the time interval since the first training, whether they had attended refresher training and the type of CPR training.
2.2.2 Chapter 2 – Mental Wellbeing
Warwick-edinburgh Mental Wellbeing Scale (WEMWBS)
The WEMWBS was developed by researchers at the Universities of Warwick and Edinburgh, with funding provided by NHS Health Scotland, to enable the measurement of mental wellbeing of adults in the UK. It was adapted from a 40 item scale originally developed in New Zealand, the Affectometer 2. The WEMWBS scale comprises 14 positively worded statements with a five item scale ranging from ‘1 - None of the time’ to ‘5 - All of the time’. The lowest score possible is therefore 14 and the highest is 70; the tables present mean scores. The 14 items are designed to assess positive affect (optimism, cheerfulness, relaxation); and satisfying interpersonal relationships and positive functioning (energy, clear thinking, self-acceptance, personal development, mastery and autonomy)[2].
The scale was not designed to identify individuals with exceptionally high or low levels of positive mental health, so cut-off points have not been developed [3].
WEMWBS is used to monitor the National Indicator 'mental wellbeing’[4] for adults and the mean WEMWBS score of children aged 13-15 years is included in the mental health indicator set for children[5].
General Health Questionnaire-12 (GHQ-12)
GHQ-12[6] is a scale designed to detect possible psychiatric morbidity in the general population. GHQ-12 is a widely used standard measure of mental distress and mental ill-health consisting of 12 questions on concentration abilities, sleeping patterns, self-esteem, stress, despair, depression, and confidence in the previous few weeks. Responses to each of the GHQ-12 items are scored, with one point allocated each time a particular feeling or type of behaviour is reported to have been experienced 'more than usual' or 'much more than usual' over the previous few weeks.
These scores are combined to create an overall score of between zero and twelve. A score of four or more (referred to as a high GHQ-12 score) has been used here to indicate the presence of a possible psychiatric disorder. A score of zero on the GHQ-12 questionnaire can, in contrast, be considered to be an indicator of psychological wellbeing. GHQ-12 measures deviations from people's usual functioning in the previous few weeks and therefore cannot be used to detect chronic conditions.
Revised Clinical Interview Schedule (CIS-R)
Depression and anxiety
Details on symptoms of depression and anxiety are collected via a standardised instrument, the CIS-R[7]. The CIS-R is a well-established tool for measuring the prevalence of mental disorders. The complete CIS-R comprises 14 sections, each covering a type of mental health symptom and asks about presence of symptoms in the week preceding the interview. Prevalence of two of these mental illnesses - depression and anxiety - were introduced to the Scottish Health Survey in 2008. Given the potentially sensitive nature of these topics, they were included in the nurse interview part of the survey prior to 2012 [8]. Since 2012 the questions have been included in the biological module, with participants completing the questions themselves on the interviewer laptop (CASI). The change in mode of data collection may have impacted response, and comparisons of 2016/2017 figures and onwards with pre-2012 figures should be interpreted with caution. There is a possibility that any observed changes in prevalence across this period may simply reflect the change in mode rather than any real change in the population.
Questions on depression cover a range of symptoms, including feelings of being sad, miserable, or depressed, and taking less of an interest and getting less enjoyment out of things than usual. Questions on anxiety cover feelings of anxiety, nervousness, and tension, as well as phobias, and the symptoms associated with these.
Suicide attempts and self-harm
In addition to being asked about symptoms of depression and anxiety, participants were also asked whether they had ever attempted to take their own life. The question was worded as follows:
Have you ever made an attempt to take your own life, by taking an overdose of tablets or in some other way?
Those who said yes were asked if this was in ‘the last week, in the last year or at some other time?’ Note that this question is likely to underestimate the prevalence of very recent attempts, as people might be less likely to agree to take part in a survey immediately after a traumatic life event such as this. Furthermore, suicide attempts will only be captured in a survey among people who do not succeed at their attempt.
Since 2008, participants have also been asked whether they have ever self-harmed in any way but not with the intention of killing themselves. Those who said that they had self-harmed were also asked if this was ‘in the last week, last year or at some other time’. The percentage of adults who have self-harmed in the last year is one of the national mental health indicators for adults[9].
Since 2012 these questions have been included in the biological module, with participants completing the questions themselves on the interviewer laptop (CASI). Prior to 2012 they were administered in the nurse interview, and any changes over time need to be interpreted with caution due to the change in mode.
Loneliness
A question was included in the adult and young adult self-completion questionnaires to measure levels of loneliness experienced in the week prior to being interviewed, with five answer options ranging from ‘none or almost none of the time’ to ‘all or almost all of the time’. This differs from the question used in previous surveys where the period asked about was two weeks.
Social Capital
Social capital encompasses aspects of social connectedness via friend and kinship networks, trust in others, the ability to draw on support from others, as well as a sense of connectedness to places through involvement in the local community and the ability to influence local decisions. In 2021, these social capital indicators are reported in the supplementary tables only.
2.2.3 Chapter 3 – Respiratory Conditions Including COVID-19
Asthma And Respiratory Symptoms
Participants (including parents of children aged 0-12, and children themselves aged 13-15) were asked if a doctor had ever told them they had asthma. This question was asked in the 1998, 2003, 2008 and 2010 surveys, and has been included every year since 2012. No objective measures were used to confirm these reported diagnoses.
Questions on respiratory symptoms were included in the 1995-2003 surveys, and in all even years since 2008. The symptoms covered were: phlegm production, breathlessness and wheezing or whistling in the chest. Breathlessness was classified as grade 2 if it occurred when hurrying on level ground or walking up a slight hill, or grade 3 (the more severe form) if it occurred when walking with other people of the same age on level ground. The impact of wheezing and whistling symptoms on sleep and people’s daily activities was also measured. The Medical Research Council Respiratory Symptom Questionnaire was used to collect some of this information[10].
Chronic Obstructive Pulmonary Disease (COPD)
COPD is defined by the World Health Organisation as ‘a pulmonary disease characterised by chronic obstruction lung airflow that interferes with normal breathing and is not fully reversible’. It is associated with symptoms and clinical signs that in the past have been called ‘chronic bronchitis’ and ‘emphysema,’ including regular cough (at least three consecutive months of the year) and production of phlegm.
Each year since 2008, adult participants have been asked if they had ever had COPD, chronic bronchitis or emphysema and, if so, whether a doctor had told them they had one of these conditions. Those who reported doctor-diagnosed COPD were also asked what treatment or advice they had received. No objective measures were used to confirm these reported diagnoses.
Long COVID
Questions on whether participants had or thought they had COVID-19 and whether they described themselves as having long COVID. Long COVID was defined by experiencing symptoms more than 4 weeks after they first had COVID-19 that were not explained by something else.
2.2.4 Chapter 4 – Diet And Food Insecurity
Scottish Dietary Goals
The Scottish Dietary Goals (SDG) provide the basis for the diet that will improve and support the health of the Scottish population.[11]
Calories
Reduction in calorie intake by 120 kcal per person per day, and average energy density of the diet to be lowered to 125kcal/100g by reducing intake of high fat and/or sugary products and by replacing with starchy carbohydrates (e.g. bread, pasta, rice and potatoes), fruits and vegetables.
Fruit and vegetables
Average intake of a variety of fruit and vegetables to reach at least five portions per person per day (>400g per day).
Oily fish
Oil rich fish consumption to increase to one portion (140g) per person per week.
Red meat
Average intake of red and red processed meat to be limited to around 70g per person per day. Average intake of the highest consumers of red and red processed meat (90g per person per day) not to increase.
Fats
Average intake of total fat to reduce to no more than 35% of food energy, average intake of saturated fat to reduce to no more than 11% food energy and average intake of trans fatty acids to remain below 1% food energy.
Free sugars
Average intake of free sugars not to exceed 5% of total dietary energy.
Salt
Average intake of salt to reduce to 6g per day for adults.
Fibre
An increase in average intake of dietary fibre to 30g per person per day for adults.
Total carbohydrate
Total carbohydrate to be maintained at an average population intake of approximately 50% of total dietary energy with no more than 5% from free sugars.
INTAKE 24
INTAKE24 is an online 24-hour dietary recall tool. It was originally developed by Newcastle University and Food Standards Scotland. It was updated and further developed prior to introduction into the National Diet and Nutrition Survey Rolling Programme (NDNS RP) in October 2019 and is currently maintained by Cambridge University in collaboration with Newcastle University (Open Lab). Information about the development of the tool, reports and publications and a demo of the tool can be found on the website (https://intake24.org/).
Participants aged 16 and over on SHeS were introduced to INTAKE24 by their interviewer. Following their interview participants logged in online on their computer, laptop, tablet, or smart phone via a secure instant URL. Participants who did not have internet access or who did not feel confident completing the dietary recalls independently could request assistance. This was provided by the Cambridge University team who carried out assisted dietary recalls over the telephone.
Participants were asked to record in INTAKE24 everything they ate and drank the previous day. INTAKE24 includes an embedded database of foods with linked portion sizes and corresponding nutrient composition data taken from the National Diet and Nutrition Survey[12] (NDNS) Nutrient Databank from which dietary intakes are automatically calculated.
INTAKE24 uses a range of different methods to estimate the portion size of foods and drinks including food photographs and household measures such as individual items, different spoon sizes, or small, medium or large servings. Drinks can also be reported by a range of glass, cup and bottle sizes, often including a slider to indicate how much was consumed. There are prompts to remind respondents about common foods and drinks that might have been forgotten (for example, milk and sugar in tea, or sauce on chips), built in checks to detect low reported energy intakes and low intake of drinks and checks for large time gaps between eating occasions. Intake24 includes a custom spell checker which works to correct both phonetic misspellings and typing errors in the free text to enable comprehensive search functionality.
Other features of the system include; a missing foods function to ensure foods that are not in the INTAKE24 database are not missed from the recall, a video tutorial on how to complete a recall, contextual help buttons and a telephone help request function enabling the research team to contact respondents to talk them through issues they may be experiencing.
For all participants who completed two recalls, their average daily intake was calculated to enable comparisons with the SDG and the proportions meeting each SDG were also calculated.
Energy density (kcal/100g/day)
Energy density is based on the energy from foods and milk only (not the energy from other drinks).
Fruit and vegetable consumption (adults)
SHeS has gathered data on fruit and vegetable consumption in adults since 2003 as part of the main interview. However, estimations of portions of fruit and vegetable did not include the contribution from composite dishes, both homemade dishes and manufactured products. In 2021, dietary recall data, adult fruit and vegetables portions were calculated after disaggregation, that is they include these foods eaten as part of composite dishes, as well as their discrete portions, to provide more accurate estimates of total amounts consumed at an individual food level. For example, carrots may be eaten as an accompaniment to a main meal, but they may also be consumed as an ingredient within a stew, together with additional vegetables such as onions and celery.
In previous years, the ‘none’ category was used to include just zero portions whereas in 2021, the ‘none/less than ½ portion’ category includes less than half a portion.
Fruit and vegetable consumption (children)
Data on fruit and vegetable consumption among children was measured using survey questions, as in previous years. It is recommended that children eat at least five portions of fruit and vegetables per day[13].
Free sugars intake
The definition of free sugars includes: all added sugars in any form; all sugars naturally present in fruit and vegetable juices, purées and pastes and similar products in which the structure has been broken down; all sugars in drinks (except for dairy-based drinks); and lactose and galactose added as ingredients. The sugars naturally present in milk and dairy products, fresh and most types of processed fruit and vegetables and in cereal grains, nuts and seeds are excluded from the definition[14].
Red and red processed meat intake
Red and red processed meat after disaggregation i.e. including the contribution from composite dishes, both homemade dishes and manufactured products. For the purpose of the analysis, red meat consumers are defined as those who consumed an average of more than 1g of red and red processed meat per day.
Fibre intake
Fibre is measured by the American Association of Analytical Chemists (AOAC) methods. AOAC fibre includes resistant starch and lignin in the estimation of total fibre in addition to non-starch polysaccharides.
Food Insecurity
Food insecurity is ‘the inability to acquire or consume an adequate quality or sufficient quantity of food in socially acceptable ways, or the uncertainty that one will be able to do so’. In their self-completion questionnaire, participants answered three routed questions on food insecurity asking whether they had worried about running out of food, had eaten less than they should have or had actually run out of food in the last 12 months.
2.2.5 Chapter 5 - Obesity
Body Mass Index (BMI)
BMI is a widely accepted measure that allows for differences in weight due to height. It is defined as weight (kg)/square of height (m2). This has been used as a measure of obesity in SHeS since its inception in 1995. BMI has some limitations and does not, for example, distinguish between mass due to body fat and mass due to muscular physique[15].
In 2021, it was not possible to obtain the standardised height and weight measurements using a telephone approach. Therefore, where they were happy to do so, participants were asked to estimate their height and weight, with these self-reported measures used to calculate estimated BMI. So, while these estimates have been calculated, this data should be used with caution given the self-reported nature of these measures.
Work undertaken to analyse data from the Health Survey for England (HSE) and Active Lives Surveys found that, on average, participants overestimated their height and underestimated their weight[16]. Adjustments for adults have been made to account for this and while these corrections appear to remove some bias from the estimates, caution is advised in interpreting this data.
Based on their BMI (calculated from self-reported height and weight), adult participants were classified into the following groups based on the World Health Organisation (WHO) classification[17]:
| BMI (kg/m2) | Description |
|---|---|
| Less than 18.5 | Underweight |
| 18.5 to less than 25 | Normal |
| 25 to less than 30 | Overweight, excluding obesity |
| 30 to less than 40 | Obesity, excluding morbid obesity |
| 40+ | Morbid obesity |
The BMI data presented in the report and the data tables is based on data that has been adjusted according to the formula from this HSE and Active Lives work referenced previously. A comparison of the unadjusted and adjusted weighted data for all adults interviewed as part of the survey is presented in the table below.
| BMI (kg/m2) | Unadjusted | Adjusted |
|---|---|---|
| Less than 18.5 | 3% | 1% |
| 18.5 to less than 25 | 44% | 37% |
| 25 to less than 30 | 32% | 35% |
| 30 to less than 40 | 18% | 23% |
| 40+ | 3% | 4% |
| Mean | 26.6 | 27.7 |
Based on their BMI (calculated from self-reported height and weight), child participants were classified into the following groups based on the World Health Organisation (WHO) classification[18].
Although the BMI calculation method is the same, there are no fixed BMI cut-off points defining overweight and obesity in children. Instead, overweight and obesity are defined using several other methods including age and sex specific BMI cut-off points or BMI percentile cut-offs based on reference populations. While the data for adults has been adjusted based on previous comparator analysis, no equivalent analysis was available for children, therefore, these self-report figures have not been adjusted.
Children can be classified into the following groups:
| BMI (percentile) | Description |
|---|---|
| Above 2nd and below 85th | Within healthy range |
| At or above 2nd, at or above 85th | Outwith healthy range |
| At or above 85th, below 95th | At risk of overweight |
| At or above 95th | At risk of obesity |
Waist Circumference
Waist circumference is a measure of deposition of abdominal fat. It is measured during the biological module. A raised waist circumference has been defined as more than 102cm in men and more than 88cm in women. In 2021, it was not possible to collect accurate information for waist circumference (WC); therefore, this was not included in the survey.
2.2.6 Chapter 6 – Physical Activity
UK Chief Medical Officers’ (CMO) Physical Activity Guidelines (2019)
Early years – children under 5 years
Infants (less than 1 year):
Physical activity is recommended several times a day (the more activity the better) in a variety of ways including interactive floor-based activity, e.g. crawling.
Where infants are not yet mobile, at least 30 minutes of tummy time spread across the day and while awake is recommended along with movements such as reaching and grasping, pushing and pulling themselves over independently, or rolling over; more is better.
Toddlers (1-2 years):
At least 180 minutes (3 hours) of physical activity of any intensity is recommended for toddlers, including active and outdoor play.
Pre-schoolers (3-4 years):
At least 180 minutes (3 hours) of activity is also recommended for pre-school aged children, including a variety of active and outdoor play physical activities spread throughout the day. For this age group, this should include at least 60 minutes of moderate-to-vigorous intensity physical activity.
Children and young people aged 5 to 18
It is recommended that children and young people in this age group engage in moderate-to-vigorous intensity physical activity for an average of at least 60 minutes per day. The activities undertaken include those undertaken in a variety of settings such as school-based physical education, active travel, after school activities, play and sporting activities.
Engagement in a range of activities and intensities over the course of a week is recommended in order to develop movement skills, muscular fitness and bone strength.
This activity should be accompanied by as minimal an amount of sedentary time as possible, with any long periods of inactivity broken up with some physical activity, even if this is light in nature.
Adults aged 19-64
Daily physical activity is recommended for both physical and mental health benefits - the more the better but any activity is encouraged.
This includes activities to develop and strengthen the major muscle groups, which can be achieved through activities such as heavy gardening, carrying heavy shopping, or resistance exercise. It is recommended that muscle strengthening activities are done on at least two days a week, but any strengthening activity is better than none.
On a weekly basis, adults should undertake:
- at least 150 minutes (2 1/2 hours) of moderate intensity activity (such as brisk walking or cycling)
- or 75 minutes of vigorous intensity activity (such as running)
- or even shorter durations of very vigorous intensity activity (such as sprinting or stair climbing);
- or a combination of moderate, vigorous and very vigorous intensity activity.
Sedentary time should be minimized as far as possible, breaking this up with at least light physical activity.
Adults aged 65 and over
Daily physical activity is also recommended for older adults for the maintenance of good physical and mental health, wellbeing, and social functioning. Even light activity offers greater health benefits than being sedentary, although the more daily physical activity that is undertaken, the better.
Older adults should also undertake activities aimed at improving or maintaining muscle strength, balance and flexibility on at least two days a week, either on their own or combined with moderate aerobic activity. This should be accompanied by 150 minutes (two and a half hours) of moderate intensity aerobic activity, building gradually up to this where activity levels are currently lower.
Those who are already regularly active can achieve these benefits through:
- 75 minutes of vigorous intensity activity
- or a combination of moderate and vigorous activity
Weight-bearing activities offer additional benefit in helping to maintain bone health.
Where physically able, long periods of being sedentary should be broken up with light activity, or at least with standing.
Adult Physical Activity Questionnaire
The SHeS questionnaire[19] asks about four main types of physical activity:
- home-based activities (housework, gardening, building work and DIY)
- walking
- sports and exercise
- activity at work
Information is collected on the:
- time spent being active
- intensity of the activities undertaken
- frequency with which activities are performed.
Adherence To Adult Physical Activity Guidelines
The activity guidelines advised adults to accumulate 150 minutes of moderate activity or 75 minutes of vigorous activity per week or an equivalent combination of both, in bouts of 10 minutes or more. These guidelines are referred to as the Moderate or Vigorous Physical Activity guidelines (MVPA). To help assess adherence to this guideline, the intensity level of activities mentioned by participants was estimated.
Activities of low intensity, and activities of less than 10 minutes duration, were not included in the assessment. This allowed the calculation of a measure of whether each SHeS participant adhered to the guideline, referred to in the text and tables as “adult summary activity levels”, see the table overleaf. A more detailed discussion of this calculation is provided in the 2012 report[20].
Adult summary activity levelsa
Meets MVPA guidelines: Reported 150 mins/week of moderate physical activity or 75 mins vigorous physical activity, or an equivalent combination of these.
Some activity: Reported 60-149 mins/week of moderate physical activity, or 30-74 mins/week vigorous physical activity, or an equivalent combination of these.
Low activity: Reported 30-59 mins/week of moderate physical activity, or 15-29 mins/week vigorous physical activity or an equivalent combination of these.
Very low activity: Reported less than 30 mins/week of moderate physical activity, or less than 15 mins/week vigorous physical activity, or an equivalent combination of these.
a Only bouts of 10 minutes or more were included towards the 150 minutes per week guideline.
To avoid overcomplicating the text, where descriptions are provided of the summary activity levels, they tend to refer only to moderate physical activity, although the calculations were based on moderate or vigorous activity as described above.
Muscle strengthening
A second summary measure was calculated for adults, in respect of meeting the guidelines to carry out activities that strengthen muscles on at least 2 days a week to increase bone strength and muscular fitness.
Nine different sports were classed as always muscle strengthening, and other sports or exercises were classed as muscle strengthening if the participant reported that the effort was enough to make the muscles feel some tension, shake or feel warm. If the participant carried out such activities for at least 10 minutes on 2 or more days a week, on average, they were deemed to meet the muscle strengthening guideline. As this only includes muscle strengthening through sporting activity, reported levels may be an underestimate.
Child Physical Activity Questionnaire
The questions on child physical activity are slightly less detailed than those for adults[21]. No information on intensity is collected (with the exception of asking those aged 13-15 about their walking pace). The questions cover:
- sports and exercise
- active play including housework and gardening
- walking
2.2.7 Chapter 7 - Smoking
Questions On Smoking Behaviour
Questions on smoking have been included in SHeS since 1995. Some small changes were made to the questions in 2008 and 2012. These are outlined in the relevant annual reports[22],[23].
The current questions in the survey focus on:
- current smoking status
- frequency and pattern of current smoking
- the number of cigarettes smoked by current smokers
- exposure to second-hand smoke
- past smoking behaviour, current and ex-smokers
- quit attempts and desire to give up smoking
- medical advice on giving up smoking
- nicotine replacement therapy (NRT) use (including questions on NRT that led to successful cessation)
- e-cigarette use (including as part of a quit attempt)
Adults aged 20 and over were asked about their smoking behaviour during the telephone interview. For those aged 16 and 17, information was collected in a self-completion questionnaire offering more privacy and reducing the likelihood of concealing behaviour in front of other household members. Those aged 18 and 19 could answer the questions either during the telephone interview or via the self-completion booklet, at the interviewer’s discretion.
The self-completion questions were largely similar to those asked in the telephone interview. However, given the age of the participants completing the self-completion questionnaire, questions on past smoking behaviour, desire to give up smoking and medical advice to stop smoking were excluded.
Smoking Status
Smoking status categories reported here are:
- current cigarette smoker
- ex-regular cigarette smoker
- never regular cigarette smoker
- never smoked cigarettes at all
Information on cigar and pipe use is collected in the survey but as prevalence is low these are not considered in the definition of current smoking.
Electronic Cigarettes (e-cigarettes)
Electronic cigarettes or e-cigarettes are battery-powered handheld devices which heat a liquid that delivers a vapour. The vapour is then inhaled by the user, which is known as ‘vaping’. E-cigarettes typically consist of a battery, an atomiser and a cartridge containing the liquid. Earlier models, often referred to as ‘cigalikes’, were designed to closely resemble cigarettes but there is now a wide variety of product types on the market. The liquid is usually flavoured and may not contain nicotine, although in most cases e-cigarettes are used with nicotine. Unlike conventional or traditional cigarettes, they do not contain tobacco and do not involve combustion (i.e. they are not lit).
SHeS has gathered information on the use of e-cigarettes among the Scottish adult population since 2014, in response to their increased availability and high profile. The questions ask whether participants have ever used an e-cigarette as well as whether they currently use an e-cigarette. The questions about e-cigarettes were amended in 2016 to include the term ‘vaping devices’.
Exposure To Second-hand Smoke
In 2021, exposure to second-hand smoke in adults was measured by asking respondents to self-report where they have been exposed to second-hand smoke. In previous years, cotinine levels from saliva samples were used, but this was not possible for the 2021 survey due to COVID-19 restrictions.
Exposure to second-hand smoke for children is measured in two ways in the survey:
- whether there is someone who regularly smokes inside the accommodation where the child lives, and
- parents’ and older children’s (aged 13-15) reports of whether children are exposed to smoke at home.
Nicotine Replacement Therapy (NRT)
The remedial administration of nicotine to the body by means other than tobacco, usually as part of smoking cessation. Common forms of nicotine replacement therapy are nicotine patches and nicotine gum. In 2021, NRT use is reported in the supplementary tables only.
2.2.8 Chapter 8 – Alcohol And Drugs
UK Chief Medical Officers’ (CMO) Alcohol Guidelines
The UK CMO alcohol guidelines consist of three recommendations:
- a weekly guideline on regular drinking;
- advice on single episodes of drinking; and
- a guideline on pregnancy and drinking
According to the weekly guideline, adults are safest not to regularly drink more than 14 units per week, to keep health risks from drinking alcohol to a low level. If you do drink as much as 14 units a week, it is best to spread this evenly over three days or more. On a single episode of drinking, advice is to limit the total amount drunk on any occasion, drink more slowly, drink with food and alternate with water. The guideline on drinking and pregnancy, or planning a pregnancy, advises that the safest approach is not to drink alcohol at all[24].
Questions On Alcohol
Questions about drinking alcohol have been included in SHeS since its inception in 1995. Questions are asked either face-to-face via the interviewer or included in the self-completion questionnaire if they are deemed too sensitive for a face-to-face interview (e.g. if being interviewed with a parent). All those aged 16-17 years are asked about their consumption via the self-completion, as are some of those aged 18-19 years, at the interviewers’ discretion. The way in which alcohol consumption is estimated in the survey was changed significantly in 2008. A detailed discussion of those revisions can be found in the chapter on alcohol consumption in the 2008 report[25].
In 2021, the SHeS questionnaire covered the following aspects of alcohol consumption:
- usual weekly consumption
- problem drinking
Weekly consumption
Participants (aged 16 years and over) were asked preliminary questions to determine whether they drank alcohol at all. For those who reported that they drank, these were followed by further questions on how often during the past 12 months they had drunk each of six different types of alcoholic drink:
- normal strength beer, lager, stout, cider, and shandy
- strong beer, lager, stout, and cider
- spirits and liqueurs
- sherry and martini
- wine
- alcoholic soft drinks (alcopops)
From these questions, the average number of days per week the participant had drunk each type of drink was estimated. A follow-up question asked how much of each drink type they had usually drunk on each occasion. These data were converted into units of alcohol and multiplied by the amount they said they usually drank on any one day[26].
Problem drinking - Alcohol Use Disorders Identification Test (AUDIT)
Since 2012 the AUDIT questionnaire has been used to assess problem drinking. AUDIT is widely considered to be the best screening tool for detecting problematic alcohol use.
It comprises of ten indicators of problem drinking; three indicators of consumption, four of use of alcohol considered harmful to oneself or others, and three of physical dependency on alcohol. Given the potentially sensitive nature of these questions, they were administered in self-completion format for all participants. In line with the World Health Organisation guidelines on using the tool, responses to each of the ten AUDIT questions were assigned values of between 0 and 4[27]. Scores for the ten questions were summed to form a scale, from 0 to 40, of alcohol use.
The WHO guidelines[28] for interpreting AUDIT scale scores are as follows:
| Score | Category description |
|---|---|
| 0 to 7 | low-risk drinking behaviour, or abstinence |
| 8 to 15 | medium level of alcohol problems, with increased risk of developing alcohol-related health or social problems (sometimes described as hazardous drinking behaviour) |
| 16-19 | high level of alcohol problems, for which counselling is recommended (harmful drinking behaviour) |
| 20 or above | warrants further investigation for possible alcohol dependence |
Drinking over 3 units (women) or 4 units (men) per day
Consumption of more than three units (women) or four units (men) on a single day is also reported in the supplementary tables. This allows comparison with previous SHeS reports although these daily amounts of alcohol are no longer included in the most recent guidance from the UK CMOs. Consumption of double this amount (six units for women and eight for men) is also reported.
Calculating Alcohol Consumption
The guidelines on lower risk drinking are expressed in terms of units of alcohol consumed. Detailed information on both the volume of alcohol drunk in a typical week and on the heaviest drinking day in the week preceding the survey was collected from participants. The volumes reported were not validated. In the UK, a standard unit of alcohol is 10 millilitres or around 8 grams of ethanol (pure alcohol). In this chapter, alcohol consumption is reported in terms of units of alcohol.
Questions on the quantity of wine drunk were revised in 2008. Since then, participants reporting drinking any wine have been asked what size of glass they drank from: large (250ml), medium (175ml) and small (125ml). In addition, to help participants make more accurate judgements they are also shown a showcard depicting glasses with 125ml, 175ml and 250ml of liquid. Participants also had the option of specifying the quantity of wine drunk in bottles or fractions of a bottle; with a bottle treated as the equivalent of six small (125ml) glasses.
There are numerous challenges associated with calculating units at a population level, not least of which are the variability of alcohol strengths and the fact that these have changed over time. The table below outlines how the volumes of alcohol reported in the survey were converted into units (the 2008 report provides full information about how this process has changed over time)[29]. Those who drank bottled or canned beer, lager, stout or cider were asked in detail about what they drank, and this information was used to estimate the amount in pints.
| Type of drink | Volume reported | Unit conversion factor |
|---|---|---|
| Normal strength beer, lager, stout, cider, shandy (less than 6% Alcohol By Volume (ABV) | Half pint | 1.0 |
| Can or bottle | Amount in pints multiplied by 2.5 | |
| Small can (size unknown) | 1.5 | |
| Large can / bottle (size unknown) | 2.0 | |
| Strong beer, lager, stout, cider, shandy (6% ABV or more) | Half pint | 2.0 |
| Can or bottle | Amount in pints multiplied by 4 | |
| Small can (size unknown) | 2.0 | |
| Large can / bottle (size unknown) | 3.0 | |
| Wine (including champagne and prosecco) | 250ml glass | 3.0 |
| 175ml glass | 2.0 | |
| 125ml glass | 1.5 | |
| 750ml bottle | 1.5 x 6 | |
| Sherry, vermouth and other fortified wines | Glass | 1.0 |
| Spirits | Glass (single measure) | 1.0 |
| Alcopops | Small can or bottle | 1.5 |
| Large (700ml) bottle | 3.5 |
Drug Use
Respondents completing the adult and young adult self-completion questionnaires were presented with 21 drugs and asked to indicate whether they had taken each of these or not in the last 12 months. This list included several substances not regulated under the misuse of drugs act (poppers, solvents and nitric oxide), as well as prescription only painkillers that were not prescribed for them.
The drugs were categorised in the data tables according to their composite group within the Drugs Wheel[30]: cannabinoids, stimulants, opioids, depressants, psychedelics, dissociatives, empathogens, prescription painkillers and an additional category of steroids and by their classification: A, B or C (as defined by the Misuse of Drugs Act 1971[31]), as shown in the table below and overleaf.
| Drug | Drugs Wheel Category | Drug Class |
|---|---|---|
| Amphetamine (speed, sulph, uppers, Billy, base) | Stimulants | B |
| Methamphetamine (crystal meth, ice, glass, Tina, yabba, crystal) | Stimulants | A |
| Cannabis (weed, pot, grass, hash, skunk, ganja, blunt, dope, blow, spliff, smoke, green, edibles, joints, marijuana, oil, resin, pollen, shatter) | Cannabinoids | B |
| Synthetic cannabis (K2, spice, black mamba, incense, fake weed, Yucatan, genie) | Cannabinoids | B |
| Cocaine (coke, Charlie, white, flake, ching, posh, petrol) | Stimulants | A |
| Crack (rock, sand, stone, pebbles, freebase, wash) | Stimulants | A |
| Ecstasy/MDMA Powder (‘E’, ‘X’, eccies, ‘XTC’, MDMA, swedgerz, pingers, sweeties, pills, Mandy, madman) | Empathogens | A |
| Heroin (smack, skag, ‘H’, morphine, fentanyl, brown, junk, gear, kit) | Opioids | A |
| LSD (acid, tabs, trips, blotters) | Psychedelics | A |
| Magic mushrooms (mushies, psilocybin, shrooms, liberty caps) | Psychedelics | A |
| Methadone/Physeptone without prescription (phy, meth, linctus, juice, turtle, green) | Opioids | A |
| Semeron (sems, ‘S’)* | N/A | N/A |
| Anabolic steroids without prescription (steroids, roids) | Steroids | C |
| Poppers (amyl nitrate, liquid gold, TNT) | Stimulants | NC** |
| Ketamine (K, special K, KET) | Dissociatives | B |
| Glues, solvents, gas or aerosols (to sniff or inhale) | Depressants | NC** |
| Mephedrone (M-Cat, 4MMC, ‘bubbles’, drone, meph) | Stimulants | B |
| Tranquilisers: Benzodiazepines without prescription (temazepam, nitrazepam, diazepam, etizolam, Valium, Xanax, blues, yellows, benzos, jellies, scoobies) | Depressants | C |
| Drug | Drugs Wheel Category | Drug Class |
| GHB/GBL (G, GINA, LIQUID E, LIQUID X) | Depressants | C |
| Nitrous Oxide (laughing gas, whippets, NOS) | Dissociatives | NC** |
| Prescription only painkillers that were not prescribed for you (morphine, codeine, co-codamol, oxycontin, tramadol, gabapentin, pregabalin) | Prescription painkillers | NC** |
* Fictitious drug included for quality assurance purposes
** Not classified/class not determined
2.2.9 Chapter 9 – Gambling
Gambling Activities
All adult participants (aged 16 and over) were asked to report whether they had spent any money on nineteen different forms of gambling activity in the past 12 months. The activities presented ranged from buying tickets for the National Lottery draw to online betting and gaming. The range of activities presented reflected all forms of commercial gambling currently available in Scotland and included betting or gambling privately with family or friends to capture informal gambling activity.
In this chapter, gambling participation is defined as having participated in any one of these activities in the past 12 months. This definition also includes the requirement that the participant spent his/her own money on the activity. This was to ensure that those occasions where someone else placed bets or purchased lottery tickets with a participant’s money were included.
The list of gambling activities and descriptions presented to participants reflected those used in the British Gambling Prevalence Survey (BGPS) 2007 as closely as possible[32]. Exceptions included the addition of ‘playing poker in pub or club’ and of ‘betting on sports activities’ (like football) to reflect the growing popularity of these activities since the 2007 study.
As with the BGPS series, questions were asked using a confidential self-completion format. This was to encourage more honest reporting of a (potentially) sensitive activity and to ensure maximum comparability with the BGPS. Everyone who had gambled at least once in the last year was also asked to complete the Problem Gambling Severity Index (PGSI) screening instrument to identify problem or risky gambling behaviour.
Problem Gambling
Problem gambling is commonly accepted to involve ‘gambling to a degree that compromises, disrupts or damages family, personal or recreational pursuits’[33]. Despite this, there is no definitive definition of problem gambling and many different instruments or ‘screens’ exist to identify and measure problem gambling (with over 20 different types in existence)[34]. As yet, there is no agreed ‘gold standard’ instrument recommended for use in population surveys.
PGSI
In 2021, SHeS used PGSI[35], which was developed for use among the general population rather than within a clinical context and was tested and validated within a general population survey. The instrument consists of nine items ranging from chasing losses to gambling causing health problems and feeling guilty about gambling. Each item is assessed on a four-point scale: never, sometimes, most of the time, almost always. Responses to each item are given the following scores: never = zero; sometimes = one; most of the time = two; almost always = three. Scores for each item are summed to give a total score ranging from zero to 27. A score of eight or over on the PGSI represent problem gambling. This is the threshold recommended by the developers of the PGSI and the threshold used in this report. The PGSI was also developed to give further information on sub-threshold problem gamblers. PGSI scores between three and seven are indicative of ‘moderate risk’ gambling and scores of one or two are indicative of ‘low risk’ gambling[36].The PGSI thresholds and scoring mechanisms used in SHeS are the same as those used in the BGPS.
Problem gambling scores
To produce problem gambling prevalence rates among all adults aged 16 and over, all non-gamblers were allocated a score of zero in the PGSI screen. To be included in the final analysis, participants were required to have answered at least four of the PGSI questions. Those who answered less than this were only included in the final analysis if their responses to the answered questions scored them as a problem gambler.
2.2.10 Chapter 10 – Accidents
Injury And Accidents
Although the term ‘injury’ is now frequently used as a high proportion of these incidents are regarded as being preventable[37], in order to maintain continuity with earlier data in the Scottish Health Survey and for ease of understanding among participants, the 2021 Scottish Health Survey continued to refer to ‘accidents’, with this covering a very broad range of events from the extremely serious through to the relatively trivial. When referring to data from the Scottish Health Survey the term ‘accident’ is used, whereas ‘injury’ is generally used to refer to data from other sources specifically collected as injuries.
The definition of ‘accident’ used in the Scottish Health Survey is any accidental event which resulted in injury or physical harm where advice was sought from a doctor, nurse or other health professional, or which caused time to be taken off work or school.
Participants were asked to recall any accidents they had had in the 12 months prior to the interview which fitted this definition. Figures shown within the report, however, are based only on those accidents about which advice was sought from a doctor or which required a visit to hospital.
All those who reported having at least one accident of this kind were then asked detailed questions about the nature and cause of the most recent accident. The reference period of 12 months before the interview was chosen so as to be sufficiently long to generate details of enough accidents for analysis, yet short enough for participants to be able to remember accurate details about their most recent unintentional injury.
Data on accidents was collected in the 1998 and 2003 surveys and biennially from 2009.
Coverage Of Accidents
The survey covers most, but not all, accidents to adults and children. Since SHeS collects data directly from participants, fatal accidents are excluded. In addition, there will be under-representation of accidents that lead to long-term hospitalisation. For these reasons, the accident data presented in this chapter can best be described as non-fatal accident prevalence for the household population. Reported prevalence will most likely slightly under-estimate true accident prevalence because of the exclusions. However, since the great majority of accidents do not lead to long-term stays in hospitals, any downward bias should be small.
Causes Of Accidents
Participants who had at least one accident in the 12 months prior to interview were asked to describe the cause of the most recent accident and interviewers coded responses using the following options:
- hit by a falling object
- fall, slip or trip
- road traffic accident
- sports or recreational accident
- use of tool of implement, or piece of electrical or mechanical equipment
- burn or scald
- animal or insect bite or sting
- caused by another person (e.g. attacked)
- lifting
- other
Some caution is needed in the interpretation of the data on cause of accident derived from this interviewer coding. What is coded in individual cases will depend firstly upon how the participant describes the accident and secondly on how the interviewer interprets that description. For example, an accident in which a child sprains their ankle when playing football may be described as a fall by one participant (“I fell and sprained my ankle”) or as a sporting accident by another (“I sprained my ankle when I was out playing football”). If the participant describes the accident to the interviewer as “I fell and sprained my ankle” then some interviewers may code this as a fall or slip automatically, whereas others may probe further, establish that the participant was playing football at the time of the fall, and code it as a sports accident. Interviewers were briefed to code more than one cause per accident if appropriate, the intention being to collect as full a description of the accident as possible in order to avoid misclassification. One implication of the ambiguity in coding is that prevalence of accidents cannot be readily derived for different types of accident.
References and notes
1 Diabetes and high blood pressure are not included in the definition of ‘any CVD condition’ as they are risk factors for CVD.
2 Kammann, R. and Flett, R. (1983). Sourcebook for measuring well-being with Affectometer 2. Dunedin, New Zealand: Why Not? Foundation. Information on measuring mental wellbeing using WEMWBS is available online from: Error! Main Document Only. Further information about WEMWBS is available at: www.healthscotland.com/scotlands-health/population/Measuring-positive-mental-health.aspx
3 Stewart-Brown, S and Janmohamed, K (2008). Warwick-Edinburgh Mental Well-being Scale (WEMWBS). User Guide Version 1. Warwick and Edinburgh: University of Warwick and NHS Health Scotland. Available at: http://www.healthscotland.com/documents/2702.aspx
4 See: http://nationalperformance.gov.scot/
5 NHS Health Scotland (2012) Establishing a core set of national, sustainable
mental health indicators for children and young people in Scotland: Final Report.
[online]. Available at: http://www.healthscotland.com/uploads/documents/18753-C&YP%20Mental%20Health%20Indicators%20FINAL%20Report.pdf
6 Goldberg, D and Williams, PA (1988). A User's Guide to the General Health Questionnaire.
Windsor: NFER-Nelson.
7 Lewis, G. & Pelosi, A. J. (1990). Manual of the Revised Clinical Interview Schedule CIS–R. London: Institute of Psychiatry; Lewis G, Pelosi AJ, Araya R, Dunn G. (1992) Measuring psychiatric disorder in the community; a standardised assessment for use by lay interviewers. Psychological Medicine; 22, 465-486.
8 The nurse interview is conducted with one adult at a time, whereas the main interview can be conducted concurrently with up to four household members present. It was therefore easier to ensure that these questions could be answered in confidence. Nurses were also thought to be better placed to handle very sensitive topics such as these than interviewers conducting a general health survey who would have required additional specialist briefing. A leaflet with various help lines was handed to all participants in the nurse visit. From 2012, these questions have been included in the biological module of the survey, conducted by specially trained interviewers, and will be completed by participants using a self-completion computer aided questionnaire.
9 See: www.healthscotland.com/scotlands-health/population/mental-health-indicators.aspx
10 Prior to 2012 a fuller version of the MRC Respiratory Symptoms Questionnaire was included in the 1995-2003 and 2008 and 2010 surveys, alongside questions about wheezing and whistling in the chest that were added to the survey in 1998 as part of the asthma module. To reduce duplication and participant burden, from 2012 onwards the MRC Questionnaire items on wheezing were cut (the questions on phlegm and breathlessness were retained).
11 See https://www.gov.scot/publications/scottish-dietary-goals-march-2016/
12 See https://www.gov.uk/government/collections/national-diet-and-nutrition-survey
14 See https://www.gov.uk/government/statistics/ndns-time-trend-and-income-analyses-for-years-1-to-9
15 Romero-Corral, A. et al (2008). Accuracy of body mass index in diagnosing obesity in the adult general population. International Journal of Obesity, 32: 959–966.
17 These cut-offs differ to those used in the previous surveys. In 1995 and 1998 the normal weight range was defined as 20-25 kg/m2, in 2003 it was changed to 18.5-25 kg/m2. From 2008 onwards the ranges are defined as set out below. This brings the definition in line with WHO recommendations. The impact of the change of definition is very marginal as very few people have a BMI measurement that is exactly 18.5, 25, 30 or 40 kg/m2.
| 2003 | 2008 onwards | |
|---|---|---|
| Underweight | 18.5 or under | Less than 18.5 |
| Normal weight | Over 18.5 – 25 | 18.5 to less than 25 |
| Overweight | Over 25 – 30 | 25 to less than 30 |
| Obese | Over 30 – 40 | 30 to less than 40 |
| Morbidly obese | Over 40 | 40+ |
18 These cut-offs differ to those used in the previous surveys. In 1995 and 1998 the normal weight range was defined as 20-25 kg/m2, in 2003 it was changed to 18.5-25 kg/m2. From 2008 onwards the ranges are defined as set out below. This brings the definition in line with WHO recommendations. The impact of the change of definition is very marginal as very few people have a BMI measurement that is exactly 18.5, 25, 30 or 40 kg/m2.
| 2003 | 2008 onwards | |
|---|---|---|
| Underweight | 18.5 or under | Less than 18.5 |
| Normal weight | Over 18.5 – 25 | 18.5 to less than 25 |
| Overweight | Over 25 – 30 | 25 to less than 30 |
| Obese | Over 30 – 40 | 30 to less than 40 |
| Morbidly obese | Over 40 | 40+ |
19 The questions used in the survey since 1998 are based on the Allied Dunbar National Fitness Survey, a major study of physical activity among the adult population in England carried out in 1990. For further details see: Health Education Authority. Allied Dunbar National Fitness Survey. Health Education Authority and Sports Council, London. 1992
20 Bromley C. (2013) Chapter 6: Physical Activity. In Rutherford L, Hinchliffe S and Sharp C (eds.) Scottish Health Survey 2012 – Volume 1: Main Report. Edinburgh: Scottish Government. Available at: https://www.gov.scot/publications/scottish-health-survey-2012-volume-1-main-report/pages/10/
21 The questions on child physical activity included in SHeS since 1998 are based on the 1997 Health Survey for England (HSE) children’s physical activity module.
22 Gray L & Leyland AH (2009). Chapter 4: Smoking. In: Bromley, C., Bradshaw, P. and Given, L. (eds.) The 2008 Scottish Health Survey – Volume 1: Main Report. Edinburgh: Scottish Government. 2009. www.gov.scot/Publications/2009/09/28102003/0
23 Gray L & Leyland AH (2013). Chapter 4: Smoking. In: Rutherford, L., Hinchliffe, S. and Sharp, C. (eds.) The Scottish Health Survey 2012 – Volume 1: Main Report. Edinburgh: Scottish Government. Available at: www.gov.scot/Publications/2013/09/3684
24 See: https://www.drinkaware.co.uk/alcohol-facts/alcoholic-drinks-units/latest-uk-alcohol-unit-guidance/
25 Reid S (2009). Chapter 3: Alcohol consumption. In: Bromley C, Bradshaw P and Given L. (eds.) The 2008 Scottish Health Survey – Volume 1: Main Report. Edinburgh: Scottish Government. 2009. Available at: www.gov.scot/Publications/2009/09/28102003/31
26 For participants aged 16 and 17, details on alcohol consumption were collected as part of a special smoking and drinking self-completion questionnaire. Some aged 18 and 19 also completed the self-completion if the interviewer felt it was appropriate. For all other adult participants, the information was collected as part of the face-to-face interview. The method of estimating consumption follows that originally developed for use in the General Household Survey and is also used in the Health Survey for England. For six types of alcoholic drink (normal strength beer/lager/cider/shandy, strong beer/lager/cider, spirits/liqueurs, fortified wines, wine, and alcoholic soft drinks), participants were asked about how often they had drunk each one in the past twelve months, and how much they had usually drunk on any one day. The amount given to the latter question was converted into units of alcohol, with a unit equal to half a pint of normal strength beer/lager/cider/alcoholic soft drink, a single measure of spirits, one glass of wine, or one small glass of fortified wine. A half pint of strong beer/lager/cider was equal to 1.5 units. The number of units was then multiplied by the frequency to give an estimate of weekly consumption of each type of drink. The frequency multipliers were:
| Drinking frequency | Multiplying factor |
|---|---|
| Almost every day | 7.0 |
| 5 or 6 times a week | 5.5 |
| 3 or 4 times a week | 3.5 |
| Once or twice a week | 1.5 |
| Once or twice a month | 0.375 |
| One every couple months | 0.115 |
| Once or twice a year | 0.029 |
The separate consumption figures for each type of drink were rounded to two decimal places and then added together to give an overall weekly consumption figure.
27 AUDIT questionnaire
| Questions | 0 | 1 | 2 | 3 | 4 |
|---|---|---|---|---|---|
| 1. How often do you have a drink containing alcohol? | Never | Monthly or less | 2-4 times a month | 2-3 times a week | 4 or more times a week |
| 2. How many drinks containing alcohol do you have on a typical day when you are drinking? | 1 or 2 | 3 or 4 | 5 or 6 | 7 to 9 | 10 or more |
| 3. How often do you have six or more drinks on one occasion? | Never | Less than monthly | Monthly | Weekly | Daily or almost daily |
| 4. How often during the last year have you found that you were not able to stop drinking once you had started? | Never | Less than monthly | Monthly | Weekly | Daily or almost daily |
| 5. How often during the last year have you failed to do what was normally expected of you because of drinking? | Never | Less than monthly | Monthly | Weekly | Daily or almost daily |
| 6. How often during the last year have you needed a first drink in the morning to get yourself going after a heavy drinking session? | Never | Less than monthly | Monthly | Weekly | Daily or almost daily |
| 7. How often during the last year have you had a feeling of guilt or remorse after drinking? | Never | Less than monthly | Monthly | Weekly | Daily or almost daily |
| 8. How often during the last year have you been unable to remember what happened the night before because of your drinking? | Never | Less than monthly | Monthly | Weekly | Daily or almost daily |
| 9. Have you or someone else been injured because of your drinking? | No | Yes, but not in the last year | Yes, during the last year | ||
| 10. Has a relative, friend, doctor, or other health care worker been concerned about your drinking last year? | No | Yes, but not in the last year | Yes, during the last year |
28 Babor, T.F., Higgins-Biddle, J.C., Saunders, J.B. and Monteiro, M.G (2001). AUDIT – The Alcohol Use Disorders Identification Test – Guidelines for Use in Primary Care, Second Edition. Geneva: World Health Organization.
29 See: https://www.gov.scot/publications/scottish-health-survey-2008/pages/29/
30 See http://www.thedrugswheel.com/
31 See https://www.legislation.gov.uk/ukpga/1971/38/contents
32 The BGPS 1999 and 2007 used a paper self-completion booklet to collect data. In 2010, computer-assisted self-completion was used which allowed the questionnaire to have a more complex structure as more follow-up questions could be asked. As the Scottish Health Survey used a paper self-completion, the questionnaire structure and format of the 1999 and 2007 studies was followed.
33 Lesieur H.R, Rosenthal M.D. (1991). Pathological gambling: A review of the literature (prepared for the American Psychiatric Association Task Force on DSM-IV Committee on disorders of impulse control not elsewhere classified). Journal of Gambling Studies 7, 1, 5-40.
34 Abbott, M., Volberg., R (2007) The measurement of adult problem and pathological gambling. International Gambling Studies, 6(2); 175-200.
35 Potenza, M. N., Fiellin, D. A., Heninger, G. R., Rounsaville, B. J. and Mazure, C. M. (2002).
Gambling. Journal of General Internal Medicine 17: 721–732. doi: 10.1046/j.1525-1497.2002.10812.x
36 Some researchers have recommended that different (lower) thresholds should be used when identifying problem gamblers using the PGSI. However, these recommendations have not been universally accepted and are not currently endorsed by the original developers of the PGSI instrument. Therefore, this chapter uses the thresholds and categorisation recommended by the original developers and replicates the methods used in the BGPS, also allowing comparisons to be made.
37 See: www.scotpho.org.uk/health-wellbeing-and-disease/injuries/introduction