Scottish Health Survey 2019 - volume 1: main report
Presents results for the Scottish Health Survey 2019, providing information on the health and factors relating to health of people living in Scotland.
Chapter 6: Diet and Obesity
In 2019, around one in five of all adults consumed five or more portions of fruit and vegetables a day *, similar to levels recorded since 2003.
- 21% in 2003
- 22% in 2019
Contrary to the previous trend of women being more likely than men to consume the recommended five-a-day portions of fruit and vegetables, there was no significant difference between men and women in 2019.
Consumption of 5 or more fruit and veg portions a day in 2019
- 23% Women
- 21% Men
Mean portions of fruit and vegetables per day
- women 3.3 portions per day (mean)
- men 3.2 portions per day (mean)
In 2019, around one in seven children aged 2 –15 met the five-a-day recommendation for consumption of fruit and vegetables.
- 14%
Girls were significantly more likely to meet the recommendation than boys.
- 16% Girls
- 12% Boys
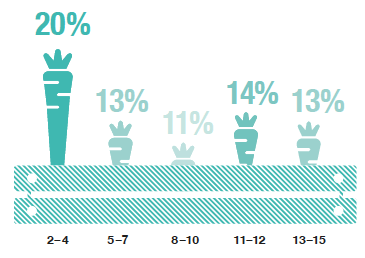
In 2019, children aged 2– 4 years were more likely to consume five or more portions of fruit and vegetables on a typical day than older children.
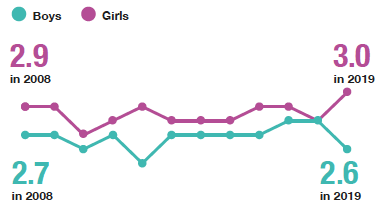
Girls have consumed higher levels of fruit and vegetables per day* than boys in most years since 2008.
Mean portions of fruit and vegetables per day
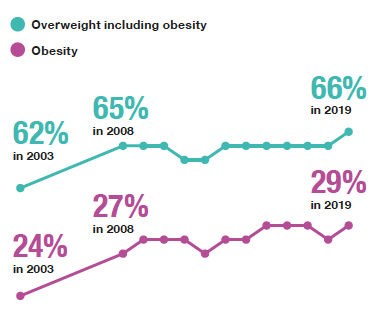
In 2019, two in three adults were overweight including obesity **, the highest prevalence in the time series since 2003. Obesity *** prevalence has remained relatively stable since 2008.
In 2019, women were more likely than men to be within the healthy weight range †.
- 29% Women
- 36% Men
The mean BMI of women was significantly higher than men in the youngest age group in 2019.
- 25.9 kg/m2 women aged 16-24
- 23.9 kg/m2 men aged 16-24
In 2019, mean BMI increased with age.
** BMI of 25 kg/mÇ or over.
*** BMI of 30 kg/m2 or over.
† BMI of 18.5 to less than 25 kg/m2.
The proportion of children (aged 2–15) in the healthy weight range † † has remained fairly stable since 1998.
- 70% in 1998
- 72% in 2015
- 68% in 2019
The highest proportion of children in the healthy weight range was among those aged 7–11, and the lowest among those aged 12–15.
- 2-6 - 68%
- 7-11 - 73%
- 12-15 - 62%
Just under a fifth of children were at risk of obesity in 2019 with similar levels observed for boys and girls.
- 16% of children at risk of obesity
Women were more likely than men to be categorised as 'high health risk or above' based on their BMI and waist circumference † † † .
- 55% women
- 44% men
This difference was clearest among the youngest adults.
† † BMI above the 2nd percentile or below the 85th percentile.
† † † According to SIGN guidelines.
Food insecurity levels (as defined by being worried during the past 12 months that they would run out of food due to lack of money or resources) remained at 9% in 2019.
- 8% in 2017
- 9% in 2018
- 9% in 2019
Food insecurity was more prevalent among younger than older adults in 2019.
- 13% 16-44
- 8% 45-64
- 2% 65+
Adults living in single parent households were most likely to report being food insecure.
- 31% Single parent household (one adult any age and one or more children † † † † )
- 20% Single adult household (one adult aged 16–64, no children)
- 13% Large family household (two adults of any age and three or more children; or three or more adults and one or more children)
- 9% Small family household (two adults of any age and one or two children)
- 8% Small adult household (two adults under 65, no children)
- 6% Large adult household (three or more adults, no children)
- 2% Single older adult household (one adult aged 65 or over)
- 2% Older smaller family household (comprising two adults only, at least one of whom is aged 65 or over)
† † † † Largely single mothers
6 Diet and Obesity
6.1 introduction
Globally, poor diet is a leading risk factor for ill health[1] while obesity, as defined in adults as having a body mass index (BMI) of 25 kg/m² or greater[2], has been linked to a range of comorbidities including diabetes, cariovascular disease (CVD), hypertension and certain cancers[3],[4]. Overweight and obesity is not the only cause of such health problems, poor diet also increases the risk of health problems, for example salt increases the risk of high blood pressure and stroke, saturated fat increases the risk of CVD and sugary drinks increase the risk of type 2 diabetes[5]. In 2017, poor diet accounted for 11 million (one in five) deaths across 195 countries; with diets low in wholegrains and fruits and high in sodium accounting for more than half of these deaths[6].
Research suggests a reciprocal link between obesity and mental health problems such as depression and anxiety[7],[8],[9]. There is also evidence of a link between overweight and obesity in midlife and dementia in late life[10],[11],[12] and of younger generations in the UK becoming obese at earlier ages and staying obese longer[13].
Worldwide, 8% of deaths in 2017 were attributed to obesity, an increase from 4.5% in 1990[14]. In 2016, 39% of adults aged 18 and over across the world were overweight and 13% were obese, while the rate of overweight and obesity among children and young people aged 5-19 was over four times higher in 2016 (18%) than it was in 1975 (4%)[15]. Obesity levels in Scotland are among the highest of the OECD countries with the energy density of the average person's diet in Scotland estimated to be 40% over the Scottish dietary goal[16].
Being overweight and obese increases the risk of many cancers[17] and is implicated in about a third of cardiovascular disease[18] worldwide. Such conditions could be prevented by improvements in the nutritional content of diets and overall reductions in body mass[19]. Evidence has shown that consumption of fruit and vegetables and oil-rich fish decrease the risk of CVD, fruit and vegetables have also been shown to reduce some cancers and fibre decreases the risk of bowel cancer[20].
The full extent of the economic burden of poor diet is difficult to ascertain[21], however, the most recent evidence suggests that unhealthy diet had an economic burden of £5.8 billion in 2006-07; a greater burden on the NHS than smoking, alcohol consumption, overweight and obesity or physical inactivity[22].The cost to the health service in Scotland of overweight and obesity combined is estimated to be between £363 and £600 million (most of these costs are incurred because of associated conditions such as cardiovascular disease and type 2 diabetes, rather than direct costs of treating or managing overweight and obesity)[23].
With considerable individual, social, and economic consequences, obesity continues to be a top public health priority for the Scottish government, the NHS and other public services.
6.1.1 Policy background
The World Health Organisation states that improving diets, along with other lifestyle measures such as increased physical activity, reduces the risks of chronic diseases for death and disability while concurrently reducing the financial burden on healthcare services[24].
The Scottish Government published A Healthier Future: Scotland's Diet and Healthy Weight Delivery Plan[25] in July 2018. The delivery plan set out an ambition to halve child obesity by 2030 and significantly reduce diet-related health inequalities. It sets out a wide range of actions aimed at ensuring:
- Children have the best start in life – they eat well and have a healthy weight.
- The food environment supports healthy choices.
- People have access to effective weight management services.
- Leaders across all sectors promote healthy weight and diet.
- Diet-related inequalities are reduced.
The Scottish Dietary Goals, revised in 2016[26], provide the basis for a healthy balanced diet. The Goals decribe, in nutritional terms, a diet that will improve and support the health of the Scottish populationincluding:
- The World Health Organisation 5-a-day recommendation for adults (to consume at least five varied 80g portions of fruit and vegetables per day).
- Reduced salt intake from around 9g to 6g per day for adults.
- Reduced average calorie intake by 120 kcal per day and average intake of red meat to 70g per day.
- Advice on limiting fat and sugar intake and increasing consumption of fibre and oil-rich fish.
- Reduced the average intake of free sugars to 5% of total dietary energy.
- Increased intake of dietary fibre to 30g per day for adults.
- Maintained intake of starchy carbohydrates at 50% of total dietary energy.
It is recognised at a national policy level that a 'whole system approach', including eating well, maintaining a healthy weight and regular physical exercise, is a key public health priority for Scotland[27]. Reducing the prevalence of overweight and obesity also contributes to the National Performance Framework outcome 'we are healthy and active'[28]. There is a related indicator to monitor the proportion of healthy weight adults and children of which the Scottish Health Survey is the official source of data.
Food insecurity is the outcome of wider poverty and inequality. The Scottish Government committed to monitoring household food insecurity in 2016, following recommendations from an Independent 136 Working Group on Food Poverty[29]. The working group was established in response to food bank data which reported a significant increase in the number of people seeking their support. Measurement of food insecurity in SHeS provides valuable data for reporting on the food insecurity indicator in the National Performance Framework, which has been aligned with the UN Sustainable Development Goals including Goal 2 - "Zero Hunger".
Work to tackle food insecurity is underpinned by the Scottish Government's £3.5 million Fair Food Fund which supports dignified responses to food insecurity that help to tackle the causes of poverty. The Fair Food Fund sits within a wider package of funding that supports a range of policies aiming to tackle poverty and inequality. Since March 2020, the Scottish Government have committed over £110 million to tackling food insecurity due to COVID-19, however, any impact of this funding will not be captured in the SHeS 2019 data.
6.1.2 Reporting on diet and obesity in the Scottish Health Survey (SHeS)
This chapter provides information on fruit and vegetable consumption and BMI among adults and children from 2003 to 2019. In addition, adult health risk categories associated with BMI and waist circumference are reported for 2018/2019 combined. Figures on food insecurity for adults are also provided by age and sex and by household type for 2018/2019 combined.
The anthropometric measures presented in this chapter focus on measurements relevant to adult and child obesity. Height, weight and waist measurements have been collected during the survey interview every year since its inception in 1995. SHeS is one of a small number of surveys that collects height, weight and waist measures rather than using self-reported measures, which are known to be less accurate[30],[31]. Height and weight are used to calculate Body Mass Index (BMI), the primary measure of obesity used in the SHeS series.
Supplementary tables on diet are also published on the Scottish Government SHeS website https://www.gov.scot/collections/scottish-health-survey/
6.1.3 Comparability with other UK statistics
Adult obesity is defined consistently in the Scottish Health Survey (SHeS) and the other health surveys within the UK using BMI classifications. Height and weight measurements are self-reported in the National Survey for Wales and are therefore not directly comparable with equivalent statistics in Scotland, England and Northern Ireland, where direct measurements are taken. Sampling methodologies differ between the surveys. Of the four UK health surveys, SHeS and Health Survey for England are the most closely aligned.
6.2 Methods and Definitions
6.2.1 Measuring fruit and vegetable consumption
The module of questions on fruit and vegetable consumption was designed with the aim of providing sufficient detail to monitor population-level adherence to the 5-a-day recommendation. These questions have been asked of all adults (aged 16 and over) participating in the survey since 2003 and of children aged 2 to 15 since 2008.
The module includes questions on consumption of the following food types in the 24 hours to midnight preceding the interview:
- vegetables (fresh, frozen or canned);
- salads;
- pulses;
- vegetables in composites (e.g. vegetable chilli);
- fruit (fresh, frozen or canned);
- dried fruit;
- fruit in composites (e.g. apple pie);
- fresh fruit juice.
A portion is defined as the conventional 80g of a fruit or vegetable. Since 80g is difficult to visualise, survey respondents were asked to describe the amount of each fruit or vegetable they consumed using more everyday terms, such as tablespoons, cereal bowls and slices. These everyday measures were then converted to 80g portions prior to analysis. Examples are given in the questionnaire to aid the recall process, for instance, tablespoons of vegetables, cereal bowls full of salad, pieces of medium sized fruit (e.g. apples) or handfuls of small fruits (e.g. raspberries). In spite of this, there may be some variation between participants' interpretation of how much they consumed. The following table shows the definitions of the portion sizes used for each food item included in the survey:
| Food item | Portion size |
|---|---|
| Vegetables (fresh, frozen or canned) | 3 tablespoons |
| Pulses (dried) | 3 tablespoons |
| Salad | 1 cereal bowlful |
| Vegetables in composites, such as vegetable chilli | 3 tablespoons |
| Very large fruit, such as melon | 1 average slice |
| Large fruit, such as grapefruit | Half a fruit |
| Medium fruit, such as apples | 1 fruit |
| Small fruit, such as plums | 2 fruits |
| Very small fruit, such as blackberries | 2 average handfuls |
| Dried fruit | 1 tablespoon |
| Fruit in composites, such as stewed fruit in apple pie | 3 tablespoons |
| Frozen fruit/canned fruit | 3 tablespoons |
| Fruit juice | 1 small glass (150 ml) |
Since the 5-a-day recommendation stresses both volume and variety, the number of portions of fruit juice, pulses and dried fruit is capped so that no more than one portion of each can contribute to the total number of portions consumed. Interviewers record full or half portions, but nothing smaller.
6.2.2 Height
Height was measured using a portable stadiometer with a sliding head plate, base plate and four connecting rods marked with a metric measuring scale. Participants were asked to remove shoes. One measurement was taken, with the participant stretching to the maximum height and the head positioned in the Frankfort plane[32]. If the reading was between two millimetres it was recorded to the nearest even millimetre. No measurement was taken from participants who were pregnant, aged under 2, or unsteady on their feet.
6.2.3 Weight
Weight was measured using Seca electronic scales, which use a digital display. Participants were asked to remove shoes and any bulky clothing. A single measurement was recorded to the nearest 100g. A weight measurement was not collected from participants who were pregnant, aged under 2 years, or unsteady on their feet. Due to the scale limits, estimates were required for those weighing more than 200 kg. These estimated weights were included in the analysis presented in this chapter.
In the analysis of height and weight, data from those who were considered by the interviewer to have unreliable measurements, for example those who had excessive clothing on, were excluded.
6.2.4 Waist
Since 2012, specially trained interviewers have taken waist measurements from respondents. These interviewers followed a different protocol for taking the measurements than the nurses who previously took the measurements (see below for details). Results in this chapter are calibrated to allow the comparison of interviewer measurements with those previously taken by nurses.
Waist circumference is now defined as around the navel or tummy button. Waist was measured using a tape with an insertion buckle at one end. Interviewers took each measurement twice, using the same tape, and recorded readings. If the reading fell between two millimetres the reading was taken to the nearest even millimetre. Those participants whose two waist measurements differed by more than 3 cm had a third measurement taken. The mean of the two valid measurements (the two out of the three measurements that were the closest to each other, if there were three measurements) was used in the analysis presented in this chapter. Participants were excluded if they reported that they were pregnant, had a colostomy or ileostomy, or were unable to stand. All those with measurements considered unreliable by the interviewer, for example due to excessive clothing or movement, were excluded from the analysis presented in this chapter.
6.2.5 Definitions
Body Mass Index (BMI)
BMI is a widely accepted measure that allows for differences in weight due to height. It is defined as weight (kg)/square of height (m2). This has been used as a measure of obesity in the Scottish Health Survey (SHeS) since its inception in 1995. BMI was calculated from valid measures collected by the interviewer.
Adult BMI classification
Based on their BMI, adult participants were classified into the following groups based on the World Health Organisation (WHO) classification[33]:
| BMI (kg/m2) | Description |
|---|---|
| Less than 18.5 | Underweight |
| 18.5 to less than 25 | Normal |
| 25 to less than 30 | Overweight, excluding obese |
| 30 to less than 40 | Obese, excluding morbidly obese |
| 40+ | Morbidly obese |
In this chapter, both mean BMI and prevalence for the five categories outlined in the table above are presented for adults. Although obesity has the greatest ill-health and mortality consequences, overweight is also a major public health concern, not least because overweight people are at high risk of becoming obese. Being underweight can also have negative health consequences.
Child BMI classification
BMI is defined for children in the same way as it is for adults: weight (kg)/square of height (m2). The International Obesity Task Force concluded that BMI is a reasonable measure of adiposity in children[34]and it is the key measure of overweight and obesity for children used in the SHeS series.
Despite the relatively wide acceptance of the use of BMI as an adiposity indicator, the establishment of an agreed specific obesity and overweight classification system for children and young people remains challenging. Constant changes in body composition during growth mean that the relationship between weight-for-height and adiposity during childhood and adolescence is age-dependent, and this relationship is further complicated by both ethnicity and gender[35].
The classification of children's BMI used in this chapter, set out below, has been derived from BMI percentiles of the UK 1990 reference curves[36],[37] (referred to as the national BMI percentiles classification); these have been used in each SHeS to date. The national BMI percentiles classification has been shown to be reasonably sensitive (i.e. not classifying obese children as non-obese) and specific (i.e. not classifying non-obese children as obese)[38],[39]. SIGN recommends that these reference curves and thresholds should be used for population surveillance in Scotland[40].The 85th/95th percentile cut-off points are commonly accepted thresholds used to analyse overweight and obesity in children. These thresholds have previously been used to describe childhood overweight and obesity prevalence trends in the UK[41],[42],[43],[44].
| Percentile cut-off | Description |
|---|---|
| At or below 2nd percentile | At risk of underweight |
| Above 2nd percentile and below 85th percentile | Healthy weight |
| At or above 85th percentile and below 95th percentile | At risk of overweight |
| At or above 95th percentile | At risk of obesity |
SHeS uses a method developed by Public Health Scotland to plot the exact ages of the children in the sample against the reference population data[45].While children's exact age was used to calculate the BMI grouping prevalence rates (based on the interview date and the date of birth), results are presented using grouped ages based on age at last birthday.
As noted in the introduction to this chapter, one of the Scottish Government's national indicators relates to healthy weight in both children and adults, defined as neither underweight nor overweight or obese[46]. The presented data for children have been categorised to show the total proportions that are: healthy weight, at risk of overweight, at risk of obesity, and at risk of underweight.
Raised waist circumference (WC)
BMI has some limitations and does not, for example, distinguish between mass due to body fat and mass due to muscular physique[47]. Nor does it take account of the distribution of fat in the body. It has therefore been suggested that WC may be a better means of identifying those with a health risk than BMI[48],[49],[50].
In accordance with the definition of abdominal obesity used by the National Institutes of Health (USA) ATP (Adult Treatment Panel) III, a raised WC is defined as more than 102 cm for men and more than 88 cm for women[51]. Following the protocol introduced to SHeS in 2012, described in Section 6.2.4, the equivalent cut-offs on SHeS are 102.75cm for men and 91.35cm for women[52].
These thresholds help identify people at risk of metabolic syndrome. Abdominal obesity is reported as more highly correlated with metabolic risk factors (high levels of triglycerides, low HDL-cholesterol) than elevated BMI. It has recently been shown that these levels correspond fairly closely to the 95th percentile of waist circumference for healthy people, indicating that few healthy people have a waist circumference above these thresholds[53].
Combined assessment of health risk from obesity
The SIGN guideline on obesity cites the WHO's recommendation that an individual's risk of conditions such as type 2 diabetes and CVD is better estimated using a combination of both BMI and WC than using either measure on their own[54].
The classification categories suggested by SIGN[55] are set out in the following table. BMI, derived from height and weight data collected in the main interview, in combination with waist measurements collected in the biological module have been used to estimate the proportion of adults who fall into each of the risk categories. This combined classification designates those with a raised WC as 'very high' WC, while those towards the upper end of the 'not raised' WC range are designated 'high' WC. As the table indicates, the health risk is similar for adults with very high WC and class I obesity and for adults with high WC and class II obesity. The SIGN guidance notes that increased WC can be a marker for disease even among people of normal weight. The analysis presented in this chapter classifies people with normal weight and a very high WC as at increased risk of disease.
Assessment of health risk from obesity
| BMI Classification | 'High' WC Men WC 94-102cm Women WC 80-88cm |
'Very high' WC Men WC >102cm Women WC >88cm |
|---|---|---|
| Normal weight (BMI18.5 - <25(kg/m2)) | - | - |
| Overweight (BMI 25 - <30(kg/m2)) | Increased | High |
| Obese | ||
| I - Mild (BMI30 -<35(kg/m2)) | High | Very high |
| II - Moderate (BMI35 - <40(kg/m2)) | Very high | Very high |
| III - Extreme (BMI 40+(kg/m2)) | Extremely high | Extremely high |
Source: based on Table 3, P11, in SIGN 115[56].
6.3 Diet & Obesity
6.3.1 Adult fruit and vegetable consumption, 2003 to 2019, by sex
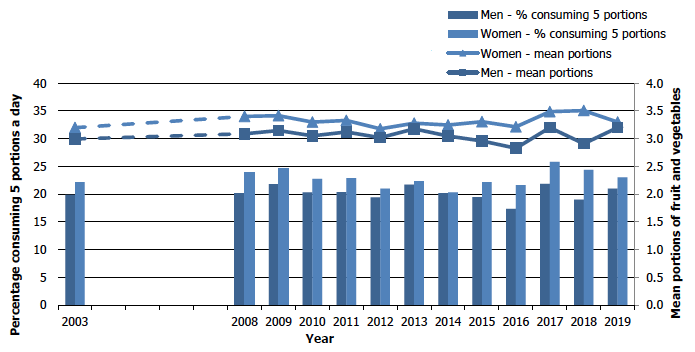
The proportion of adults meeting the five-a-day recommendation for consumption of fruit and vegetables has remained fairly constant since 2003, ranging between 20 - 24% (22% in 2019). In most years since 2003, women have been more likely than men to consume the recommended five a day portions of fruit and vegetables, yet in 2019 there was no significant difference between the sexes (23% of women compared with 21% of men met the five-a-day recommendation).
The proportion of adults consuming no fruit and vegetables on the day prior to interview has also remained relatively stable since 2003, ranging between 9 - 12% (10% in 2019). A trend that continued was that a higher proportion of men than women consumed no fruit or vegetables on that day (12% and 9% respectively).
Mean fruit and vegetable consumption has also varied very little since 2003, remaining between 3.0-3.3 portions on average per day (3.3 in 2019). In contrast to the general trend of women consuming more portions of fruit and vegetables (on average) in most years since 2003, mean fruit and vegetable portion consumption was not significantly different for women and men in 2019 (3.3 and 3.2 mean portions a day respectively). Figure 6A, Table 6.1
Percentage of adults consuming five portions of fruit and vegetables a day, and mean portions of fruit and vegetables consumed by adults, 2003 to 2009, by sex
6.3.2 Adult fruit and vegetable consumption, 2019, by age and sex
In 2019, the likelihood of consuming 5 or more portions of fruit or vegetables per day did not differ significantly by age.
There was also no significant difference by age for those who consumed no fruit or vegetables per day.
For all adults, there was no significant variation by age for mean fruit and vegetable portion consumption; among all age groups, mean consumption lay between 2.9 and 3.4 portions a day. Patterns by age did not differ significantly between men and women, however for women, average daily fruit and vegetable consumption was significantly lower in the youngest age group aged 16 to 24 (2.8 portions a day) compared with women aged 25-74 (between 3.3 and 3.5 portions). Table 6.2
6.3.3 Child fruit and vegetable consumption, 2008 to 2019, by sex
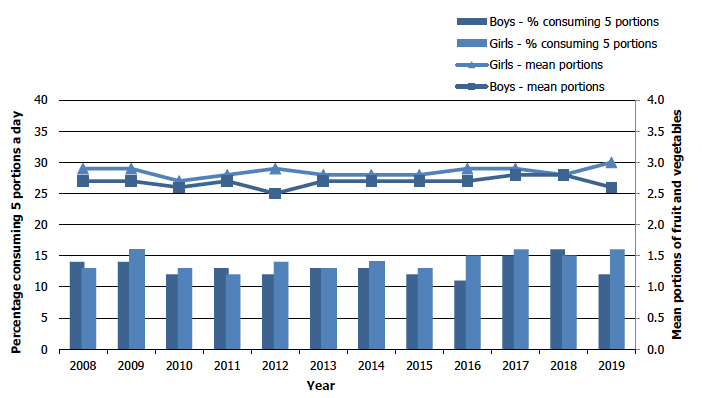
There has been little variation in the proportion of children meeting the five-a-day recommendation for fruit and vegetable consumption since 2008 with figures ranging between 12 - 15% (14% in 2019). Since 2008, the proportions of boys and girls meeting the five-a-day recommendation for consumption of fruit and vegetables has fluctuated within similar levels (11-16% for boys and 12-16% for girls).
The proportion of children consuming no fruit and vegetables on the day prior to interview has remained fairly constant since 2008 (7-11%), and this trend was continued in 2019 (9%). Figures have been similar for boys and girls over the time series.
Since 2008, there has been a relatively stable trend of between 2.6 and 2.9 mean portions of fruit and vegetables per day consumed by children (2.8 in 2019). Girls have consumed higher levels of fruit and vegetables per day than boys in most years since 2008 (between 2.7 and 3.0 portions for girls compared with between 2.5 and 2.8 for boys). Figure 6B, Table 6.3
Percentage of children consuming five portions of fruit and vegetables a day, and mean portions of fruit and vegetables consumed by children, 2008 to 2019, by sex
6.3.4 Child fruit and vegetable consumption, 2019, by age and sex
In 2019, girls were more likely to meet the five-a-day recommendation for consumption of fruit and vegetables (16% of girls compared with 12% of boys). In 2019, girls consumed more portions of fruit and vegetables, on average, per day than boys (3.0 portions on average for girls compared with 2.6 portions on average for boys).
In 2019, fruit and vegetable consumption levels for children varied by age. Children aged 2-4 were significantly more likely to consume five or more portions of fruit and vegetables on a typical day (20% compared with 11 - 14% among children aged 5-15).
Those in the youngest child age group also consumed significantly more portions of fruit and vegetables than older children (3.2 portions on average, among those aged 2-4 compared with 2.6-2.8 portions on average for children aged 5-15), and were significantly less likely to have consumed no fruit or vegetables on the day prior to the interview (5% of children aged 2-4 compared with 9 - 13% of children aged 5-15). Table 6.4
6.3.5 Mean adult BMI, prevalence of overweight and obesity, 2003 to 2019, by sex
Although prevalence of overweight including obesity (BMI of 25 kg/m² or over) has remained relatively stable among all adults since 2003 (62 - 66%), gradual increases since 2011 mean that prevalence is now at its highest level in the time series (66% in 2019).
Prevalence of overweight including obesity has remained relatively stable for both men and women since 2003, although men have had consistently higher prevalence compared with women (fluctuating between 65-69% among men, compared with 60-63% among women).
Following a rise from 24% to 27% between 2003 and 2008, the proportion of adults classified as obese (BMI of 30 kg/m² or over) has remained relatively unchanged since 2008, fluctuating between 27% and 29% across the time series (29% in 2019).
There has been little difference in the prevalence of obesity among men and women since 2008. Prevalence has remained between 26% and 29% for men (29% in 2019) and between 27% and 30% for women (30% in 2019).
Prevalence of morbid obesity (BMI of 40 kg/m² or over) has remained stable since 2003, fluctuating between 2% and 4% (4% in 2019). Since 2003, higher proportions of women were morbidly obese compared with men (3-6% compared with 1-3% over the time series). Table 6.5
6.3.6 Adult BMI, 2019, by age and sex
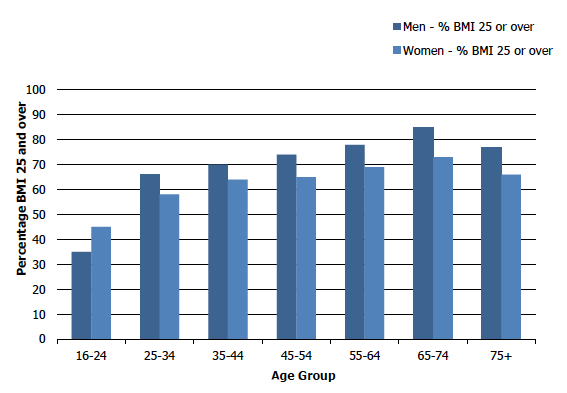
In 2019, 1 in 3 adults (33%) were in the healthy weight category (BMI of 18.5 to less than 25 kg/m2). Women were significantly more likely than men to be within the healthy weight range (36% compared with 29% respectively). As in previous years, in 2019 prevalence of overweight including obesity was significantly higher among men compared with women (69% and 63%, respectively).
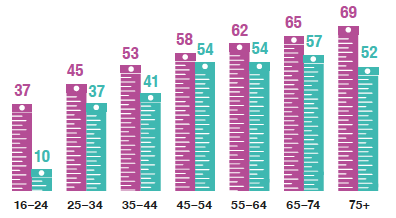
Prevalence of overweight including obesity also varied with age; increasing from 40% of those aged 16-24, then linearly among those aged 25-74, to a high of 79% among adults aged 65-74, before decreasing to 71% among those aged 75 and over. A similar pattern was observed in both men and women.
In 2019, prevalence of obesity (BMI of 30 kg/m² or more) varied with age; increasing from 17% among those aged 16-24 to 37% among those aged 65-74 before decreasing 32% among those aged 75 and over.
Different patterns by age were observed for men and women for the prevalence of obesity. For women, following a rise from 21% among those aged 16-24, prevalence among those aged 25-75 and over was similar (ranging between 29% and 33%). For men, there were steep increases between age groups for those aged 16-44 (14% to 30%) and another steep increase between those aged 55-64 and those aged 65-74 (from 33% to 42%).
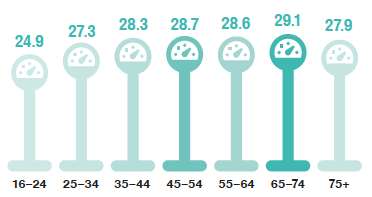
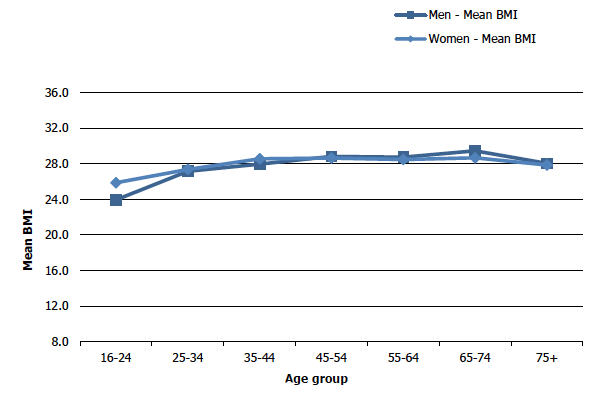
In 2019, the mean BMI was 27.9 for all adults with no significant difference by sex. Mean BMI generally increased with age up to the age of 74 among all adults (increasing from 24.9 kg/m2 among those aged 16-24 to 29.1 kg/m2 among those aged 65-74) before decreasing to 27.9 kg/m2 among those aged 75 and over. Patterns of mean BMI by age did not differ significantly between men and women, however, the mean BMI of women aged 16-24 (25.9 kg/m2) was significantly higher than men aged 16-24 (23.9 kg/m2). Figures 6C & 6D, Table 6.6
Percentage of adults overweight including obese ( BMI of 25 kg/m² or over), 2019, by age and sex
Adult mean BMI, 2019, by age and sex
6.3.7 Proportion of children with BMI within the healthy range, at risk of overweight and at risk of obesity, 1998 to 2019
The proportion of healthy weight children (BMI above the 2nd percentile or below the 85th percentile) has remained relatively stable since the beginning of the time series in 1998, with the lowest prevalence occurring in 2011 (65%) and a range of 68 - 72% recorded since 2012. The proportion of healthy-weight children was 68% in 2019.
Since 1998, the pattern in healthy weight prevalence over time has differed for boys and girls. Since the beginning of the time series, there have been relatively large fluctuations in the proportion of boys within the healthy weight range (61 -75%). Conversely, the proportion of girls within the healthy weight range has remained relatively stable since the beginning of the time series (68 - 72%; 2014 was an exception at 65%).
The proportion of children at risk of overweight (including obesity, BMI at or above 85th percentile) has been somewhat more variable over the time series, in the range 26 – 33%, with the 2019 rate of 30% towards the middle of this range.
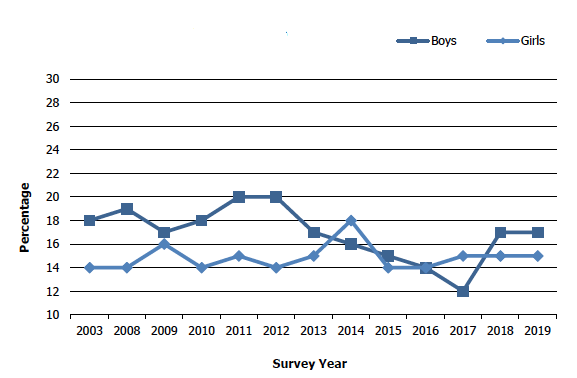
The prevalence of children at risk of obesity (BMI at or above 95th percentile) was 16% in 2019, continuing the relatively stable proportion observed since 1998 (13 - 17%). Between 2003 and 2012, a significantly higher risk of obesity was recorded for boys (17 - 20%) compared with girls (14 - 16%). However, since 2013, at risk of obesity prevalence for boys and girls has been at similar levels (17% for boys and 15% for girls in 2019). Figure 6E, Table 6.7
Percentage of children at risk of obesity, 2003 to 2019, by age and sex
6.3.8 Children's BMI, 2019, by age and sex
In 2019, there was no significant difference in the proportion of boys and girls in the healthy weight range (66% of boys and 70% of girls). There were significant differences, however, by age. Of those aged 2-6, 68% were in the healthy weight range, a figure which rose to 73% for those aged 7-11 before falling sharply to 62% for those aged 12-15. This pattern was evident for both boys and girls. This is a shift from the pattern seen in previous years (2017[57] and 2018[58]), when the youngest age group were most likely to be in the healthy weight range, with a lower proportion among those aged 7-11 and a lower proportion again among those aged 12-15.
In 2019, the proportion of children at risk of overweight was the same for children aged 2-6 and aged 12-15 (16%). However, those aged 7-11 were significantly less likely to be at risk of overweight (11%), a pattern that was similar for both boys and girls.
In 2019, children aged 12-15 were more likely than younger children to be at risk of obesity (21% for those aged 12-15 compared with 14% for those aged 2-11). Similar patterns were found for boys and girls, but this was more pronounced among girls (22% among girls aged 12-15 compared with 11-13% for those aged 2-11) than boys (19% among boys aged 12-15 compared with 15-16% for those aged 2-11). Table 6.8
6.3.9 Health risk category associated with overweight and obesity based on BMI and waist circumference, 2018/2019 combined, by age and sex
To increase the sample size available, the detailed analysis of health risk category associated with overweight and obesity based on BMI and waist circumference, by age and sex, used data from the 2018 and 2019 surveys combined.
In 2018/2019, women were more likely than men to have at least an increased health risk based on their BMI and waist circumference (68% of women compared to 62% of men) indicating some convergence since 2016/17[59] (69% of women compared with 58% of men).
In 2018/2019, the prevalence of increased health risk rose with age for both men and women. Those aged 16-24 were least likely to be at increased risk or above (34% of men and 43% of women), whilst for men those aged 65-74 were most likely to be at increased health risk or above (80%) while for women, it was those aged 65 and over (80%).
Women were more likely than men to be categorised as 'high risk or above' in 2018/2019 (55% compared with 44% of men). This difference was most evident among the youngest adults; nearly four in ten (37%) women aged 16-24 were classified as 'high risk or above', compared with just one in ten (10%) men aged 16-24. For women, the proportions of those categorised as 'high risk or above' increased steadily by age group from 37% among those aged 16-24 to 69% of those aged 75 and over. The pattern by age for men was less clear, the proportions of those categorised as 'high risk or above' generally increased with age (from 10% among those aged 16-24 to 57% among those aged 65-74) and then decreased to 52% among those aged 75 and over. Table 6.9
6.3.10 Adult food insecurity, 2017 to 2019, by age and sex
Food insecurity levels in 2019 did not differ significantly from those reported in 2017 and 2018. In 2019, 9% of all adults reported that they had been worried they would run out of food at some time during the previous 12 months due to a lack of money or other resources (9% in 2018 and 8% in 2017).
The majority of these individuals, 6% of all adults in 2019, went on to say that they had actually eaten less than they should because of a lack of resources, again not significantly different from 2018 (6%) or 2017 (7%). In 2019, 4% of all adults said that they had run out of food during the previous 12 months due to a lack of resources, again not significantly different from 2018 (3%) or 2017 (4%). Levels of food insecurity did not differ between men and women.
As was seen in 2017 and 2018, food insecurity was more prevalent among younger adults than older adults (13% of those aged 16-44 were worried they would run out of food compared with 8% of those aged 45-64 and 2% of those aged 65 and over). Similar patterns were evident for those who said that they had eaten less than they should in the previous 12 months because of a lack of money or other resources (9% of those aged 16-44, 6% of those aged 45-64 and 1% of those aged 65 and over) and for those who said that they had run out of food during the previous 12 months for the same reason (6% of aged 16-44, 3% of aged 45-64 and 1% of aged 65+). Table 6.10
6.3.11 Adult food insecurity, 2018/2019 combined, by household type
To increase the sample size available, the detailed analysis of adult food insecurity by household type used data from the 2018 and 2019 surveys combined.
In 2018/2019 combined, there were some large differences in prevalence of adult food insecurity according to household type.
Nearly one in three (31%) single parents (sample largely single mothers)[60] reported that they had been worried they would run out of food in the previous 12 months due to a lack of money or other resources. This was a slight but not statistically significant increase from the one in four (25%) reported for 2017/18[61]. In 2018/2019, around 7 in 10 of the single parents who had been worried about running out of food (21% of all single parents) went on to say that they had eaten less than they should for the same reason and around half of those (12% of all single parents) said they had run out of food due to a lack of money or other resources.
Likewise, higher levels of food insecurity were seen among those aged under 65 living alone. One in five (20%) of those aged below 65 living alone were worried they would run out of food (23% of men and 17% of women). Eight in 10 of this cohort (or 16% of all adults aged under 65 living alone) had eaten less than they should, and seven in ten of those (or 11% of all single adults under 65) had run out of food for the above reason.
Although not as prevalent as for single adults and single parents, food insecurity was still evident among other household types. In 2019, among adult members of large families (two adults and three or more children, or three or more adults and at least one child) 13% had been worried about running out of food because of a lack of resources in the last 12 months. Similarly, 8% of adults in small adult households (comprising two adults under the age of 65 and no children), and 9% of adults in small family households (comprising two adults and one or two children) had been worried about running out of food.
Prevalence for having been worried about running out of food was a little lower, at 6%, for adults in large adult households (three or more adults and no one under the age of 16), but lowest of all for adults in single older adult households (one adult aged 65 or over) or in households with older smaller families (comprising two adults only, at least one of whom is aged 65 or over), both 2%.
Eating less food and running out of food followed the same pattern by household type as described above, albeit at lower levels. While 11% of single adults and 12% of single parents had run out of food because of a lack of money or other resources, 5% of adults in large families said that this was the case, as did 1-3% of adults in other household types. Table 6.11
Table List
Table 6.1 Adult fruit and vegetable consumption, 2003 to 2019, by sex
Table 6.2 Adult fruit and vegetable consumption, 2019, by age and sex
Table 6.3 Child fruit and vegetable consumption, 2008 to 2019, by sex
Table 6.4 Child fruit and vegetable consumption, 2019, by age and sex
Table 6.5 Mean adult BMI, prevalence of overweight and obesity, 2003 to 2019, by sex
Table 6.6 Adult BMI, 2019, by age and sex
Table 6.7 Proportion of children with BMI within the healthy range, at risk of overweight and at risk of obesity, 1998 to 2019
Table 6.8 Children's BMI, 2019, by age and sex
Table 6.9 Health risk category associated with overweight and obesity based on BMI and waist circumference, 2018/2019 combined, by age and sex
Table 6.10 Adult food insecurity, 2017 to 2019, by age and sex
Table 6.11 Adult food insecurity, 2018/2019 combined, by household type
The tables can be found on the main report page under supporting files: https://www.gov.scot/publications/scottish-health-survey-2019-volume-1-main-report/
References and notes
1. Editorial (2017). Life, Death and Disability in 2016. The Lancet; 390(10100): p1083-1464.
2. Moody A (2013). Chapter 10: Adult anthropometric measures, overweight and obesity. In: Craig R, Mindell J (eds). Health Survey for England 2012. Volume 1: Health, social care and lifestyles. Leeds: Health and Social Care Information Centre.
3. Abdelaal M, le Roux, C and Docherty, N (2017). Morbidity and mortality associated with obesity. Annals of Translational Medicine; 5(7): 101: p.1.
4. World Health Organisation (2018). Fact Sheet Obesity and Overweight. [Online]. Available from: www.who.int/mediacentre/factsheets/fs311/en/index.html
5. Food Standards Scotland. (2018). The Scottish Diet: It needs to change. [Online]. Available from: https://www.foodstandards.gov.scot/downloads/Situation_report_-_the_Scottish_diet_-_it_needs_to_change_-_2018_update_FINAL.pdf
6. Afshin, A, Sur, PJ, Fay, KA, et al. (2019). Health effects of dietary risks in 195 countries, 1990- 2017: a systematic analysis for the Global Burden of Disease Study 2017. The Lancet. 2 doi: 10.1016/S0140-6736(19)30041-8.
7. Floriana, S, Luppino, MD, Leonore, M, de Wit, MS, Paul, F, Bouvy, MD et al. (2010). Overweight, obesity and depression: A systematic review and meta-analysis of longitudinal studies. Arch Gen Psychiatry .229-220:)3(67;2010 .doi:10.1001/archgenpsychiatry.2010.2: Available from: https://www.ncbi.nlm.nih.gov/pubmed/20194822
8. Gatineau, M, Dent, M (2011). Obesity and mental health. National Obesity Observatory. SCIE Social Care [Online]. Available from: https://www.scie-socialcareonline.org.uk/obesity-and-mentalhealth/r/a11G00000017trJIAQ
9. Rivenes, AC, Harvey, SB, Mykletun, A (2009). The relationship between abnormal fat, obesity and common mental disorders: Results from the HUNT study. Journal of Psychosomatic Research, 66(4): 269-275: https://www.ncbi.nlm.nih.gov/pubmed/19302883
10. Anstey, KJ, Cherbuin, N, Budge, M, and Young, J (2011). Body mass index in midlife and late-life as a risk factor for dementia: a meta-analysis of prospective studies. Obesity Reviews; 12(5): 426-37. Available from: https://www.ncbi.nlm.nih.gov/pubmed/21348917
11. Xu, WL, Atti, AR, Gatz, M, Pedersen, NL, Johansson, B, and Fratiglioni, L. Midlife overweight and obesity increase late-life dementia risk: a population-based twin study. Neurology; 76(18): 1568-74. Available from: https://www.ncbi.nlm.nih.gov/pubmed/21536637
12. Loef, M and Walach, H. Midlife obesity and dementia: meta-analysis and adjusted forecast of dementia prevalence in the United States and China. Obesity; 21(1): 51-5. Available from: https://www.ncbi.nlm.nih.gov/pubmed/23401370
13. Johnson, W, Li, L, Kuh, D, Hardy, R (2015) How Has the Age-Related Process of Overweight or Obesity Development Changed over Time? Coordinated Analyses of Individual Participant Data from Five United Kingdom Birth Cohorts. PLoS Med 12(5).
14. Ritchie, H & Roser, M. (2020) Obesity [Online]. Available from: https://ourworldindata.org/obesity
15. World Health Organisation (2020). Fact Sheet: Obesity and Overweight. [Online]. Available from: https://www.who.int/news-room/fact-sheets/detail/obesity-and-overweight
16. Food Standards Scotland. (2018). The Scottish Diet: It needs to change. [Online]. Available from: https://www.foodstandards.gov.scot/downloads/Situation_report_-_the_Scottish_diet_-_it_needs_to_change_-_2018_update_FINAL.pdf
17. World Cancer Research Fund/American Institute for Cancer Research (2018). Diet, Nutrition and Physical Activity and Cancer: a Global Perspective. [Online]. Available from: https://www.wcrf.org/sites/default/files/Summary-of-Third-Expert-Report-2018.pdf
18. Iqbal, R, Anand, S, Ounpuu, S, Islam, S, Zhang, X, Rangarajan, S et al. (2008). Dietary patterns and the risk of acute myocardial infarction in 52 countries: results of the INTERHEART study. Circulation; 118:1929-37.
19. World Cancer Research Fund/American Institute for Cancer Research (2018). Diet, nutrition, physical activity and cancer: a global perspective. Continuous Update Project Expert Report. Food, Nutrition and Physical Activity and the Prevention of Cancer: a Global Perspective. [Online]. Available from: http://www.wcrf.org/dietandcancer
20. World Cancer Research Fund/American Institute for Cancer Research (2018). Diet, nutrition, physical activity and cancer: a global perspective. Continuous Update Project Expert Report. Food, Nutrition and Physical Activity and the Prevention of Cancer: a Global Perspective. [Online]. Available from: http://www.wcrf.org/dietandcancer
21. Candari, C.J., Cylus, J., Nolte, E., (2017) Assessing the economic costs of unhealthy diets and low physical activity. European Observatory on Health Systems and Policies, Health Policy Series 37. Available from:
http://www.euro.who.int/__data/assets/pdf_file/0004/342166/Unhealthy-Diets-ePDF-v1.pdf
22. Scarborough, P, Bhatnagar, P, Wickramasinghe, KK, Allender, S, Foster, C and Rayner, M (2011). The economic burden of ill health due to diet, physical inactivity, smoking, alcohol and obesity in the UK: an update to 2006–07 NHS costs. J Public Health; 33:527-535.
23. SPICe Briefing – Obesity in Scotland. January 2015. Edinburgh: Scottish Parliament, 2015. Available from: www.scottish.parliament.uk/ResearchBriefingsAndFactSheets/S4/SB_15-01_Obesity_in_Scotland.pdf
24. World Health Organisation. World Obesity Day: Understanding the social consequences of obesity. [Online]. Available from: http://www.euro.who.int/en/health-topics/noncommunicable-diseases/mental-health/news/news/2017/10/world-obesity-day-understanding-the-social-consequences-of-obesity
25. A Healthier Future: Scotland's Diet & Healthy Weight Delivery Plan, Edinburgh: Scottish Government, 2018. Available from: http://www.gov.scot/Publications/2018/07/8833
26. Revised Dietary Goals for Scotland, Edinburgh: Scottish Government, 2013. Available from: https://www.gov.scot/publications/scottish-dietary-goals-march-2016/
27. Public Health Scotland (2020). Scotland's Public Health Priorities: Eat well, have a healthy weight and are physically active. [Online]. Available from: https://publichealthscotland.scot/our-areas-of-work/improving-our-health-and-wellbeing/scotlands-public-health-priorities/eat-well-have-a-healthy-weight-and-are-physically-active/
28. See: http://nationalperformance.gov.scot/
29. Dignity: Ending Hunger Together in Scotland - The Report of the Independent Working Group on Food Poverty. Edinburgh: Scottish Government (2016). Available from: http://www.gov.scot/Publications/2016/06/8020
30. Keith, SW, Fontaine, KR, Pajewski, NM, Metha,, T and Allison, D (2011). Use of self-reported height and weight biases the body mass index-mortality association. International Journal of Obesity; 35:401‑8.
31. Merrill, RM and Richardson, JS (2009). Validity of Self-Reported Height, Weight and Body Mass Index: Findings from the National Health and Nutrition Examination Survey, 2001-2006. Preventing Chronic Disease; 6(4): 61-10.
32. The Frankfort Plane is an imaginary line passing through the external ear canal and across the top of the lower bone of the eye socket, immediately under the eye. Participants' heads are positioned with the Frankfort Plane in a horizontal position when height is measured using a stadiometer as a means of ensuring that, as far as possible, the measurements taken are standardised.
33. These cut-offs differ to those used in the previous surveys. In 1995 and 1998 the normal weight range was defined as 20-25 kg/m2, in 2003 it was changed to 18.5-25 kg/m2. From 2008 onwards the ranges are defined as set out below. This brings the definition in line with WHO recommendations. The impact of the change of definition is very marginal as very few people have a BMI measurement that is exactly 18.5, 25, 30 or 40 kg/m2.
| 2003 | 2008 onwards | |
|---|---|---|
| Underweight | 18.5 or under | Less than 18.5 |
| Normal weight | Over 18.5 – 25 | 18.5 to less than 25 |
| Overweight | Over 25 – 30 | 25 to less than 30 |
| Obese | Over 30 – 40 | 30 to less than 40 |
| Morbidly obese | Over 40 | 40+ |
34. Bellizzi, MC and Dietz, WH (1999). Workshop on childhood obesity: summary of the discussion. American Journal of Clinical Nutrition; 70: 173-175.
35. Daniels, SR, Khoury, PR and Morrison, JA (1997). The utility of body mass index as a measure of body fatness in children and adolescents: Differences by race and gender. Pediatrics: 99: 804-807.
36. Cole, T, Freeman, JV and Preece, MA (1990). Body mass index reference curves for the UK. Archives of Disease in Childhood; 73: 25-29.
37. Cole, T, Freeman, JV and Preece, MA (1998). British 1990 growth reference centiles for weight, height, body mass index and head circumference fitted by maximum penalised likelihood. Statistics in Medicine; 17: 407-429.
38. Reilly, JJ (2002). Assessment of childhood obesity: National reference data or international approach? Obesity Research; 10: 838-840.
39. Reilly, JJ, Wilson, ML, Summerbell, CD, and Wilson, DC (2002). Obesity: diagnosis, prevention, and treatment; evidence based answers to common questions. Archives of Disease in Childhood; 86: 392-395.
40. SIGN (2010). Scottish Intercollegiate Guidelines Network Management of Obesity – A National Clinical Guideline. SIGN guideline no. 115. [Online]. Available from: http://www.sign.ac.uk/assets/sign115.pdf
41. Jotangia, D, Moody, A, Stamatakis, E and Wardle, H (2005). Obesity Among Children Under 11. London: Department of Health in collaboration with the Health and Social Care Information Centre. Available from: http://dera.ioe.ac.uk/5841/1/dh_065358.pdf
42. Reilly, J, Dorosty, A, and Emmett, P (1999). Prevalence of overweight and obesity in British children: cohort study. British Medical Journal; 319: 1039.
43. Bundred, P, Kitciner, D and Buchan, I (2001). Prevalence of overweight and obese children between 1989 and 1998: population based series of cross sectional studies. British Medical Journal; 322: 1-4.
44. Rudolf, MCJ, Sahota, P, Barth, JH, and Walker, J (2001). Increasing prevalence of obesity in primary school children: cohort study. British Medical Journal; 322: 1094-1095.
45. This method has been developed by Public Health Scotland, full details of the procedure are available on request from the Scottish Government Scottish Health Survey Team.
46. See: https://nationalperformance.gov.scot/measuring-progress/national-indicator-performance
47. Romero-Corral, A. et al (2008). Accuracy of body mass index in diagnosing obesity in the adult general population. International Journal of Obesity 32: 959–966.
48. Moody A. Adult anthropometric measures, overweight and obesity. Chapter 10 in Craig R, Mindell J (eds). Health Survey for England 2012. Volume 1: Health, social care and lifestyles. Health and Social Care Information Centre, Leeds, 2013.
49. Lean M, Han T, Morrison C. Waist circumference as a measure for indicating need for weight management. BMJ 1995; 311:158-61.
50. Schneider HJ, Friedrich N, Klotsche J et al. The predictive value of different measures of obesity for incident cardiovascular events and mortality. The Journal of Clinical Endocrinology & Metabolism 201; 95(4):1777-1785.
51. National Institutes of Health. Third report of the National Cholesterol Education Program Expert Panel on Detection, Evaluation and Treatment of High Blood Cholesterol in Adults (Adult Treatment Panel III). Bethesda, Md: National Institutes of Health 2001. NIH Publication 01-3670.
52. A high waist circumference of 94 cm for men is equivalent to one of 94.6 cm following the interviewer protocol. A very high waist circumference of 102 cm is equivalent to one of 102.75 cm. A high waist circumference of 80 cm for women is equivalent to one of 82.4 cm following the interviewer protocol. A very high waist circumference of 88 cm is equivalent to one of 91.35 cm.
53. Flegal KM. Waist circumference of healthy men and women in the United States. Int J Obes. 2007;31:1134-9.
54. Scottish Intercollegiate Guidelines Network Management of Obesity – A National Clinical Guideline. SIGN guideline no. 115. Edinburgh: SIGN, 2010. www.sign.ac.uk/guidelines/fulltext/115/index.html
55. Scottish Intercollegiate Guidelines Network Management of Obesity – A National Clinical Guideline. SIGN guideline no. 115. Edinburgh: SIGN, 2010. www.sign.ac.uk/guidelines/fulltext/115/index.html
56. Scottish Intercollegiate Guidelines Network Management of Obesity – A National Clinical Guideline. SIGN guideline no. 115. Edinburgh: SIGN, 2010. www.sign.ac.uk/guidelines/fulltext/115/index.html
57. Bardsley, D. (2017). Chapter 8: Obesity. McLean, J., Dean, L. (eds). The Scottish Health Survey 2017 edition: volume 1: main report. Edinburgh: Scottish Government. Available from: https://www.gov.scot/publications/scottish-health-survey-2017-volume-1-main-report/pages/6/
58. Dougall, I. (2018). Chapter 7: Obesity. McLean, J. Dean, L. (eds). The Scottish Health Survey – 2017 edition: volume 1: main report. Edinburgh: Scottish Government. Available from: https://www.gov.scot/publications/scottish-health-survey-2018-volume-1-main-report/
59. Bardsley, D. (2017). Chapter 8: Obesity. McLean, J., Dean, L. (eds). The Scottish Health Survey – 2017 edition: volume 1: main report. Edinburgh: Scottish Government. Available from: https://www.gov.scot/publications/scottish-health-survey-2017-volume-1-main-report/pages/6/
60. Please note that the sample for single parents was largely women, with a very small sample of single parents interviewed who were men (n=19)
61. Hinchliffe, S. (2018). Chapter 5: Diet. McLean, J. Dean, L. (eds). The Scottish Health Survey – 2017 edition: volume 1: main report. Edinburgh: Scottish Government. Available from: https://www.gov.scot/publications/scottish-health-survey-2018-volume-1-main-report/