Scottish Health Survey 2019 - volume 1: main report
Presents results for the Scottish Health Survey 2019, providing information on the health and factors relating to health of people living in Scotland.
Chapter 7: Physical Activity
Men were more likely than women to meet the moderate or vigorous physical activity guidelines (MVPA)* in 2019.
- All adults 66%
- Men 71%
- Women 61%
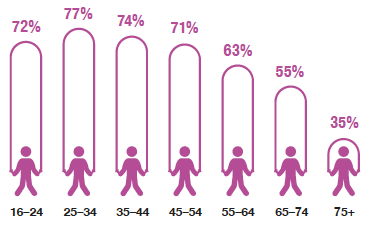
In 2019, the proportion of adults meeting the MVPA guidelines declined with age.
Men were more likely than women to have met:
MVPA as well as muscle strengthening guidelines**
- 31% Men
- 27% Woman
MVPA guidelines only
- 40% Men
- 34% Woman
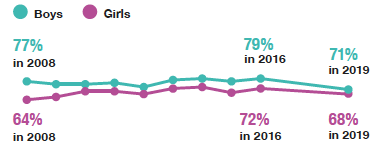
In 2019, the proportion of children (aged 2–15) who met the recommended physical activity level*** over the last seven days, was the lowest in the time series.
- 71% in 2008
- 76% in 2016
- 69% in 2019
This decrease appears to be driven by a drop in activity levels among boys with no significant decrease recorded for girls.
Proportion of children (2–15) meeting the physical activity guidelines
- 66% of all children participated in any sport in the week prior to the interview in 2019
Participation in sports varied by age.
* at least 150 minutes of moderate physical activity, 75 minutes of vigorous physical activity, or an equivalent combination of the two per week.
** muscle strengthening activity on two or more days a week.
*** an average of at least 60 minutes of activity per day in previous week. Although the recommendation applies to children aged five and over, the figures relate to those aged 2-15 for consistency with figures reported in previous years. Data is not presented for 2017 and 2018 due to differences in the way the data was collected for these years.
In 2019, adults' sedentary leisure time was significantly higher at weekends than on weekdays.
- 5.4 hours per day on weekdays
- 6.2 hours per day at weekends
On average, children spent more time on sedentary leisure activities at weekends than they did on weekdays.
- 3.6 hours per day on weekdays
- 4.9 hours per day at weekends
On both weekdays and weekends, the amount of time spent on sedentary activities varied for boys by physical activity levels but not for girls.
Mean hours sedentary leisure time
In 2019, adults who met the MVPA physical activity guidelines had a higher mental wellbeing (measured by WEMWBS) mean score than those who did not.
- 50.9 for those who met the MVPA physical activity guidelines
- 47.6 for those who did not meet the MVPA physical activity guidelines
Mean WEMWBS scores generally increased with age among adults meeting the MVPA guidelines.
7 Physical Activity
7.1 Introduction
Physical activity and sport are a powerful force in transforming lives. There is clear and growing evidence of the health, economic and social benefits physical activity and sport can bring. Physical activity and sport improve the health of the heart, skeletal muscles, bones and blood, the immune system and nervous system; and enable people to live longer, healthier lives. Being active improves psychological wellbeing, boosts self-esteem, plays an important role in maintaining a healthy weight and improves mood and sleep quality. The early years is a vitally important period to intervene to improve outcomes for children. There is strong evidence that intervention in this period, including through play, improves health and cognitive development[1].
Physical activity and sport can also play a major role in improving outcomes and tackling inequalities across many different aspects of our lives and society. Positive changes being achieved through physical activity and sport initiatives in Scotland include improving mental health, supporting weight management initiatives, overcoming loneliness and isolation; reducing reoffending; promoting sustainable forms of transport; and enabling people to connect with the natural environment[2].
The latest Physical Activity Guidelines were published on the 7th September 2019[3] following approval from the four Chief Medical Officers (CMOs) of England, Scotland, Wales and Northern Ireland. They drew on global evidence for the health benefits people can achieve by taking regular physical activity throughout their lives and are summarised in Table 7A. These guidelines updated those published in 2011 which included recommendations on duration, frequency and type of physical activity required to achieve general health benefits for different age ranges.
| Age group | Guidelines |
|---|---|
| Early years – children under 5 years | Infants (less than 1 year): Physical activity is recommended several times a day (the more activity the better) in a variety of ways including interactive floor-based activity, e.g. crawling. Where infants are not yet mobile, at least 30 minutes of tummy time spread across the day and while awake is recommended along with movements such as reaching and grasping, pushing and pulling themselves over independently, or rolling over; more is better. Toddlers (1-2 years): At least 180 minutes (3 hours) of physical activity of any intensity is recommended for toddlers, including active and outdoor play. Pre-schoolers (3-4 years): At least 180 minutes (3 hours) of activity is also recommended for pre-school aged children, including a variety of active and outdoor play physical activities spread throughout the day. For this age group, this should include at least 60 minutes of moderate-to-vigorous intensity physical activity. |
| Children and young people aged 5 to 18 | It is recommended that children and young people in this age group engage in moderate-to-vigorous intensity physical activity for an average of at least 60 minutes per day. The activities undertaken include those undertaken in a variety of settings such as school-based physical education, active travel, after school activities, play and sporting activities. Engagement in a range of activities and intensities over the course of a week is recommended in order to develop movement skills, muscular fitness and bone strength, This activity should be accompanied by as minimal an amount of sedentary time as possible, with any long periods of inactivity broken up with some physical activity, even if this is light in nature. |
| Adults aged 19-64 | Daily physical activity is recommended for both physical and mental health benefits - the more the better but any activity is encouraged. This includes activities to develop and strengthen the major muscle groups, which can be achieved through activities such as heavy gardening, carrying heavy shopping, or resistance exercise. It is recommended that muscle strengthening activities are done on at least two days a week, but any strengthening activity is better than none. On a weekly basis, adults should undertake:
|
| Adults aged 65 and over | Daily physical activity is also recommended for older adults for the maintenance of good physical and mental health, wellbeing, and social functioning. Even light activity offers greater health benefits than being sedentary, although the more daily physical activity that is undertaken, the better. Older adults should also undertake activities aimed at improving or maintaining muscle strength, balance and flexibility on at least two days a week, either on their own or combined with moderate aerobic activity. This should be accompanied by 150 minutes (two and a half hours) of moderate intensity aerobic activity, building gradually up to this where activity levels are currently lower. Those who are already regularly active can achieve these benefits through:
|
7.1.1 Policy background
Physical activity, in conjunction with eating well and maintaining a healthy weight, is one of the six Public Health Priorities for Scotland published jointly by the Scottish Government and COSLA in 2018 with the aim of enabling everyone in Scotland to thrive and be as healthy as they possibly can be[4].
Scotland was one of the first countries to publish a national action plan following the World Health Organisation's global plan on physical activity. The Active Scotland Delivery Plan, also published in 2018, is one of five linked strategies and delivery plans which support these Public Health priorities. Taken together, the priorities and action plan aim to create a healthy environment whilst encouraging individuals to make good choices about their health, their life and their communities. This includes addressing the inequalities that exist in access to opportunities and barriers to participation in physical activity and its associated health benefits[5].
The Active Scotland Delivery Plan also aims to cut physical inactivity in adults and teenagers by 15% by 2030 using wide-ranging approaches including active travel funding and support for both formal sports and informal physical activity[6]. The Active Travel Framework sets out key policy approaches aimed at increasing levels of active travel (walking or cycling for travel) in Scotland, not only for the environmental and economic benefits, as well as access to facilities and amenities, but also with the aim of improving the health of individuals[7].
The Active Scotland Delivery Plan[8] also contains 90 actions including development of community sports hubs in the most deprived areas in Scotland, more opportunities for pupils to participate in sport before, during and after school, support and development to help the transition from school sport to clubs, increased funding for cycle and walking paths, the promotion of good practice to ensure children have safe places to play and addressing barriers to participation amongst women and girls. The plan also includes a commitment to partnership working across the transport, education, health and planning sectors and is supported by Let's Get Scotland Walking – The National Walking Strategy[9] and the Cycling Action Plan for Scotland 2017/2020[10].
7.1.2 Reporting on physical activity in the Scottish Health Survey (SHeS)
Physical activity is recognised as a key contributor to the new National Performance Framework outcome that 'we are healthy and active'. SHeS data is used to monitor the percentage of adults meeting physical activity recommendations which is one of the indicators used to gauge progress on the overall outcome[11].
In this report, figures are presented on adherence to the adult and child physical activity guidelines that covered the periods between 2011 and 2019. Adult adherence to guidelines on moderate/vigorous physical activity (MVPA) and muscle strengthening are presented. Trend data for child physical activity, including and excluding school-based activities, are also shown with exception of 2017 and 2018 due to an alternative data collection approach which means that the data is not comparable[12]. Children's participation in sport is also presented. Levels of adult and child sedentary time and WEMWBS mental wellbeing scores are presented by summary activity levels for adults and children.
Supplementary tables on physical activity are available on the Scottish Government website[13].
7.2 Methods and Definitions
7.2.1 Adult physical activity questionnaire
The SHeS questionnaire[14] asks about four main types of physical activity:
- home-based activities (housework, gardening, building work and DIY)
- walking
- sports and exercise
- activity at work.
Information is collected on the:
- time spent being active
- intensity of the activities undertaken
- frequency with which activities are performed.
7.2.2 Adherence to adult physical activity guidelines
The activity guidelines at the time of the SHeS 2019 question approval advised adults to accumulate 150 minutes of moderate activity or 75 minutes of vigorous activity per week or an equivalent combination of both, in bouts of 10 minutes or more. These guidelines are referred to throughout this chapter as the MVPA guidelines (Moderate or Vigorous Physical Activity). To help assess adherence to this guideline, the intensity level of activities mentioned by participants was estimated.
Activities of low intensity, and activities of less than 10 minutes duration, were not included in the assessment. This allowed the calculation of a measure of whether each SHeS participant adhered to the guideline, referred to in the text and tables as "adult summary activity levels", see Table 7B. A more detailed discussion of this calculation is provided in the 2012 report[15].
| Meets MVPA guidelines | Reported 150 mins/week of moderate physical activity, 75 mins vigorous physical activity, or an equivalent combination of these. |
|---|---|
| Some activity | Reported 60-149 mins/week of moderate physical activity, 30-74 mins/week vigorous physical activity, or an equivalent combination of these. |
| Low activity | Reported 30-59 mins/week of moderate physical activity, 15-29 mins/week vigorous physical activity or an equivalent combination of these. |
| Very low activity | Reported less than 30 mins/week of moderate physical activity, less than 15 mins/week vigorous physical activity, or an equivalent combination of these. |
a Only bouts of 10 minutes or more were included towards the 150 minutes per week guideline
To avoid overcomplicating the text, where descriptions are provided of the summary activity levels, they tend to refer only to moderate physical activity, although the calculations were based on moderate or vigorous activity as described above.
A second summary measure was calculated for adults, in respect of meeting the guidelines to carry out activities that strengthen muscles on at least 2 days a week to increase bone strength and muscular fitness. Nine different sports were classed as always muscle strengthening, and other sports or exercises were classed as muscle strengthening if the participant reported that the effort was enough to make the muscles feel some tension, shake or feel warm. If the participant carried out such activities for at least 10 minutes on 2 or more days a week, on average, they were deemed to meet the muscle strengthening guideline. As this only includes muscle strengthening through sporting activity, reported levels may be an underestimate.
7.2.3 Child physical activity questionnaire
The questions on child physical activity are slightly less detailed than those for adults[16]. No information on intensity is collected (with the exception of asking those aged 13-15 about their walking pace). The questions cover:
- sports and exercise
- active play including housework and gardening
- walking
7.2.4 Sedentary activity
Since 2003, all participants aged 2 and over have been asked about time spent in front of a screen (e.g. a TV or tablet) during leisure time on both weekdays and weekend days. For everyone aged 2 and over, questions about time spent sitting during leisure time (apart from in front of a screen) were added in 2012. The examples of time spent sitting that participants were given included eating, reading, studying and (for children) doing homework. For adults in paid work, new questions on time spent sitting during the working day were also added in 2012.
7.2.5 Warwick-Edinburgh Mental Wellbeing Scale (WEMWBS)
Wellbeing is measured using the WEMWBS questionnaire. It has 14 items designed to assess: positive affect (optimism, cheerfulness, relaxation) and satisfying interpersonal relationships and positive functioning (energy, clear thinking, self-acceptance, personal development, mastery and autonomy)[17]. The scale uses positively worded statements with a five-item scale ranging from '1 - none of the time' to '5 - all of the time'. The lowest score possible is therefore 14 and the highest score possible is 70; the tables present mean scores.
7.3 Physical Activity
7.3.1 Adult summary activity levels, 2019, by age and sex
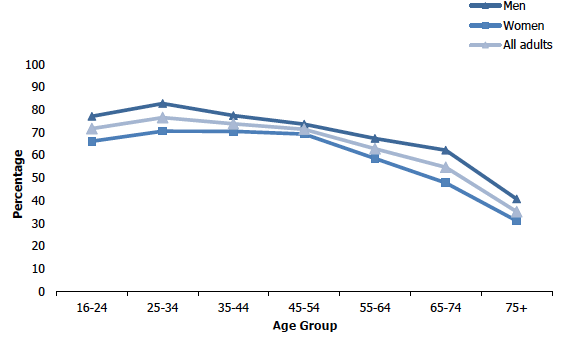
In 2019, around two-thirds (66%) of adults met the guidelines for moderate or vigorous physical activity (MVPA) of at least 150 minutes of moderate physical activity, 75 minutes of vigorous physical activity, or an equivalent combination of the two per week. The proportion that met the MVPA guidelines in 2019 remained the same as that reported in SHeS 2018[18] (66%) and was very similar to the proportion reported in SHeS 2017[19] (65%). Smaller proportions of all adults in 2019 reported undertaking some physical activity (11%), low levels (3%) or very low levels (20%) of physical activity.
Younger adults were more likely than older adults to meet the MVPA guidelines (71 - 77% among those aged 16-54, compared with 63% among those aged 55-64, 55% among those aged 65-74 and 35% among those aged 75 and over).
Adult adherence to MVPA guidelinesa, 2019, by age and sex
a Meets moderate / vigorous physical activity guidelines of 150 minutes of moderate physical activity, 75 minutes of vigorous physical activity, or an equivalent combination of these each week
As in previous years, in 2019 a significantly higher proportion of men met the MVPA guidelines for physical activity than women (71% compared with 61% respectively). Figure 7A, Table 7.1
7.3.2 Proportion of adults engaging in muscle strengthening physical activity, 2019, by age and sex
In 2019 just under four in ten adults who participated in any physical activity met the moderate or vigorous physical activity (MVPA) recommendation only (37%) while around three in ten met the MVPA recommendation as well as the muscle strengthening activity recommendation (29%). Just over three in ten met neither of these recommendations (34%) and a very small proportion met the muscle strengthening recommendation only (1%).
Men were more likely to have met the MVPA as well as the muscle strengthening recommendations (31%) compared with women (27%) and were more likely to have met the MVPA recommendation only (40% and 34% respectively). Around four in ten women met neither of these recommendations (39%) compared with just under three in ten men (28%).
Amongst all adults taking part in any physical activity, those aged 16-24 were most likely to have met both the MVPA and muscle strengthening recommendations (43%) while those aged 75 and over were least likely to have done so (8%).
A different pattern by age was evident for meeting MVPA guidelines only. The highest proportions of all adults meeting this guideline only in 2019 were among those aged 25-74 (37- 41%) with significantly lower proportions having met this guideline among those aged 16-24 (28%) and those aged 75 and over (27%).
Proportion of adults engaging in muscle strengthening physical activity, 2019, by sex
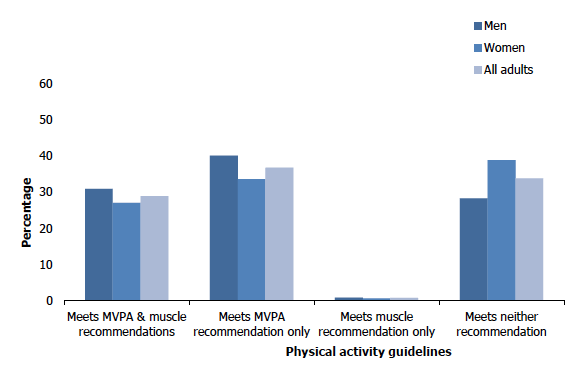
In 2019, almost two-thirds of all adults aged 75 and over reported meeting neither the MVPA or muscle strengthening guidelines (64%) compared with 23 - 28% of those aged 16-54. Figure 7B, Table 7.2
7.3.3 Proportion of children meeting physical activity guidelines over an average week (including and excluding activity at school), 1998 to 2019
Information on children's physical activity has been collected in SHeS since 1998 and physical activity carried out while at school has been collected since 2008. Although the recommendation to engage in moderate-to-vigorous intensity physical activity for an average of at least 60 minutes per day applies to children aged five and over, the analysis in this section relates to those aged 2-15 for consistency with figures reported in previous years. The proportions of children aged 2-15 meeting the guidelines[20], including and excluding activity at school, from 1998 to 2019[21] are presented in Table 7.3.
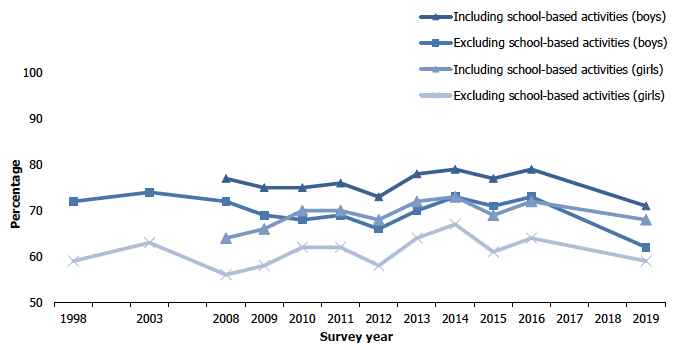
In 2019, just over two-thirds (69%) of children aged 2-15 were physically active at the recommended level (including activity at school), a significant decrease compared with SHeS 2016 (76%) and the lowest in the time series with figures previously fluctuating between 70% and 76%. The decrease recorded in 2019 appears to be driven by activity levels among boys, for whom the proportion meeting the physical activity guidelines, including school-based activity, was 71% (79% in 2016). The decrease recorded for girls between 2016 and 2019 (72% and 68% respectively) was not significant. The proportion of boys meeting this guideline has been higher than for girls across the time series (71 - 79% for boys, 64 - 73% for girls).
When school-based physical activities were excluded, a similar decrease was recorded from 2016; the 2019 figure for all children (61%) was seven percentage points lower than that recorded in 2016 (68%) and the lowest recorded since 1998. Again, a significant difference between 2016 and 2019 was recorded for boys, with an eleven percentage point decrease (73% in 2016 compared with 62% in 2019). The decrease in the proportion of girls that met the physical activity guidelines between 2016 (64%) and 2019 (59%) was not statistically significant.
The proportion of girls meeting this guideline has been lower than for boys across the time series (56 - 67% for girls, 62 - 74% for boys). Figure 7C, Table 7.3
Proportion of children meeting physical activity guidelines including and excluding school-based activities, 1998 to 2019, by sex
7.3.4 Child summary activity levels, 2019, by age and sex
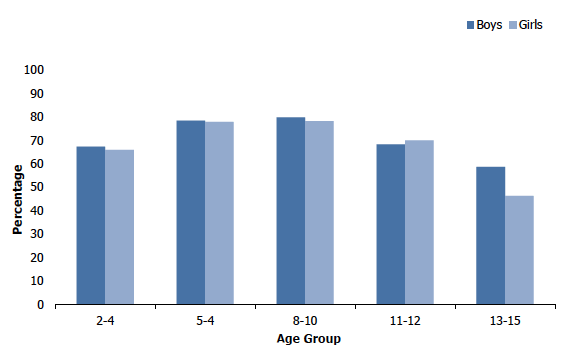
In 2019, just over two-thirds (69%) of children met the recommended physical activity level of an average of 60 minutes each day over the last seven days (including activity at school), with similar levels recorded for girls (68%) and boys (71%).
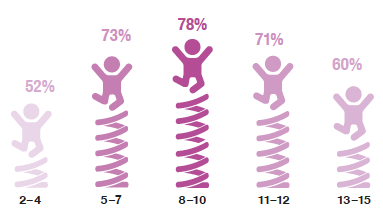
Physical activity levels amongst children varied significantly by age in 2019, with the highest proportions that met the physical activity guidelines recorded among children aged 8-10 (79%) and 5-7 (78%). Amongst all children, the largest increase in proportions meeting the physical activity guidelines was recorded between the 2-4 and 5-7 age groups (67% up to 78%), while the largest decrease was recorded between those aged 11-12 and those aged 13-15 (69% down to 53%).
Percentage of children meeting the physical activity guidelinesb, 2019, by age and sex
b an average of at least 60 minutes every day of the week (including school-based activity)
Amongst all children, 13% had taken part in low levels of physical activity in the previous seven days with older children more likely to do so than younger (21% amongst those aged 13-15 compared to 8-9% amongst children aged 5-10). Figure 7D, Table 7.4
7.3.5 Proportion of children participating in sport, 2019, by age and sex
In 2019, two-thirds of all children aged 2-15 had participated in any sport in the week prior to interview (66%). There were no significant variations by sex with similar proportions reported for boys (67%) and girls (66%). Levels of participation in sport remained very similar to those last reported in 2017[22] where 67% of all children, 67% of boys and 66% of girls had participated in any sport in the last week.
Participation in sport varied by age in 2019 increasing from 52% of those aged 2-4 to 71 - 78% of those aged 5-12 before decreasing to 60% among those aged 13-15. Similar patterns were recorded for both boys and girls. Table 7.5
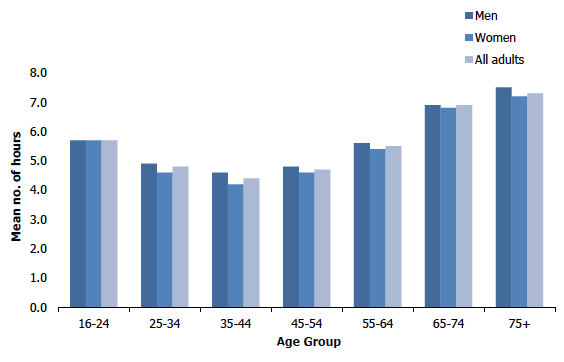
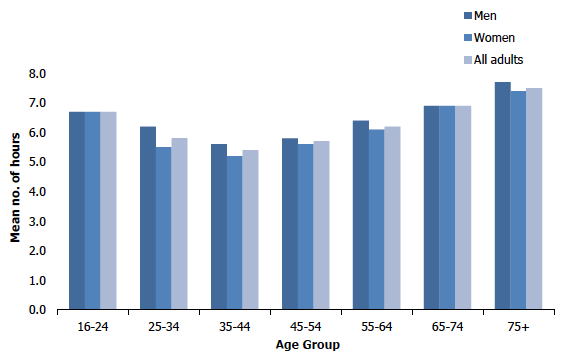
7.3.6 Adult sedentary time, 2019, by age and sex
In 2019, all adults recorded an average of 5.4 hours of sedentary leisure time per day on weekdays, with a significant increase to an average of 6.2 hours per day at weekends. Similar patterns were recorded for men and women.
The average time spent on sedentary leisure activities per week day varied significantly by age in 2019 with the lowest levels amongst those aged 25-54. Adults aged 25-54 reported an average of 4.4 - 4.8 hours of sedentary leisure time per weekday compared with 5.7 hours for those aged 16-24 and 5.5 - 7.3 hours among those aged 55 and over.
A similar pattern was recorded for weekends where the average amount of time spent on sedentary leisure activities was lowest among those aged 25-54 at between 5.4 - 5.8 hours compared with 6.7 hours among all adults aged 16-24 and 6.2 - 7.5 hours among those aged 55 and over.
Most age groups recorded an increase of between 0.7 and 1.0 hours in the average amount of time spent on sedentary activities per day at weekends compared with weekdays in 2019, with the exception of those aged 65 and over where the differences were minimal (0.0 - 0.2 hours). Similar patterns were recorded for men and women. Figures 7E & 7F, Table 7.6
Adults' sedentary time on weekdays, 2019, by age and sex
Adults' sedentary time on weekends, 2019, by age and sex
7.3.7 Children's sedentary time, 2019, by summary activity levels and sex
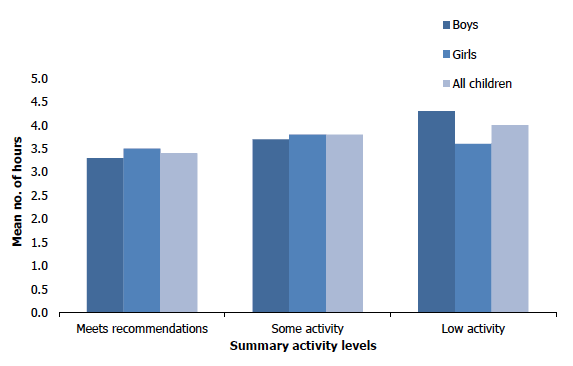
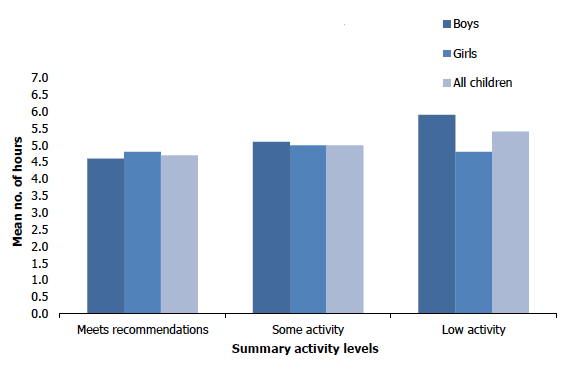
The average amount of time spent on sedentary leisure activities among all children in 2019 was significantly higher at weekends than on weekdays with an average of 4.9 hours of sedentary leisure activity per weekend day compared with an average of 3.6 hours on weekdays. Similar levels of average sedentary time were observed for boys and girls at the weekend and on weekdays, however patterns for sedentary time by physical activity level were different for boys and girls.
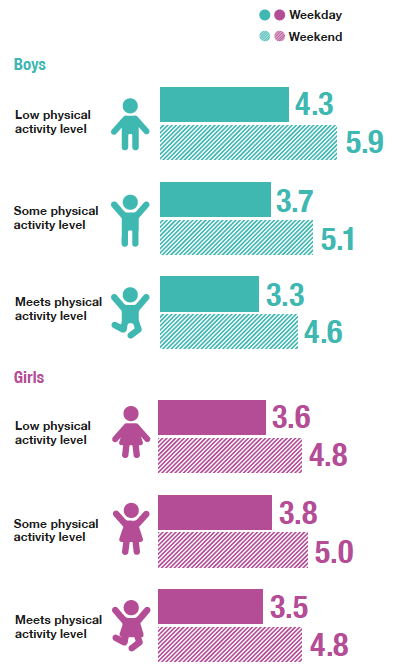
Children who met the physical activity recommendations spent less time on sedentary leisure activities on weekdays compared to children engaging in low levels of physical activity over the previous week (3.4 mean hours per day compared with 4.0 mean hours per day). This pattern was driven by boys. The average amount of time spent on sedentary leisure activities on weekdays was 3.3 hours among boys who met the physical activity recommendations compared with 4.3 hours among boys who undertook low levels of physical activity. For girls, the average amount of sedentary leisure time per weekday did not differ significantly by physical activity level.
Child sedentary leisure time on weekdays, 2019, by summary activity levels and sex
The average amount of time spent on sedentary leisure activities at weekends was also significantly associated with levels of physical activity. Children who met the physical activity recommendations recorded lower average hours of sedentary leisure activities per day at weekends than those who had engaged in low levels of activity (4.7 mean hours compared with 5.4 mean hours respectively).
A difference in the amount of time spent on sedentary leisure activities at weekends was also evident for boys by level of physical activity. In 2019, boys who met the physical activity recommendations spent an average of 4.6 hours undertaking sedentary leisure activities per day on weekends compared with 5.9 hours among those who undertook low levels of activity.
As with weekdays, this difference by physical activity level was not evident for girls where the average amount of sedentary leisure time per day was in the range 4.8 - 5.0 hours for all physical activity levels. Figures 7G & 7H, Table 7.7
Child sedentary leisure time on weekends, 2019, by summary activity levels and sex
7.3.8 Adult WEMWBS mean score, 2018/2019, by summary activity levels, age and sex
To increase the sample size available, the detailed analysis of adult WEMWBS mean scores, by age and sex, used data from the 2018 and 2019 surveys combined.
In 2018/2019, mental wellbeing (measured by WEMWBS mean score) was higher among adults who met the MVPA physical activity guidelines than those who did not (50.8 compared with 47.4 respectively).
Mean WEMWBS scores did not vary significantly between men and women in relation to physical activity levels in 2018/2019. However, significant differences were evident by age. Among adults meeting the MVPA guidelines, WEMWBS mean scores generally increased with age from 49.5 - 50.2 among those aged 16-44 to 52.8 - 53.2 among those aged 65 and over.
Among adults who did not meet the MVPA guidelines, WEMWBS scores varied with age but with no clear pattern; the highest mean WEMWBS score was still among those aged 65 and over but the lowest scores were among middle-aged adults (45.1 among those aged 45-54). Table 7.8
Table List
Table 7.1 Adult summary activity levels, 2019, by age and sex
Table 7.2 Proportion of adults engaging in muscle strengthening physical activity, 2019, by age and sex
Table 7.3 Proportion of children meeting physical activity guidelines over an average week (including and excluding activity at school), 1998 to 2019
Table 7.4 Child summary activity levels, 2019, by age and sex
Table 7.5 Proportion of children participating in sport, 2019, by age and sex
Table 7.6 Adult sedentary time by adult summary activity, 2019, by age and sex
Table 7.7 Children's sedentary time, 2019, by summary activity levels and sex
Table 7.8 Adult WEMWBS mean score, 2018/2019, by summary activity levels, age and sex
The tables can be found on the main report page under supporting files: https://www.gov.scot/publications/scottish-health-survey-2019-volume-1-main-report/
References and notes
2. See: https://www.gov.scot/publications/active-scotland-delivery-plan/
3. UK Chief Medical Officer' Physical Activity Guidelines (2019). Department of Health & Social Care, Welsh Government, Scottish Government & Northern Ireland Department of Health. [online]. Available from: https://assets.publishing.service.gov.uk/government/uploads/system/uploads/attachment_data/file/832868/uk-chief-medical-officers-physical-activity-guidelines.pdf
4. Public Health Priorities for Scotland (2018). COSLA and the Scottish Government. [online]. Available from: https://www.gov.scot/publications/scotlands-public-health-priorities/
5. See: https://www.gov.scot/publications/active-scotland-delivery-plan/
6. Active Travel Framework (2019). Glasgow: Transport Scotland. [online]. Available from: https://www.transport.gov.scot/media/47158/sct09190900361.pdf
7. See: https://www.gov.scot/publications/active-scotland-delivery-plan/
8. Active Travel Framework (2019). Glasgow: Transport Scotland. [online]. Available from: https://www.transport.gov.scot/media/47158/sct09190900361.pdf
9. Let's get Scotland Walking (2014). COSLA and the Scottish Government [online]. Available from: https://www.gov.scot/publications/lets-scotland-walking-national-walking-strategy/
10. Cycling Action Plan for Scotland 2017-2020 (2017). Glasgow: Transport Scotland [online]. Available from: https://www.transport.gov.scot/publication/cycling-action-plan-for-scotland-2017-2020/
11. See: http://nationalperformance.gov.scot/
12. The questions in the 2017 and 2018 surveys were changed to ask children which days (Monday to Sunday) in the previous week they had participated in each different type of physical activity. Prior to 2017 and again in 2019, children were asked to provide information on the average duration of sports and exercise activities for a typical weekday and typical weekend day. Due to these changes, it is not possible to compare the data for 2017 and 2018 with other survey years due to the impact on estimates of the changes in the way the data was collected.
13. See: https://www.gov.scot/collections/scottish-health-survey
14. The questions used in the survey since 1998 are based on the Allied Dunbar National Fitness Survey, a major study of physical activity among the adult population in England carried out in 1990. For further details see: Health Education Authority. Allied Dunbar National Fitness Survey. Health Education Authority and Sports Council, London. 1992
15. Bromley C. (2013) Chapter 6: Physical Activity. In Rutherford L, Hinchliffe S and Sharp C (eds.) Scottish Health Survey 2012 – Volume 1: Main Report. Edinburgh: Scottish Government. Available from: https://www.gov.scot/publications/scottish-health-survey-2012-volume-1-main-report/pages/10/
16. The questions on child physical activity included in SHeS since 1998 are based on the 1997 Health Survey for England (HSE) children's physical activity module.
17. Further information about WEMWBS is available from: http://www.healthscotland.scot/health-topics/mental-health-and-wellbeing/wemwbs
18. Mirani, K. (2018). Chapter 6: Physical Activity. McLean, J. Dean, L. (eds). The Scottish Health Survey – 2017 edition: volume 1: main report. Edinburgh: Scottish Government. Available from: https://www.gov.scot/publications/scottish-health-survey-2018-volume-1-main-report/
19. Dean, L. (2017). Chapter 7: Physical Activity. McLean, J., Christie, S., Hinchliffe, S.(eds). The Scottish Health Survey – 2017 edition: volume 1: main report. Edinburgh: Scottish Government. Available from: https://www.gov.scot/publications/scottish-health-survey-2017-volume-1-main-report/pages/86/
20. Up to and including 2016 and in 2019, children were asked to provide information on the average duration of sports and exercise activities for a typical day, and were not asked to differentiate between different weekday or weekend days or to provide a specific duration for each separate day. In this report, adherence to the physical activity guidelines is calculated using an average of at least 60 minutes per day.
21. Data is not presented here for 2017 and 2018 due to differences in the way the data was collected for these years which means that the estimates for these years are not comparable with previous SHeS surveys or the data collected in 2019. In addition, the UK Chief Medical Officer's Physical Activity Guidelines were in review at the time of the 2018 report.
22. Dean, L. (2017). Chapter 7: Physical Activity. McLean, J., Christie, S., Hinchliffe, S.(eds). The Scottish Health Survey – 2017 edition: volume 1: main report. Edinburgh: Scottish Government. Available from: https://www.gov.scot/publications/scottish-health-survey-2017-volume-1-main-report/pages/86/