Scottish Fish Farm Production Survey 2022
This report is based on the returns of an annual survey questionnaire sent to all active authorised fish farming businesses in Scotland during 2022. Statistics on employment, production and value are presented.
3. Atlantic Salmon - Production
Production
Production survey information was collected from all 10 companies actively involved in Atlantic salmon production, farming 210 active sites. This figure represents the entire industry operating in Scotland.
| Year | Tonnes | Percentage difference | Year | Tonnes | Percentage difference |
|---|---|---|---|---|---|
| 2002 | 144,589 | 4 | 2013 | 163,234 | 1 |
| 2003 | 169,736 | 17 | 2014 | 179,022 | 10 |
| 2004 | 158,099 | -7 | 2015 | 171,722 | -4 |
| 2005 | 129,588 | -18 | 2016 | 162,817 | -5 |
| 2006 | 131,847 | 2 | 2017 | 189,707 | 17 |
| 2007 | 129,930 | -1 | 2018 | 156,025 | -18 |
| 2008 | 128,606 | -1 | 2019 | 203,881 | 31 |
| 2009 | 144,247 | 12 | 2020 | 192,129 | -6 |
| 2010 | 154,164 | 7 | 2021 | 205,393 | 7 |
| 2011 | 158,018 | 3 | 2022 | 169,194 | -18 |
| 2012 | 162,223 | 3 | 2023 | 187,725* |
*industry estimate of projected tonnage based on stocks currently being on-grown.
The total production of Atlantic salmon during 2022 was 169,194 tonnes, a decrease of 36,199 tonnes (18%) on the 2021 total.
| Year of smolt input | Year of harvest | Number (000's) | Production (tonnes) | Mean weight at harvest (kg) | |
|---|---|---|---|---|---|
| Harvest in year 0 (i.e. in year of input) | 2013 | 2013 | 0 | 0 | - |
| 2014 | 2014 | 286 | 720 | 2.5 | |
| 2015 | 2015 | 223 | 626 | 2.8 | |
| 2016 | 2016 | 114 | 333 | 2.9 | |
| 2017 | 2017 | 0 | 0 | - | |
| 2018 | 2018 | 84 | 247 | 2.9 | |
| 2019 | 2019 | 319 | 931 | 2.9 | |
| 2020 | 2020 | 323 | 1,208 | 3.7 | |
| 2021 | 2021 | 16 | 34 | 2.1 | |
| 2022 | 2022 | 79 | 135 | 1.7 | |
| Harvest in year 1 | 2012 | 2013 | 21,264 | 106,161 | 5.0 |
| 2013 | 2014 | 20,316 | 101,997 | 5.0 | |
| 2014 | 2015 | 24,038 | 114,112 | 4.7 | |
| 2015 | 2016 | 24,633 | 111,163 | 4.5 | |
| 2016 | 2017 | 25,596 | 126,445 | 4.9 | |
| 2017 | 2018 | 21,825 | 110,554 | 5.1 | |
| 2018 | 2019 | 26,324 | 132,090 | 5.0 | |
| 2019 | 2020 | 28,529 | 141,775 | 5.0 | |
| 2020 | 2021 | 29,697 | 144,695 | 4.9 | |
| 2021 | 2022 | 25,777 | 117,901 | 4.6 | |
| Harvest in year 2 | 2011 | 2013 | 11,283 | 57,073 | 5.1 |
| 2012 | 2014 | 13,712 | 76,305 | 5.6 | |
| 2013 | 2015 | 10,910 | 56,984 | 5.2 | |
| 2014 | 2016 | 10,940 | 51,321 | 4.7 | |
| 2015 | 2017 | 11,094 | 63,262 | 5.7 | |
| 2016 | 2018 | 7,165 | 45,224 | 6.3 | |
| 2017 | 2019 | 12,212 | 70,860 | 5.8 | |
| 2018 | 2020 | 8,883 | 49,146 | 5.5 | |
| 2019 | 2021 | 10,602 | 60,664 | 5.7 | |
| 2020 | 2022 | 9,796 | 51,158 | 5.2 |
| Year | Grilse (January-August) | Pre-salmon (September-December) | ||||
|---|---|---|---|---|---|---|
| Number | Tonnes | Average weight (kg) | Number | Tonnes | Average weight (kg) | |
| 2013 | 9,618 | 47,496 | 4.9 | 11,646 | 58,665 | 5.0 |
| 2014 | 9,048 | 46,686 | 5.2 | 11,268 | 55,311 | 4.9 |
| 2015 | 11,243 | 53,930 | 4.8 | 12,795 | 60,182 | 4.7 |
| 2016 | 13,463 | 59,853 | 4.4 | 11,170 | 51,310 | 4.6 |
| 2017 | 13,523 | 68,116 | 5.0 | 12,073 | 58,329 | 4.8 |
| 2018 | 10,815 | 53,244 | 4.9 | 11,010 | 57,310 | 5.2 |
| 2019 | 14,495 | 72,243 | 5.0 | 11,829 | 59,847 | 5.1 |
| 2020 | 17,855 | 85,543 | 4.8 | 10,674 | 56,232 | 5.3 |
| 2021 | 18,512 | 93,346 | 5.0 | 11,185 | 51,349 | 4.6 |
| 2022 | 14,784 | 65,163 | 4.4 | 10,993 | 52,738 | 4.8 |
| Year | 2013 | 2014 | 2015 | 2016 | 2017 | 2018 | 2019 | 2020 | 2021 | 2022 |
|---|---|---|---|---|---|---|---|---|---|---|
| Growth stage | - | - | - | - | - | - | - | - | - | - |
| Input year fish | 0 | <1 | <1 | <1 | 0 | <1 | <1 | <1 | <1 | <1 |
| Grilse | 29 | 26 | 31 | 37 | 36 | 34 | 35 | 45 | 45 | 39 |
| Pre-salmon | 36 | 31 | 35 | 31 | 31 | 36 | 29 | 29 | 25 | 31 |
| Year 2 salmon | 35 | 42 | 33 | 31 | 33 | 29 | 35 | 26 | 30 | 30 |
Survival and Production in Smolt Year Classes
| Year of smolt input | Smolt input (000's) | Harvest year 0 | Harvest year 1 | Harvest year 2 | Total % of year class harvested (survival) | Year class weight (tonnes) | Yield per smolt (kg) | |||||||||
|---|---|---|---|---|---|---|---|---|---|---|---|---|---|---|---|---|
| Number (000's) | Weight (tonnes) | Mean weight (kg) | % harvest | Number (000's) | Weight (tonnes) | Mean weight (kg) | % harvest | Number (000's) | Weight (tonnes) | Mean weight (kg) | % harvest | |||||
| 2003 | 43,083 | 82 | 276 | 3.4 | 0.2 | 19,596 | 85,792 | 4.4 | 45.5 | 13,920 | 61,850 | 4.4 | 32.3 | 78.0 | 147,918 | 3.43 |
| 2004 | 39,041 | 168 | 319 | 1.9 | 0.4 | 15,075 | 67,738 | 4.5 | 38.6 | 14,237 | 67,537 | 4.7 | 36.5 | 75.5 | 135,594 | 3.47 |
| 2005 | 37,168 | 0 | 0 | - | 0 | 14,036 | 64,099 | 4.6 | 37.8 | 14,999 | 69,000 | 4.6 | 40.3 | 78.1 | 133,099 | 3.58 |
| 2006 | 41,091 | 115 | 211 | 1.8 | 0.3 | 13,787 | 60,890 | 4.4 | 33.5 | 15,881 | 73,631 | 4.6 | 38.6 | 72.5 | 134,732 | 3.28 |
| 2007 | 37,853 | 23 | 40 | 1.7 | 0.06 | 13,011 | 54,759 | 4.2 | 34.4 | 14,133 | 66,448 | 4.7 | 37.3 | 71.8 | 121,247 | 3.20 |
| 2008 | 36,662 | 116 | 216 | 1.9 | 0.3 | 16,338 | 77,621 | 4.7 | 44.6 | 13,666 | 68,070 | 5.0 | 37.3 | 82.2 | 145,907 | 3.98 |
| 2009 | 38,548 | 81 | 178 | 2.2 | 0.2 | 18,266 | 85,826 | 4.7 | 47.4 | 13,772 | 66,606 | 4.8 | 35.7 | 83.3 | 152,610 | 3.96 |
| 2010 | 38,490 | 128 | 268 | 2.1 | 0.3 | 18,694 | 91,105 | 4.9 | 48.6 | 13,053 | 64,178 | 4.9 | 33.9 | 82.8 | 155,551 | 4.04 |
| 2011 | 42,733 | 109 | 307 | 2.8 | 0.3 | 21,502 | 97,744 | 4.5 | 50.3 | 11,283 | 57,073 | 5.1 | 26.4 | 77.0 | 155,124 | 3.63 |
| 2012 | 41,094 | 127 | 301 | 2.4 | 0.3 | 21,264 | 106,161 | 5.0 | 51.7 | 13,712 | 76,305 | 5.6 | 33.4 | 85.4 | 182,767 | 4.45 |
| 2013 | 40,936 | 0 | 0 | - | 0 | 20,316 | 101,997 | 5.0 | 49.6 | 10,910 | 56,984 | 5.2 | 26.7 | 76.3 | 158,981 | 3.88 |
| 2014 | 48,112 | 286 | 720 | 2.5 | 0.6 | 24,038 | 114,112 | 4.7 | 50.0 | 10,940 | 51,321 | 4.7 | 22.7 | 73.3 | 166,153 | 3.45 |
| 2015 | 45,465 | 223 | 626 | 2.8 | 0.5 | 24,633 | 111,163 | 4.5 | 54.2 | 11,094 | 63,262 | 5.7 | 24.4 | 79.1 | 175,051 | 3.85 |
| 2016 | 42,957 | 114 | 333 | 2.9 | 0.3 | 25,596 | 126,445 | 4.9 | 59.6 | 7,165 | 45,224 | 6.3 | 16.7 | 76.6 | 172,002 | 4.00 |
| 2017 | 46,116 | 0 | 0 | - | 0 | 21,825 | 110,554 | 5.1 | 47.3 | 12,212 | 70,860 | 5.8 | 26.5 | 73.8 | 181,414 | 3.93 |
| 2018 | 45,513 | 84 | 247 | 2.9 | 0.2 | 26,324 | 132,090 | 5.0 | 57.8 | 8,883 | 49,146 | 5.5 | 19.5 | 77.5 | 181,483 | 3.99 |
| 2019 | 52,990 | 319 | 931 | 2.9 | 0.6 | 28,529 | 141,775 | 5.0 | 53.8 | 10,602 | 60,664 | 5.7 | 20.0 | 74.4 | 203,370 | 3.84 |
| 2020 | 52,492 | 323 | 1,208 | 3.7 | 0.6 | 29,697 | 144,695 | 4.9 | 56.6 | 9,796 | 51,158 | 5.2 | 18.7 | 75.9 | 197,061 | 3.75 |
| 2021 | 51,131 | 16 | 34 | 2.1 | 0.03 | 25,777 | 117,901 | 4.6 | 50.4 | |||||||
| 2022 | 55,261 | 79 | 135 | 1.7 | 0.1 | |||||||||||
In 2020, the last year for which survival can be calculated, the survival rate from smolt input to harvest increased to 75.9%. Of the 2021 year class, 50.4% of the input has been harvested, 6.8% lower than the average harvest of fish one year after input in the 2020 year class. In 2022, 0.1% of the fish were harvested from the 2022 input. This was an increase compared with the proportion of fish harvested from the same year class in 2021.
Smolts to Sea
| Year | Smolts put to sea (000's) | Total (000's) | Scottish Origin | English Origin | Other Origin | ||||
|---|---|---|---|---|---|---|---|---|---|
| S½ | S1 | S1½ | % | (000's) | % | (000's) | % | ||
| 2013 | 19,262 | 21,534 | 140 | 40,936 | 97 | 1,169 | 3 | 0 | 0 |
| 2014 | 23,758 | 24,212 | 142 | 48,112 | 94 | 893 | 2 | 2,072 | 4 |
| 2015 | 22,886 | 22,569 | 10 | 45,465 | 96 | 938 | 2 | 1,082 | 2 |
| 2016 | 22,052 | 20,905 | 0 | 42,957 | 97 | 1,048 | 2 | 611 | 1 |
| 2017 | 25,490 | 20,626 | 0 | 46,116 | 97 | 976 | 2 | 300 | <1 |
| 2018 | 21,767 | 23,746 | 0 | 45,513 | 96 | 1,318 | 3 | 364 | <1 |
| 2019 | 24,525 | 28,465 | 0 | 52,990 | 98 | 751 | 1 | 297 | <1 |
| 2020 | 24,809 | 27,683 | 0 | 52,492 | 96 | 1,070 | 2 | 1,130 | 2 |
| 2021 | 29,421 | 21,396 | 314 | 51,131 | 97 | 1,016 | 2 | 300 | <1 |
| 2022 | 28,698 | 26,563 | 0 | 55,261 | 98 | 997 | 2 | 0 | 0 |
The total number of smolts put to sea in 2022 was just under 55.3 million. This smolt input comprised S½s (52%) and S1s (48%). No S1½s were produced in 2022. Two percent of the smolts stocked to Scottish salmon farms were sourced from outwith Scotland and no smolts coming from sources outwith GB in 2022. This was a decrease of 1% compared with the proportion observed in 2021.
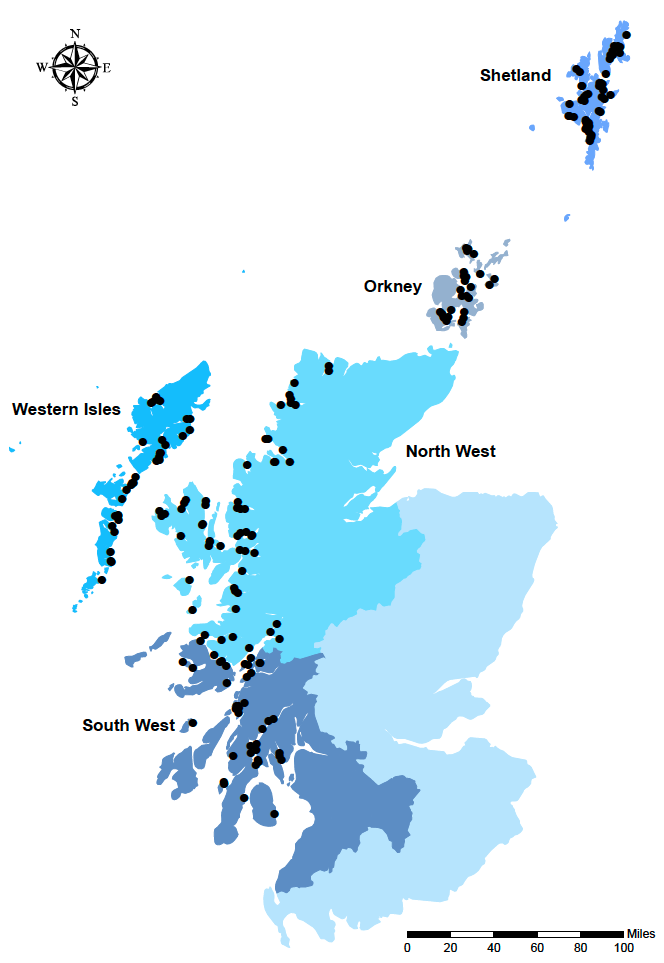
Survival and Production in Smolt Year Classes by Production Area
Table 30: Number (000's) of smolts put to sea and year class survival by area during 2011-2022
| Region | Smolts put to sea (000's) | Harvest in year 0 | Harvest in year 1 | Harvest in year 2 | Total Harvest | ||||||||
|---|---|---|---|---|---|---|---|---|---|---|---|---|---|
| Year | No | Year | No | % | Year | No | % | Year | No | % | No | % | |
| North West | 2011 | 12,605 | 2011 | 53 | 0.4 | 2012 | 7,937 | 63.0 | 2013 | 1,744 | 13.8 | 9,734 | 77.2 |
| 2012 | 11,588 | 2012 | 127 | 1.1 | 2013 | 7,179 | 62.0 | 2014 | 2,623 | 22.6 | 9,929 | 85.7 | |
| 2013 | 10,975 | 2013 | 0 | 0 | 2014 | 6,549 | 59.7 | 2015 | 1,695 | 15.4 | 8,244 | 75.1 | |
| 2014 | 17,543 | 2014 | 191 | 1.1 | 2015 | 9,649 | 55.0 | 2016 | 3,768 | 21.5 | 13,608 | 77.6 | |
| 2015 | 8,646 | 2015 | 223 | 2.6 | 2016 | 6,122 | 70.8 | 2017 | 1,695 | 19.6 | 8,040 | 93.0 | |
| 2016 | 14,534 | 2016 | 114 | 0.8 | 2017 | 9,711 | 66.8 | 2018 | 1,882 | 12.9 | 11,707 | 80.5 | |
| 2017 | 9,527 | 2017 | 0 | 0 | 2018 | 3,809 | 40.0 | 2019 | 1,739 | 18.3 | 5,548 | 58.2 | |
| 2018 | 15,177 | 2018 | 84 | 0.6 | 2019 | 10,947 | 72.1 | 2020 | 1,852 | 12.2 | 12,883 | 84.9 | |
| 2019 | 15,071 | 2019 | 205 | 1.4 | 2020 | 7,838 | 52.0 | 2021 | 1,976 | 13.1 | 10,019 | 66.5 | |
| 2020 | 19,075 | 2020 | 126 | 0.7 | 2021 | 12,443 | 65.2 | 2022 | 3,350 | 17.6 | 15,919 | 83.5 | |
| 2021 | 13,868 | 2021 | 10 | 0.1 | 2022 | 7,256 | 52.3 | ||||||
| 2022 | 18,130 | 2022 | 0 | 0 | |||||||||
| Orkney | 2011 | 2,718 | 2011 | 0 | 0 | 2012 | 1,203 | 44.3 | 2013 | 765 | 28.1 | 1,968 | 72.4 |
| 2012 | 2,727 | 2012 | 0 | 0 | 2013 | 1,422 | 52.1 | 2014 | 1,167 | 42.8 | 2,589 | 94.9 | |
| 2013 | 2,104 | 2013 | 0 | 0 | 2014 | 1,023 | 48.6 | 2015 | 512 | 24.3 | 1,535 | 72.9 | |
| 2014 | 2,829 | 2014 | 0 | 0 | 2015 | 1,412 | 49.9 | 2016 | 1,244 | 44.0 | 2,656 | 93.9 | |
| 2015 | 3,266 | 2015 | 0 | 0 | 2016 | 1,580 | 48.4 | 2017 | 1,521 | 46.6 | 3,101 | 95.0 | |
| 2016 | 3,050 | 2016 | 0 | 0 | 2017 | 1,184 | 38.8 | 2018 | 1,571 | 51.5 | 2,755 | 90.3 | |
| 2017 | 3,524 | 2017 | 0 | 0 | 2018 | 1,699 | 48.2 | 2019 | 835 | 23.7 | 2,534 | 71.9 | |
| 2018 | 3,616 | 2018 | 0 | 0 | 2019 | 2,068 | 57.2 | 2020 | 1,382 | 38.2 | 3,450 | 95.4 | |
| 2019 | 4,670 | 2019 | 0 | 0 | 2020 | 2,230 | 47.8 | 2021 | 1,970 | 42.2 | 4,200 | 89.9 | |
| 2020 | 4,578 | 2020 | 0 | 0 | 2021 | 2,162 | 47.2 | 2022 | 1,487 | 32.5 | 3,649 | 79.7 | |
| 2021 | 4,469 | 2021 | 0 | 0 | 2022 | 1,640 | 36.7 | ||||||
| 2022 | 5,217 | 2022 | 0 | 0 | |||||||||
| Shetland | 2011 | 11,206 | 2011 | 49 | 0.4 | 2012 | 4,911 | 43.8 | 2013 | 2,709 | 24.2 | 7,669 | 68.4 |
| 2012 | 11,389 | 2012 | 0 | 0 | 2013 | 4,995 | 43.9 | 2014 | 4,022 | 35.3 | 9,017 | 79.2 | |
| 2013 | 9,956 | 2013 | 0 | 0 | 2014 | 4,289 | 43.1 | 2015 | 3,034 | 30.5 | 7,323 | 73.6 | |
| 2014 | 11,309 | 2014 | 0 | 0 | 2015 | 5,042 | 44.6 | 2016 | 2,663 | 23.5 | 7,705 | 68.1 | |
| 2015 | 9,040 | 2015 | 0 | 0 | 2016 | 5,322 | 58.9 | 2017 | 1,592 | 17.6 | 6,914 | 76.5 | |
| 2016 | 10,640 | 2016 | 0 | 0 | 2017 | 6,012 | 56.5 | 2018 | 1,723 | 16.2 | 7,735 | 72.7 | |
| 2017 | 8,539 | 2017 | 0 | 0 | 2018 | 4,579 | 53.6 | 2019 | 2,005 | 23.5 | 6,584 | 77.1 | |
| 2018 | 11,312 | 2018 | 0 | 0 | 2019 | 4,430 | 39.2 | 2020 | 2,527 | 22.3 | 6,957 | 61.5 | |
| 2019 | 7,613 | 2019 | 114 | 1.5 | 2020 | 4,241 | 55.7 | 2021 | 2,186 | 28.7 | 6,541 | 85.9 | |
| 2020 | 10,072 | 2020 | 84 | 0.8 | 2021 | 5,246 | 52.1 | 2022 | 2,735 | 27.2 | 8,065 | 80.1 | |
| 2021 | 10,090 | 2021 | 0 | 0 | 2022 | 4,850 | 48.1 | ||||||
| 2022 | 10,571 | 2022 | 0 | 0 | |||||||||
| South West | 2011 | 7,493 | 2011 | 0 | 0 | 2012 | 2,673 | 35.7 | 2013 | 3,706 | 49.4 | 6,379 | 85.1 |
| 2012 | 7,363 | 2012 | 0 | 0 | 2013 | 2,841 | 38.6 | 2014 | 3,863 | 52.5 | 6,704 | 91.1 | |
| 2013 | 7,801 | 2013 | 0 | 0 | 2014 | 3,202 | 41.0 | 2015 | 3,564 | 45.7 | 6,766 | 86.7 | |
| 2014 | 6,981 | 2014 | 95 | 1.4 | 2015 | 3,771 | 54.0 | 2016 | 2,023 | 29.0 | 5,889 | 84.4 | |
| 2015 | 11,156 | 2015 | 0 | 0 | 2016 | 4,944 | 44.3 | 2017 | 3,643 | 32.7 | 8,587 | 77.0 | |
| 2016 | 8,093 | 2016 | 0 | 0 | 2017 | 4,643 | 57.4 | 2018 | 1,622 | 20.0 | 6,265 | 77.4 | |
| 2017 | 11,106 | 2017 | 0 | 0 | 2018 | 5,330 | 48.0 | 2019 | 3,648 | 32.8 | 8,978 | 80.8 | |
| 2018 | 7,177 | 2018 | 0 | 0 | 2019 | 4,799 | 66.9 | 2020 | 1,150 | 16.0 | 5,949 | 82.9 | |
| 2019 | 11,100 | 2019 | 0 | 0 | 2020 | 6,126 | 55.2 | 2021 | 2,094 | 18.9 | 8,220 | 74.1 | |
| 2020 | 9,485 | 2020 | 112 | 1.2 | 2021 | 5,248 | 55.3 | 2022 | 1,143 | 12.1 | 6,503 | 68.6 | |
| 2021 | 10,013 | 2021 | 0 | 0 | 2022 | 5,743 | 57.4 | ||||||
| 2022 | 10,152 | 2022 | 79 | 0.8 | |||||||||
| Western Isles | 2011 | 8,711 | 2011 | 7 | 0.1 | 2012 | 4,778 | 54.9 | 2013 | 2,358 | 27.1 | 7,143 | 82.0 |
| 2012 | 8,027 | 2012 | 0 | 0 | 2013 | 4,827 | 60.1 | 2014 | 2,037 | 25.4 | 6,864 | 85.5 | |
| 2013 | 10,100 | 2013 | 0 | 0 | 2014 | 5,254 | 52.0 | 2015 | 2,105 | 20.8 | 7,359 | 72.8 | |
| 2014 | 9,451 | 2014 | 0 | 0 | 2015 | 4,164 | 44.1 | 2016 | 1,242 | 13.1 | 5,406 | 57.2 | |
| 2015 | 13,357 | 2015 | 0 | 0 | 2016 | 6,665 | 49.9 | 2017 | 2,643 | 19.8 | 9,308 | 69.7 | |
| 2016 | 6,640 | 2016 | 0 | 0 | 2017 | 4,046 | 60.9 | 2018 | 367 | 5.5 | 4,413 | 66.4 | |
| 2017 | 13,420 | 2017 | 0 | 0 | 2018 | 6,408 | 47.7 | 2019 | 3,985 | 29.7 | 10,393 | 77.4 | |
| 2018 | 8,231 | 2018 | 0 | 0 | 2019 | 4,080 | 49.6 | 2020 | 1,972 | 24.0 | 6,052 | 73.5 | |
| 2019 | 14,536 | 2019 | 0 | 0 | 2020 | 8,094 | 55.7 | 2021 | 2,377 | 16.4 | 10,471 | 72.0 | |
| 2020 | 9,282 | 2020 | 0 | 0 | 2021 | 4,599 | 49.5 | 2022 | 1,082 | 11.7 | 5,681 | 61.2 | |
| 2021 | 12,691 | 2021 | 6 | <0.1 | 2022 | 6,289 | 49.6 | ||||||
| 2022 | 11,190 | 2022 | 0 | 0 | |||||||||
The practice of putting smolts to sea in one region and subsequently moving them to another sea water site in another region for harvest can lead to an overestimation of survival in some regions and underestimation in others.
© Crown copyright and database rights 2020 OS (100024655)
Staffing
| Year | Full-time Male | Full-time Female | Total Full-time | Part-time Male | Part-time Female | Total Part-time | Total Staff | Productivity (tonnes/person) |
|---|---|---|---|---|---|---|---|---|
| 2013 | 997 | 84 | 1,081 | 74 | 25 | 99 | 1,180 | 138.3 |
| 2014 | 1,082 | 109 | 1,191 | 98 | 36 | 134 | 1,325 | 135.1 |
| 2015 | 1,125 | 131 | 1,256 | 70 | 37 | 107 | 1,363 | 126.0 |
| 2016 | 1,182 | 197 | 1,379 | 67 | 40 | 107 | 1,486 | 109.6 |
| 2017 | 1,175 | 145 | 1,320 | 59 | 10 | 69 | 1,389 | 136.6 |
| 2018 | 1,273 | 142 | 1,415 | 35 | 16 | 51 | 1,466 | 106.4 |
| 2019 | 1,425 | 166 | 1,591 | 35 | 25 | 60 | 1,651 | 123.5 |
| 2020 | 1,412 | 145 | 1,557 | 45 | 28 | 73 | 1,630 | 117.9 |
| 2021 | 1,308 | 133 | 1,441 | 27 | 27 | 54 | 1,495 | 137.4 |
| 2022 | 1,260 | 166 | 1,426 | 47 | 35 | 82 | 1,508 | 112.2 |
In 2022, the total number of staff employed in salmon production was 1,508, an increase of 13 compared with 2021. The staffing figures collected refer specifically to the production of Atlantic salmon and do not include figures for staff involved with processing or marketing activities. Productivity decreased from 137.4 to 112.2 tonnes produced per person.
Production Methods
| Method | Number of sites | Total capacity (000's cubic metres) | Production (tonnes) | ||||||
|---|---|---|---|---|---|---|---|---|---|
| 2020 | 2021 | 2022 | 2020 | 2021 | 2022 | 2020 | 2021 | 2022 | |
| Seawater tanks | 1 | 1 | 1 | 5.1 | 5.6 | 5.6 | 18 | 14 | 17 |
| Seawater pens | 231 | 212 | 209 | 22,818 | 22,187 | 25,089 | 192,111 | 205,379 | 169,177 |
| For pen sites: ratio of production (kg) to pen capacity (m3) | 8.4 | 9.3 | 6.7 | ||||||
In 2022, the majority of fish were produced in seawater pens. There were 17 tonnes of production from seawater tank sites in 2022. This reflects the high installation and running costs incurred in operating seawater tank systems. Most seawater tank capacity has been re-deployed for the production of other species of marine finfish or salmon broodstock.
Sea pen capacity increased by 2,902,000 m3 during 2022 and the number of sea pen sites in production decreased by three. Production efficiency in sea pens, measured as the ratio of fish weight in kilograms produced per cubic metre, decreased from 9,3 kg/m3 in 2021 to 6.7 kg/m3 in 2022.
Scale of Production by Site
| Production grouping (tonnes) | Total | ||||||||
|---|---|---|---|---|---|---|---|---|---|
| 0 | 1-500 | 501-1,000 | 1,001-2,000 | 2,001-3,000 | 3,001-4,000 | >4,000 | Sites* | Tonnes | |
| 2013 | 112 | 42 | 36 | 50 | 8 | 7 | 2 | 257 | 163,234 |
| 2014 | 117 | 44 | 29 | 37 | 22 | 9 | 2 | 260 | 179,022 |
| 2015 | 115 | 38 | 26 | 56 | 11 | 6 | 2 | 254 | 171,722 |
| 2016 | 117 | 37 | 26 | 50 | 18 | 4 | 1 | 253 | 162,817 |
| 2017 | 91 | 25 | 33 | 50 | 20 | 4 | 3 | 226 | 189,707 |
| 2018 | 100 | 31 | 26 | 39 | 21 | 2 | 2 | 221 | 156,025 |
| 2019 | 80 | 33 | 24 | 60 | 17 | 9 | 3 | 226 | 203,881 |
| 2020 | 101 | 32 | 18 | 43 | 27 | 7 | 4 | 232 | 192,129 |
| 2021 | 73 | 28 | 25 | 50 | 25 | 9 | 3 | 213 | 205,393 |
| 2022 | 87 | 26 | 25 | 46 | 13 | 11 | 2 | 210 | 169,194 |
| 2013 | 0 | 5 | 17 | 45 | 11 | 16 | 6 | - | - |
| 2014 | 0 | 6 | 12 | 29 | 30 | 18 | 5 | - | - |
| 2015 | 0 | 6 | 12 | 50 | 15 | 12 | 5 | - | - |
| 2016 | 0 | 5 | 12 | 44 | 27 | 9 | 3 | - | - |
| 2017 | 0 | 4 | 14 | 40 | 26 | 7 | 9 | - | - |
| 2018 | 0 | 4 | 14 | 39 | 32 | 5 | 6 | - | - |
| 2019 | 0 | 3 | 10 | 45 | 20 | 15 | 7 | - | - |
| 2020 | 0 | 3 | 7 | 34 | 34 | 12 | 10 | - | - |
| 2021 | 0 | 3 | 9 | 37 | 28 | 15 | 8 | - | - |
| 2022 | 0 | 3 | 11 | 40 | 19 | 22 | 5 | - | - |
* Includes farms stocked but having no production.
In 2022, the number of sites with no production increased by 14 and the number producing 1 to 1,000 tonnes decreased by two. The number of sites producing 1,000 to 4,000 tonnes decreased by 14 and sites producing over 4,000 tonnes decreased by one. The trend towards production in larger sites continued, with 86% of production being derived from sites producing over 1,000 tonnes.
Company Productivity
| Total Tonnage | 0-1,000 | 1,001-5,000 | 5,001-10,000 | 10,001-30,000 | >30,000 | Total | |
|---|---|---|---|---|---|---|---|
| No. of companies | 2021 | 3 | 3 | 1 | 2 | 3 | 12 |
| 2022 | 3 | 2 | 1 | 2 | 2 | 10 | |
| No. of tonnes | 2021 | 14 | 5,213 | 6,149 | 43,388 | 150,629 | 205,393 |
| 2022 | 17 | 3,772 | 5,686 | 58,398 | 101,321 | 169,194 | |
| Staff (total) | 2021 | 16 | 75 | 93 | 466 | 845 | 1,495 |
| 2022 | 17 | 60 | 87 | 481 | 862 | 1,508 | |
| Productivity (tonnes/person) | 2021 | 0.9 | 70 | 66 | 93 | 178 | 137 |
| 2022 | 0.9 | 63 | 65 | 121 | 118 | 112 | |
The greatest productivity of 121 tonnes per person was achieved in the companies producing over 10,001-30,000 tonnes. The least productivity of 0.9 tonnes per person was from the companies producing between 0-1,000 tonnes. In comparison with 2021, the average company productivity decreased from 137 to 112 tonnes per person. Overall, production was dominated by two companies in 2022 which between them accounted for 60% of Scotland's farmed Atlantic salmon production.
Staff and Production by Production Area
| Region | Year | Staff | Annual Production | Productivity (t/person) | Year of input | Grilse | Pre-salmon | Year 2 Salmon | |||||
|---|---|---|---|---|---|---|---|---|---|---|---|---|---|
| F/T | P/T | Tonnes | Mean weight (kg) | Tonnes | Mean weight (kg) | Tonnes | Mean weight (kg) | Tonnes | Mean weight (kg) | ||||
| North West | 2013 | 350 | 48 | 43,320 | 109 | 0 | - | 17,937 | 4.9 | 16,417 | 4.7 | 8,966 | 5.1 |
| 2014 | 348 | 46 | 50,873 | 129 | 511 | 2.7 | 26,440 | 5.3 | 8,731 | 5.5 | 15,191 | 5.8 | |
| 2015 | 382 | 66 | 54,741 | 122 | 626 | 2.8 | 18,046 | 4.8 | 26,897 | 4.6 | 9,172 | 5.4 | |
| 2016 | 538 | 30 | 46,917 | 83 | 333 | 2.9 | 21,576 | 4.7 | 7,515 | 5.0 | 17,493 | 4.6 | |
| 2017 | 437 | 11 | 55,690 | 124 | 0 | - | 32,113 | 5.1 | 14,920 | 4.4 | 8,657 | 5.1 | |
| 2018 | 453 | 17 | 30,948 | 66 | 247 | 2.9 | 11,899 | 4.9 | 7,780 | 5.6 | 11,022 | 5.9 | |
| 2019 | 662 | 32 | 66,633 | 96 | 472 | 2.3 | 35,020 | 5.0 | 21,873 | 5.5 | 9,268 | 5.3 | |
| 2020 | 546 | 19 | 48,762 | 86 | 539 | 4.2 | 24,065 | 4.7 | 13,852 | 5.2 | 10,306 | 5.7 | |
| 2021 | 442 | 18 | 70,062 | 156 | 21 | 2.2 | 42,463 | 5.0 | 17,151 | 4.3 | 10,427 | 5.3 | |
| 2022 | 422 | 23 | 48,800 | 110 | 0 | - | 16,775 | 4.2 | 14,441 | 4.4 | 17,584 | 5.2 | |
| 2023 | 65,749* | ||||||||||||
| Orkney | 2013 | 86 | 3 | 11,479 | 129 | 0 | - | 3,191 | 5.1 | 4,491 | 5.7 | 3,797 | 5.0 |
| 2014 | 90 | 6 | 13,029 | 136 | 0 | - | 980 | 5.5 | 5,045 | 6.0 | 7,004 | 6.0 | |
| 2015 | 93 | 1 | 11,074 | 118 | 0 | - | 1,386 | 5.0 | 6,129 | 5.4 | 3,559 | 6.9 | |
| 2016 | 102 | 8 | 14,752 | 134 | 0 | - | 3,491 | 4.6 | 4,668 | 5.7 | 6,593 | 5.3 | |
| 2017 | 108 | 9 | 16,756 | 143 | 0 | - | 3,215 | 5.3 | 3,823 | 6.6 | 9,718 | 6.4 | |
| 2018 | 93 | 0 | 20,956 | 225 | 0 | - | 2,808 | 5.2 | 6,906 | 6.0 | 11,242 | 7.2 | |
| 2019 | 110 | 1 | 17,758 | 160 | 0 | - | 6,393 | 5.9 | 5,952 | 6.1 | 5,413 | 6.5 | |
| 2020 | 138 | 13 | 21,612 | 143 | 0 | - | 4,383 | 5.8 | 8,875 | 6.0 | 8,354 | 6.0 | |
| 2021 | 136 | 3 | 24,407 | 176 | 0 | - | 3,565 | 5.4 | 8,066 | 5.4 | 12,776 | 6.5 | |
| 2022 | 169 | 19 | 18,786 | 100 | 0 | - | 3,879 | 6.3 | 6,615 | 6.5 | 8,292 | 5.6 | |
| 2023 | 18,448* | ||||||||||||
| Shetland | 2013 | 210 | 14 | 36,694 | 164 | 0 | - | 5,822 | 4.5 | 18,121 | 4.9 | 12,751 | 4.7 |
| 2014 | 224 | 24 | 46,369 | 187 | 0 | - | 6,196 | 5.7 | 17,604 | 5.5 | 22,569 | 5.6 | |
| 2015 | 228 | 19 | 42,786 | 173 | 0 | - | 11,134 | 5.4 | 14,939 | 5.0 | 16,713 | 5.5 | |
| 2016 | 200 | 23 | 37,464 | 168 | 0 | - | 11,844 | 4.4 | 12,906 | 4.9 | 12,714 | 4.8 | |
| 2017 | 207 | 12 | 38,908 | 178 | 0 | - | 14,132 | 4.6 | 15,284 | 5.2 | 9,492 | 6.0 | |
| 2018 | 206 | 3 | 35,947 | 172 | 0 | - | 12,741 | 5.4 | 12,835 | 5.8 | 10,371 | 6.0 | |
| 2019 | 227 | 6 | 36,141 | 155 | 459 | 4.0 | 11,478 | 5.2 | 12,451 | 5.6 | 11,753 | 5.9 | |
| 2020 | 280 | 12 | 40,749 | 140 | 356 | 4.2 | 13,970 | 5.7 | 11,167 | 6.3 | 15,256 | 6.0 | |
| 2021 | 276 | 10 | 43,770 | 148 | 0 | - | 15,644 | 5.7 | 14,074 | 5.6 | 14,052 | 6.4 | |
| 2022 | 270 | 18 | 39,258 | 136 | 0 | - | 11,908 | 4.8 | 13,423 | 5.7 | 13,927 | 5.1 | |
| 2023 | 38,376* | ||||||||||||
| South West | 2013 | 251 | 19 | 34,924 | 129 | 0 | - | 5,847 | 4.8 | 9,111 | 5.6 | 19,966 | 5.4 |
| 2014 | 279 | 29 | 34,976 | 114 | 209 | 2.2 | 4,278 | 5.1 | 10,476 | 4.4 | 20,013 | 5.2 | |
| 2015 | 302 | 12 | 35,911 | 114 | 0 | - | 10,356 | 4.7 | 6,686 | 4.3 | 18,869 | 5.3 | |
| 2016 | 305 | 26 | 31,022 | 94 | 0 | - | 12,349 | 4.3 | 9,246 | 4.4 | 9,427 | 4.7 | |
| 2017 | 316 | 18 | 44,575 | 133 | 0 | - | 11,206 | 5.7 | 12,903 | 4.8 | 20,466 | 5.6 | |
| 2018 | 375 | 14 | 37,506 | 96 | 0 | - | 9,690 | 5.1 | 17,246 | 5.0 | 10,570 | 6.5 | |
| 2019 | 338 | 7 | 44,881 | 130 | 0 | - | 8,071 | 5.4 | 13,846 | 4.2 | 22,964 | 6.3 | |
| 2020 | 331 | 17 | 36,367 | 105 | 313 | 2.8 | 16,394 | 4.9 | 13,519 | 4.8 | 6,141 | 5.3 | |
| 2021 | 340 | 7 | 36,085 | 104 | 0 | - | 18,830 | 5.3 | 5,965 | 3.5 | 11,290 | 5.1 | |
| 2022 | 330 | 14 | 31,236 | 91 | 135 | 1.7 | 16,337 | 4.3 | 8,906 | 4.6 | 5,858 | 5.1 | |
| 2023 | 34,210* | ||||||||||||
| Western Isles | 2013 | 184 | 15 | 36,817 | 185 | 0 | - | 14,699 | 5.2 | 10,525 | 5.2 | 11,593 | 4.9 |
| 2014 | 250 | 29 | 33,775 | 121 | 0 | - | 8,792 | 4.5 | 13,455 | 4.1 | 11,528 | 5.7 | |
| 2015 | 251 | 9 | 27,210 | 105 | 0 | - | 13,008 | 4.4 | 5,531 | 4.5 | 8,671 | 4.1 | |
| 2016 | 234 | 20 | 32,662 | 129 | 0 | - | 10,593 | 4.2 | 16,975 | 4.1 | 5,094 | 4.1 | |
| 2017 | 252 | 19 | 33,778 | 125 | 0 | - | 7,450 | 4.7 | 11,399 | 4.6 | 14,929 | 5.6 | |
| 2018 | 288 | 17 | 30,668 | 101 | 0 | - | 16,106 | 4.5 | 12,543 | 4.4 | 2,019 | 5.5 | |
| 2019 | 254 | 14 | 38,468 | 144 | 0 | - | 11,281 | 4.1 | 5,725 | 4.2 | 21,462 | 5.4 | |
| 2020 | 262 | 12 | 44,639 | 163 | 0 | - | 26,731 | 4.3 | 8,819 | 4.6 | 9,089 | 4.6 | |
| 2021 | 247 | 16 | 31,069 | 118 | 13 | 2.1 | 12,844 | 5.0 | 6,093 | 4.6 | 12,119 | 5.1 | |
| 2022 | 235 | 8 | 31,114 | 128 | 0 | - | 16,264 | 4.2 | 9,353 | 3.9 | 5,497 | 5.1 | |
| 2023 | 30,942* | ||||||||||||
| Scotland Total | 2013 | 1,081 | 99 | 163,234 | 138 | 0 | - | 47,496 | 4.9 | 58,665 | 5.0 | 57,073 | 5.1 |
| 2014 | 1,191 | 134 | 179,022 | 135 | 720 | 2.5 | 46,686 | 5.2 | 55,311 | 4.9 | 76,305 | 5.6 | |
| 2015 | 1,256 | 107 | 171,722 | 126 | 626 | 2.8 | 53,930 | 4.8 | 60,182 | 4.7 | 56,984 | 5.2 | |
| 2016 | 1,379 | 107 | 162,817 | 110 | 333 | 2.9 | 59,853 | 4.4 | 51,310 | 4.6 | 51,321 | 4.7 | |
| 2017 | 1,320 | 69 | 189,707 | 137 | 0 | - | 68,116 | 5.0 | 58,329 | 4.8 | 63,262 | 5.7 | |
| 2018 | 1,415 | 51 | 156,025 | 106 | 247 | 2.9 | 53,244 | 4.9 | 57,310 | 5.2 | 45,224 | 6.3 | |
| 2019 | 1,591 | 60 | 203,881 | 124 | 931 | 2.9 | 72,243 | 5.0 | 59,847 | 5.1 | 70,860 | 5.8 | |
| 2020 | 1,557 | 73 | 192,129 | 118 | 1,208 | 3.7 | 88,025 | 4.8 | 57,808 | 5.3 | 45,088 | 5.5 | |
| 2021 | 1,441 | 54 | 205,393 | 137 | 34 | 2.1 | 93,346 | 5.0 | 51,349 | 4.6 | 60,664 | 5.7 | |
| 2022 | 1,426 | 82 | 169,194 | 112 | 135 | 1.7 | 65,163 | 4.4 | 52,738 | 4.8 | 51,158 | 5.2 | |
| 2023 | 187,725* | ||||||||||||
*Estimated production for 2023.
Company and Site Data
| Year | Number of companies | Number of sites | ||||
|---|---|---|---|---|---|---|
| Producing | Non-producing | Total | Producing | Non- producing | Total | |
| 2013 | 15 | 6 | 21 | 145 | 112 | 257 |
| 2014 | 11 | 7 | 18 | 143 | 117 | 260 |
| 2015 | 10 | 6 | 16 | 139 | 115 | 254 |
| 2016 | 10 | 5 | 15 | 136 | 117 | 253 |
| 2017 | 8 | 4 | 12 | 133 | 93 | 226 |
| 2018 | 8 | 4 | 12 | 121 | 100 | 221 |
| 2019 | 8 | 3 | 11 | 146 | 80 | 226 |
| 2020 | 8 | 3 | 11 | 131 | 101 | 232 |
| 2021 | 10 | 2 | 12 | 140 | 73 | 213 |
| 2022 | 8 | 2 | 10 | 123 | 87 | 210 |
The number of companies authorised and actively producing Atlantic salmon in 2022 was eight, two less than in 2021. Two companies remained active and authorised, although not producing salmon for harvest in 2022. These 10 companies had 210 registered active sites, although not all these sites produced fish for harvest in 2022.
Fallowing
| Year | Fallow Period (weeks) | Total | |||||
|---|---|---|---|---|---|---|---|
| 0 | <4 | 4-8 | 9-26 | 27-51 | 52 | ||
| 2013 | 51 | 4 | 31 | 92 | 35 | 43 | 253 |
| 2014 | 48 | 4 | 36 | 89 | 29 | 51 | 257 |
| 2015 | 45 | 6 | 41 | 84 | 27 | 47 | 250 |
| 2016 | 47 | 5 | 27 | 88 | 32 | 49 | 248 |
| 2017 | 40 | 9 | 21 | 88 | 24 | 40 | 222 |
| 2018 | 46 | 5 | 32 | 76 | 26 | 32 | 217 |
| 2019 | 37 | 12 | 31 | 85 | 22 | 37 | 224 |
| 2020 | 57 | 8 | 33 | 74 | 14 | 45 | 231 |
| 2021 | 29 | 11 | 32 | 85 | 29 | 26 | 212 |
| 2022 | 33 | 15 | 34 | 68 | 30 | 29 | 209 |
Of the 209 seawater pen sites recorded as being active in 2022, 29 sites were fallow for the entire year whilst 147 sites were fallow for a variable period. There were 33 sites that did not fallow in 2022. The normal production cycle in seawater varies in length between 12 months and two years. A fallow period at the end of production can break the cycle of disease or parasitic infections.
Broodstock Sites
| Year | 2013 | 2014 | 2015 | 2016 | 2017 | 2018 | 2019 | 2020 | 2021 | 2022 |
|---|---|---|---|---|---|---|---|---|---|---|
| Broodstock sites | 8 | 8 | 4 | 3 | 4 | 4 | 3 | 4 | 4 | 4 |
In 2022, the number of freshwater and seawater sites holding broodstock remained at four sites. A total of 3,166 fish were stripped, yielding 53.2 million ova, giving an average yield of 16,804 ova per fish.
Organic Production
| Year | Number of active pen sites | Number of pen sites certified as organic | Production (tonnes) |
|---|---|---|---|
| 2013 | 253 | 8 | 5,207 |
| 2014 | 257 | 8 | 3,588 |
| 2015 | 250 | 5 | 2,382 |
| 2016 | 248 | 5 | 3,903 |
| 2017 | 222 | 5 | 4,644 |
| 2018 | 217 | 5 | 4,219 |
| 2019 | 224 | 4 | 4,462 |
| 2020 | 231 | 9 | 12,528 |
| 2021 | 212 | 12 | 18,285 |
| 2022 | 209 | 9 | 17,768 |
Of the 209 active Atlantic salmon seawater pen sites in 2022, nine were certified as organic, producing 17,768 tonnes.
Escapes
There were two incidents involving the loss of 52,463 fish from seawater Atlantic salmon sites in 2022. There were six additional incidents reported where the companies confirmed there was no loss of fish.
Contact
Email: lorna.munro@gov.scot