Scottish Fish Farm Production Survey 2021
This report is based on the returns of an annual survey questionnaire sent to all active authorised fish farming businesses in Scotland during 2021. Statistics on employment, production and value are presented.
2. Atlantic Salmon (Salmo salar) - Ova and Smolts
Production survey information was collected from all 22 companies actively involved in the freshwater production of Atlantic salmon, farming 74 active sites. This figure represents the entire freshwater industry operating in Scotland.
Company and Site Data
| Year | No. of companies | No. of sites |
|---|---|---|
| 2012 | 28 | 100 |
| 2013 | 27 | 102 |
| 2014 | 26 | 96 |
| 2015 | 25 | 87 |
| 2016 | 26 | 87 |
| 2017 | 24 | 79 |
| 2018 | 24 | 71 |
| 2019 | 23 | 76 |
| 2020 | 24 | 78 |
| 2021 | 22 | 74 |
In 2021, the number of companies authorised by the Scottish Government for freshwater production of Atlantic salmon decreased by two to 22. A total of 74 sites were actively engaged in commercial production, a decrease of four from the 2020 figure.
Production and Staffing
| Year | Number (000’s) of Smolts produced | Full-time Male | Full-time Female | Total Full-time | Part-time Male | Part-time Female | Total Part-time | Total Staff | Productivity (000’s) smolts per person |
|---|---|---|---|---|---|---|---|---|---|
| 2012 | 44,324 | 218 | 17 | 235 | 60 | 33 | 93 | 328 | 135.1 |
| 2013 | 40,457 | 226 | 11 | 237 | 29 | 19 | 48 | 285 | 142.0 |
| 2014 | 45,004 | 226 | 18 | 244 | 42 | 23 | 65 | 309 | 145.6 |
| 2015 | 44,571 | 208 | 31 | 239 | 41 | 14 | 55 | 294 | 151.6 |
| 2016 | 42,894 | 225 | 27 | 252 | 35 | 7 | 42 | 294 | 145.9 |
| 2017 | 46,152 | 219 | 31 | 250 | 33 | 8 | 41 | 291 | 158.6 |
| 2018 | 47,097 | 210 | 29 | 239 | 30 | 9 | 39 | 278 | 169.4 |
| 2019 | 51,430 | 215 | 32 | 247 | 26 | 8 | 34 | 281 | 183.0 |
| 2020 | 50,492 | 233 | 30 | 263 | 23 | 6 | 29 | 292 | 172.9 |
| 2021 | 51,198 | 229 | 33 | 262 | 18 | 11 | 29 | 291 | 175.9 |
Smolt production in 2021 increased by 1% compared to 2020. The number of staff employed in 2021 decreased by one and productivity increased by 2% to a figure of 175,900 smolts produced per person.
Data for staffing and productivity in 2013 are shown, however, there are uncertainties with these data due to consolidation within the industry.
Smolts by Age Group
| Year | S½ | S1 | S1½ | Total |
|---|---|---|---|---|
| 2012 | 18,795 | 25,239 | 290 | 44,324 |
| 2013 | 19,024 | 21,279 | 154 | 40,457 |
| 2014 | 22,367 | 22,473 | 164 | 45,004 |
| 2015 | 23,850 | 20,711 | 10 | 44,571 |
| 2016 | 25,072 | 17,822 | 0 | 42,894 |
| 2017 | 28,072 | 18,080 | 0 | 46,152 |
| 2018 | 24,058 | 23,039 | 0 | 47,097 |
| 2019 | 25,607 | 25,823 | 0 | 51,430 |
| 2020 | 22,872 | 27,620 | 0 | 50,492 |
| 2021 | 30,175 | 20,709 | 314 | 51,198 |
In 2021, there was an increase of 32% in the number of S½ smolts produced and a decrease of 25% in the number of S1 smolts produced. In 2021 there was also production of S1½ smolts which accounted for less than 1% of all smolts produced.
Production Systems
| System | No. of sites with system | Total capacity, 000’s cubic metres | ||||||||
|---|---|---|---|---|---|---|---|---|---|---|
| Year | 2017 | 2018 | 2019 | 2020 | 2021 | 2017 | 2018 | 2019 | 2020 | 2021 |
| Cages | 36 | 27 | 27 | 27 | 26 | 357 | 346 | 351 | 379 | 374 |
| Tanks and Raceways | 43 | 44 | 49 | 51 | 48 | 55 | 54 | 68 | 62 | 65 |
| Total | 79 | 71 | 76 | 78 | 74 | 412 | 400 | 419 | 441 | 439 |
The types of facility used for the production of smolts in freshwater are cages or tanks and raceways. In 2021, the number of farms using cages deceased by one and the number of farms using tanks and raceways decreased by three. In terms of volume, cage capacity decreased by 5,000 m³ and tank and raceway capacity increased by 3,000 m³. This resulted in a net decrease in volume of 2,000 m³ available for the production of smolts in Scotland during 2021.
| Number of smolts produced (000’s) | Stocking densities (smolts/m 3 ) | |||||||||
|---|---|---|---|---|---|---|---|---|---|---|
| Year | 2017 | 2018 | 2019 | 2020 | 2021 | 2017 | 2018 | 2019 | 2020 | 2021 |
| Cages | 17,207 | 21,771 | 18,964 | 18,331 | 19,344 | 48 | 63 | 54 | 48 | 52 |
| All others | 28,945 | 25,326 | 32,466 | 32,161 | 31,854 | 526 | 469 | 477 | 519 | 490 |
| Total | 46,152 | 47,097 | 51,430 | 50,492 | 51,198 | - | - | - | - | - |
The average stocking densities of cages increased from 48 to 52 smolts per m³ in 2021 compared to 2020, while densities in tanks and raceways decreased from 519 to 490 smolts per m³.
Ova Production
| Year | 2012 | 2013 | 2014 | 2015 | 2016 | 2017 | 2018 | 2019 | 2020 | 2021 |
|---|---|---|---|---|---|---|---|---|---|---|
| No. of ova | 57,489 | 56,904 | 33,450 | 11,605 | 13,689 | 12,631 | 15,228 | 11,618 | 20,021 | 46,255 |
In 2021, over 46 million ova were stripped, an increase of 131% from the number of ova produced in 2020.
| Year | In-house broodstock | Out-sourced GB broodstock | GB wild broodstock | Foreign ova | Total | Previous year's estimate |
|---|---|---|---|---|---|---|
| 2012 | 18,556 | 9,981 | 0 | 34,700 | 63,237 | 55,723 |
| 2013 | 16,996 | 8,263 | 0 | 41,315 | 66,573 | 49,249 |
| 2014 | 14,418 | 2,725 | 10 | 53,684 | 70,837 | 48,149 |
| 2015 | 6,479 | 223 | 10 | 61,463 | 68,175 | 65,284 |
| 2016 | 5,884 | 4 | 0 | 58,458 | 64,346 | 59,604 |
| 2017 | 6,228 | 360 | 0 | 59,158 | 65,746 | 60,673 |
| 2018 | 8,780 | 200 | 0 | 61,499 | 70,479 | 67,374 |
| 2019 | 5,516 | 1,724 | 75 | 63,931 | 71,246 | 71,571 |
| 2020 | 5,195 | 4,480 | 258 | 68,685 | 78,618 | 70,598 |
| 2021 | 6,383 | 22,581 | 124 | 43,707 | 72,795 | 68,588 |
| 2022 | 77,306 |
The number of ova laid down to hatch was 72.8 million, a decrease of 5.8 million (7%) on the 2020 figure. The majority of the ova (60%) were derived from foreign sources, this being a decrease of 25 million (36%) on the 2020 figure. Supplies derived from GB broodstock (excluding wild origin ova) increased by 19.3 million, a 199% increase on the 2020 figure. In 2021, 124,000 ova from GB wild broodstock were laid down to hatch, ova derived from wild stocks are generally held and hatched for wild stock enhancement by the aquaculture industry in cooperation with wild fisheries managers.
Smolts Produced and Put to Sea
| 2012 | 2013 | 2014 | 2015 | 2016 | 2017 | 2018 | 2019 | 2020 | 2021 | 2022 | 2023 | |
|---|---|---|---|---|---|---|---|---|---|---|---|---|
| Actual smolts put to sea | 41.1 | 40.9 | 48.1 | 45.5 | 43.0 | 46.1 | 45.5 | 53.0 | 52.5 | 51.1 | ||
| Smolts produced | 44.3 | 40.5 | 45.0 | 44.6 | 42.9 | 46.2 | 47.1 | 51.4 | 50.5 | 51.2 | ||
| Estimated production | 31.3 | 28.1 | 39.9 | 43.4 | 36.6 | 39.3 | 46.1 | 38.6 | 52.1 | 55.6 | 54.1 | 55.6 |
| Ratio of ova laid down to smolts produced | 1.4 | 1.6 | 1.6 | 1.5 | 1.5 | 1.4 | 1.5 | 1.4 | 1.6 | 1.4 |
The figure for the number of smolts put to sea includes smolts produced in England and smolts imported from elsewhere, whereas smolt production data relate only to those produced in Scotland. Smolt producers estimate putting 54.1 million smolts to sea in 2022. The ratio of ova laid down to hatch to smolts produced in 2021 was less than the ratio in 2020.
Scale of Production
| Year | Scale of production | No. of sites in production | Total smolts produced | |||||||
|---|---|---|---|---|---|---|---|---|---|---|
| 1-10 | 11-25 | 26-50 | 51-100 | 101-250 | 251-500 | 501-1,000 | >1,000 | |||
| 2012 | 0 | 0 | 1 | 3 | 19 | 14 | 11 | 13 | 61 | 44,324 |
| 2013 | 1 | 0 | 1 | 7 | 14 | 14 | 7 | 14 | 58 | 40,457 |
| 2014 | 0 | 0 | 2 | 1 | 11 | 9 | 14 | 13 | 50 | 45,004 |
| 2015 | 1 | 1 | 2 | 4 | 9 | 11 | 16 | 11 | 55 | 44,571 |
| 2016 | 1 | 1 | 0 | 3 | 7 | 11 | 13 | 12 | 48 | 42,894 |
| 2017 | 1 | 0 | 0 | 2 | 6 | 11 | 10 | 15 | 45 | 46,152 |
| 2018 | 0 | 1 | 0 | 0 | 6 | 9 | 14 | 12 | 42 | 47,097 |
| 2019 | 1 | 0 | 0 | 2 | 8 | 8 | 10 | 16 | 45 | 51,430 |
| 2020 | 1 | 1 | 0 | 4 | 4 | 5 | 10 | 16 | 41 | 50,492 |
| 2021 | 1 | 0 | 0 | 2 | 6 | 5 | 9 | 16 | 39 | 51,198 |
Note: These data refer only to sites producing smolts. The sites holding only ova, fry or parr are excluded.
The number of sites producing smolts in 2021 was 39. The number of sites producing less than 101,000 smolts decreased by three while the number of sites producing between 101,000 and one million smolts per year increased by one. The number of sites producing in excess of one million smolts per year remained at 16 sites.
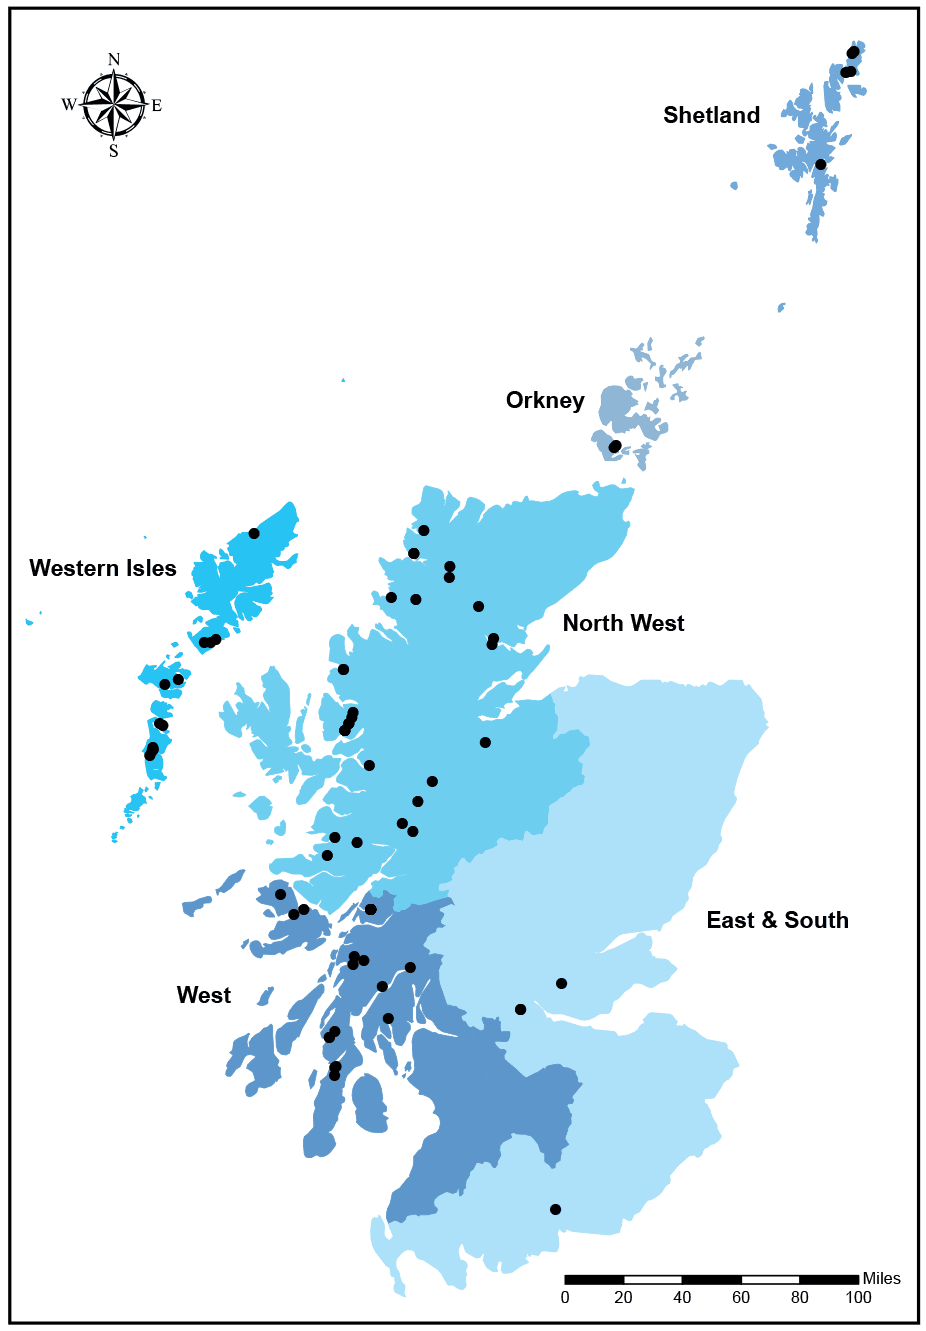
Production of Ova and Smolt by Production Area
| Region | Number of staff employed in 2021 | Ova laid down to hatch (000’s) | Smolt production (000’s) | Estimated smolt production (000’s) | ||||
|---|---|---|---|---|---|---|---|---|
| F/T | P/T | 2020 | 2021 | 2020 | 2021 | 2022 | 2023 | |
| North West | 142 | 12 | 42,702 | 39,077 | 26,308 | 28,369 | 30,517 | 30,657 |
| Orkney | 1 | 3 | 100 | 175 | 97 | 111 | 0 | 130 |
| Shetland | 25 | 1 | 5,948 | 4,239 | 3,804 | 2,905 | 2,865 | 4,300 |
| West | 66 | 6 | 23,810 | 24,766 | 16,213 | 16,063 | 17,529 | 17,564 |
| Western Isles | 24 | 4 | 5,738 | 4,493 | 3,247 | 2,695 | 2,210 | 2,235 |
| East and South | 4 | 3 | 320 | 45 | 823 | 1,055 | 930 | 700 |
| All Scotland | 262 | 29 | 78,618 | 72,795 | 50,492 | 51,198 | 54,051 | 55,586 |
In 2021, the North West and the West were the main areas where ova were laid down to hatch. The North West and the West were the main smolt producing areas. The greatest number of staff were employed in the North West region.
© Crown copyright and database rights 2020 OS (100024655)
International Trade
Scotland has a high health status with regard to the listed diseases. Imports of Atlantic salmon must originate from a source that is of equal or higher health status and consignments must be accompanied by a health certificate issued by the competent authority confirming that all requirements have been met.
Exports are subject to the health conditions placed by the importing country. Potential exporters should ascertain from the competent authority in the importing country any specific health testing requirements that may be a condition of import and obtain a copy of the required health certificate. The Fish Health Inspectorate will provide advice on whether the source site can fulfil the export requirements.
Imports and Exports
| Import Year | Ova | Fry, Parr and Smolts | ||||||||
|---|---|---|---|---|---|---|---|---|---|---|
| Iceland | Norway | Republic of Ireland | Total | Norway | Republic of Ireland | Total | ||||
| 2012 | 0 | 23,849 | 10,134 | 33,983 | 0 | 0 | 0 | |||
| 2013 | 2,719 | 35,044 | 10,700 | 48,463 | 0 | 55 | 55 | |||
| 2014 | 3,813 | 49,831 | 5,218 | 58,862 | 1,748 | 1,602 | 3,350 | |||
| 2015 | 8,978 | 45,926 | 4,815 | 59,719 | 365 | 2,118 | 2,483 | |||
| 2016 | 5,324 | 38,602 | 5,444 | 49,370 | 0 | 1,956 | 1,956 | |||
| 2017 | 13,883 | 37,025 | 7,000 | 57,908 | 0 | 2,012 | 2,012 | |||
| 2018 | 10,116 | 48,430 | 7,250 | 65,796 | 0 | 1,700 | 1,700 | |||
| 2019 | 26,352 | 23,673 | 10,184 | 60,209 | 0 | 297 | 297 | |||
| 2020 | 41,756 | 220 | 15,296 | 57,272 | 0 | 1,130 | 1,130 | |||
| 2021 | 31,276 | 160 | 19,260 | 50,696 | 0 | 300 | 300 | |||
The numbers of ova imported decreased by 11% in 2021. The number of fry, parr and smolts imported also decreased, with 300,000 fish imported from the Republic of Ireland during 2021.
| Export year | Farmed origin ova | Fry, Parr and Smolts | ||
|---|---|---|---|---|
| 2012 | 0 | 55 | ||
| 2013 | 650 | 404 | ||
| 2014 | 0 | 259 | ||
| 2015 | 95 | 8 | ||
| 2016 | 358 | 173 | ||
| 2017 | 339 | 206 | ||
| 2018 | 23 | 71 | ||
| 2019 | 0 | 263 | ||
| 2020 | 0 | 389 | ||
| 2021 | 0 | 371 | ||
In 2021, no ova were exported. Fry, parr and smolt exports decreased by 18,000 fish on the 2020 figure.
Vaccines
| Year | 2012 | 2013 | 2014 | 2015 | 2016 | 2017 | 2018 | 2019 | 2020 | 2021 |
|---|---|---|---|---|---|---|---|---|---|---|
| No. of sites | 63 | 63 | 56 | 55 | 47 | 46 | 43 | 46 | 43 | 43 |
| No. of fish (millions) vaccinated | 48.1 | 47.5 | 44.7 | 48.0 | 42.6 | 58.4 | 51.0 | 52.4 | 59.2 | 54.9 |
Vaccines were used to provide protection against furunculosis, infectious pancreatic necrosis (IPN), ERM, vibriosis and salmonid alphavirus (SAV). The majority of fish were vaccinated against furunculosis, IPN and SAV, with smaller numbers of fish being vaccinated against ERM and vibriosis. A total of 54.9 million fish were vaccinated across 43 sites.
Escapes
In 2021, there were no reported escapes from sites rearing freshwater Atlantic salmon.
Contact
Email: lorna.munro@gov.scot