Scottish Fish Farm Production Survey 2021
This report is based on the returns of an annual survey questionnaire sent to all active authorised fish farming businesses in Scotland during 2021. Statistics on employment, production and value are presented.
1. Rainbow Trout (Oncorhynchus mykiss)
Production survey information was collected from all 22 companies actively involved in rainbow trout production, farming 48 active sites. This figure represents the entire industry operating in Scotland.
Production
| Year | Tonnes | Percentage difference | Year | Tonnes | Percentage difference |
|---|---|---|---|---|---|
| 2007 | 7,414 | -1 | 2015 | 8,588 | 46 |
| 2008 | 7,670 | 3 | 2016 | 8,096 | -6 |
| 2009 | 6,766 | -12 | 2017 | 7,637 | -6 |
| 2010 | 5,139 | -24 | 2018 | 6,413 | -16 |
| 2011 | 4,619 | -10 | 2019 | 7,405 | 15 |
| 2012 | 5,670 | 23 | 2020 | 7,576 | 2 |
| 2013 | 5,611 | -1 | 2021 | 8,156 | 8 |
| 2014 | 5,882 | 5 | 2022 | 10,631* |
* Industry estimate based on stocks currently being on-grown.
Production increased in 2021 by 580 tonnes, an increase of 8%, to 8,156 tonnes.
| Year | <450 g | 450-900 g | >900 g | Total |
|---|---|---|---|---|
| <1 lb | 1-2 lbs | >2 lbs | Tonnes | |
| 2012 | 1,195 | 1,655 | 2,209 | 5,059 |
| 2013 | 1,908 | 825 | 2,268 | 5,001 |
| 2014 | 2,334 | 290 | 2,704 | 5,328 |
| 2015 | 2,299 | 258 | 5,476 | 8,033 |
| 2016 | 2,393 | 234 | 4,810 | 7,437 |
| 2017 | 2,000 | 544 | 4,453 | 6,997 |
| 2018 | 803 | 223 | 4,848 | 5,874 |
| 2019 | 343 | 228 | 6,335 | 6,906 |
| 2020 | 403 | 164 | 6,465 | 7,032 |
| 2021 | 384 | 154 | 7,117 | 7,655 |
Production for the table in 2021 was 7,655 tonnes, an increase of 623 tonnes (9%) on the 2020 total. This accounted for 94% of the total rainbow trout production, an increase on the proportion to that produced in 2020. Also, an increase in the number of fish in the large size range and a decrease in the number of fish in the small and medium size ranges were observed.
| Year | <450 g | 450-900 g | >900 g | Total |
|---|---|---|---|---|
| <1 lb | 1-2 lbs | >2 lbs | Tonnes | |
| 2012 | 22 | 266 | 323 | 611 |
| 2013 | 24 | 221 | 365 | 610 |
| 2014 | 28 | 256 | 270 | 554 |
| 2015 | 15 | 158 | 382 | 555 |
| 2016 | 35 | 183 | 441 | 659 |
| 2017 | 10 | 150 | 480 | 640 |
| 2018 | 14 | 143 | 382 | 539 |
| 2019 | 16 | 113 | 370 | 499 |
| 2020 | 46 | 130 | 368 | 544 |
| 2021 | 14 | 128 | 359 | 501 |
In 2021, production for the restocking of angling waters decreased to 501 tonnes representing a decrease of 43 tonnes (8%) on the 2020 total. This accounted for 6% of total rainbow trout production in 2021. These figures represent the tonnage of fish supplied to angling waters for restocking purposes; they do not account for the catch taken by anglers. There was a decrease in production of fish from all the size categories.
Production by Site
| Year | Number of sites per production tonnage | Total number of sites | |||
|---|---|---|---|---|---|
| <1-25 | 26-100 | 101-200 | >200 | ||
| 2012 | 10 | 10 | 6 | 8 | 34 |
| 2013 | 6 | 11 | 5 | 8 | 30 |
| 2014 | 6 | 11 | 5 | 9 | 31 |
| 2015 | 4 | 10 | 5 | 11 | 30 |
| 2016 | 6 | 10 | 3 | 13 | 32 |
| 2017 | 4 | 8 | 5 | 11 | 28 |
| 2018 | 5 | 10 | 3 | 11 | 29 |
| 2019 | 5 | 9 | 4 | 10 | 28 |
| 2020 | 6 | 13 | 2 | 11 | 32 |
| 2021 | 4 | 10 | 3 | 10 | 27 |
Production was reported from 27 of the 48 active sites. The number of producers in the 101-200 tonnes size bracket increased while those in the <1-25, 26-100 and >200 tonnes size brackets decreased. These figures do not include those sites specialising in the production of ova or young fish for on-growing.
Production by Method
| Production method | Production grouping (tonnes) in 2021 | Total tonnage and (%) by method | Number of sites | ||||||||
|---|---|---|---|---|---|---|---|---|---|---|---|
| <10 | 10-25 | 26-50 | 51-100 | >100 | 2020 | 2021 | 2020 | 2021 | |||
| FW cages | 0 | 0 | 0 | 0 | 5 | 2,279 (30%) | 1,976 (24%) | 6 | 5 | ||
| FW ponds and raceways | 1 | 1 | 6 | 2 | 3 | 1,022 (14%) | 968 (12%) | 14 | 13 | ||
| FW tanks and hatcheries | 2 | 0 | 0 | 1 | 0 | 86 (1%) | 68 (1%) | 3 | 3 | ||
| SW cages | 0 | 0 | 1 | 0 | 5 | 4,189 (55%) | 5,144 (63%) | 9 | 6 | ||
| SW tanks | 0 | 0 | 0 | 0 | 0 | 0 | 0 | 0 | 0 | ||
| Total | 3 | 1 | 7 | 3 | 13 | 7,576 | 8,156 | 32 | 27 | ||
Seawater production accounted for 5,144 tonnes (63%) and freshwater production the remaining 3,012 tonnes (37%). Production from all freshwater facilities decreased while production from seawater cage facilities increased during 2021.
Company and Site Data
| Year | No. of companies | No. of sites |
|---|---|---|
| 2012 | 25 | 48 |
| 2013 | 24 | 46 |
| 2014 | 24 | 46 |
| 2015 | 24 | 45 |
| 2016 | 24 | 44 |
| 2017 | 23 | 44 |
| 2018 | 23 | 53 |
| 2019 | 22 | 52 |
| 2020 | 21 | 50 |
| 2021 | 22 | 48 |
In 2021, the number of companies authorised by the Scottish Government and actively engaged in rainbow trout production was 22. The number of sites registered and in production was 48.
Staffing and Productivity
| Year | Full-time Male | Full-time Female | Total Full-time | Part-time Male | Part-time Female | Total Part-time | Total Staff | Productivity (tonnes/person) | ||
|---|---|---|---|---|---|---|---|---|---|---|
| 2012 | 74 | 5 | 79 | 23 | 5 | 28 | 107 | 53.0 | ||
| 2013 | 85 | 4 | 89 | 16 | 5 | 21 | 110 | 51.0 | ||
| 2014 | 86 | 7 | 93 | 13 | 7 | 20 | 113 | 52.1 | ||
| 2015 | 100 | 10 | 110 | 10 | 6 | 16 | 126 | 68.2 | ||
| 2016 | 90 | 10 | 100 | 15 | 6 | 21 | 121 | 66.9 | ||
| 2017 | 98 | 12 | 110 | 15 | 7 | 22 | 132 | 57.9 | ||
| 2018 | 103 | 8 | 111 | 17 | 8 | 25 | 136 | 47.2 | ||
| 2019 | 103 | 11 | 114 | 21 | 9 | 30 | 144 | 51.4 | ||
| 2020 | 97 | 13 | 110 | 20 | 4 | 24 | 134 | 56.5 | ||
| 2021 | 107 | 16 | 123 | 19 | 4 | 23 | 146 | 55.9 | ||
The overall number of staff employed in 2021 increased by 12 to 146. The number of full-time staff increased by 13 while the number of part-time staff decreased by one. Productivity, measured as tonnes produced per person, decreased by 1% in 2021 with no distinction between full and part-time employees being made for this calculation.
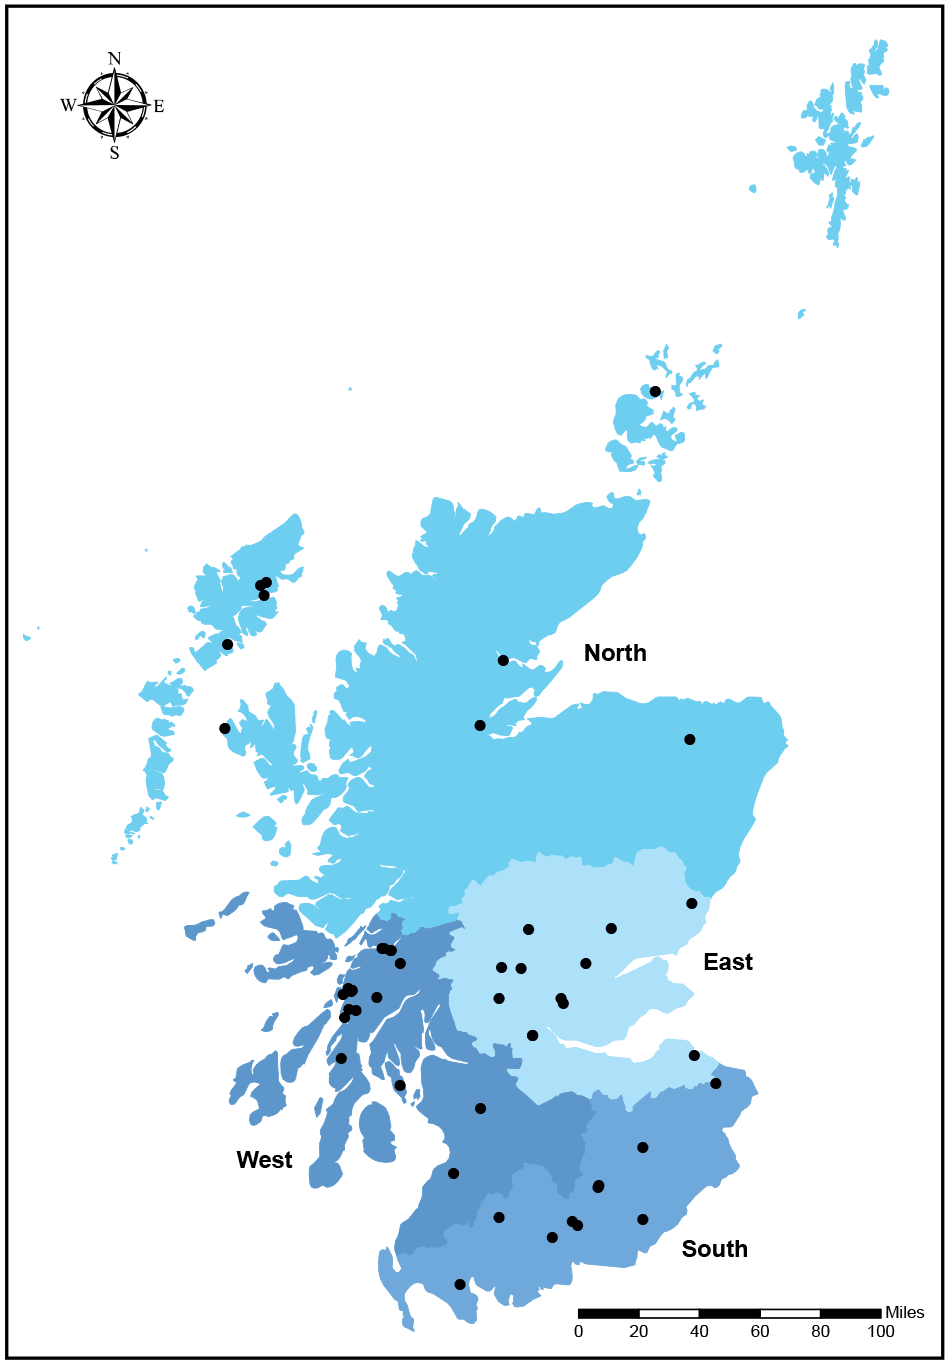
Production by Area
| Area | No. of sites | Table production (tonnes) | Restocking production (tonnes) | Total production (tonnes) | Mean tonnes per site | Staffing | Productivity (tonnes/person) | ||||||||||
|---|---|---|---|---|---|---|---|---|---|---|---|---|---|---|---|---|---|
| F/T | P/T | Total | |||||||||||||||
| North* | 10 | 454 | 33 | 486 | 48.6 | 13 | 4 | 17 | 28.6 | ||||||||
| East | 11 | 515 | 266 | 781 | 71.0 | 33 | 11 | 44 | 17.6 | ||||||||
| West | 17 | 6,290 | 8 | 6,298 | 370.5 | 53 | 3 | 56 | 112.5 | ||||||||
| South | 10 | 396 | 194 | 591 | 59.1 | 24 | 5 | 29 | 20.4 | ||||||||
| All | 48 | 7,655 | 501 | 8,156 | 169.9 | 123 | 23 | 146 | 55.9 | ||||||||
*From 2018, the North area also included production and staff from the Western Isles and from 2021 production and staff from Orkney was also included
Productivity was greatest in the West at 370.5 tonnes per site and 112.5 tonnes per person.
© Crown copyright and database rights 2020 OS (100024655)
Type of Ova Laid Down
| Year | All female diploid no. (%) | Triploid no. (%) | Mixed sex diploid no. (%) | Total ova |
|---|---|---|---|---|
| 2012 | 10,967 (85) | 2,005 (15) | 7 (<1) | 12,979 |
| 2013 | 7,857 (80) | 1,955 (20) | 77 (<1) | 9,889 |
| 2014 | 8,321 (75) | 2,710 (25) | 9 (<1) | 11,040 |
| 2015 | 10,245 (85) | 1,800 (15) | 76 (<1) | 12,121 |
| 2016 | 7,986 (80) | 1,943 (20) | 5 (<1) | 9,934 |
| 2017 | 2,366 (34) | 4,670 (66) | 5 (<1) | 7,041 |
| 2018 | 1,460 (23) | 4,843 (77) | 15 (<1) | 6,318 |
| 2019 | 1,077 (16) | 5,369 (82) | 105 (2) | 6,551 |
| 2020 | 286 (5) | 5,943 (95) | 15 (<1) | 6,244 |
| 2021 | 2 (<1) | 4,877 (<100) | 15 (<1) | 4,894 |
Source of Ova Laid Down
| Year | Ova produced in Great Britain (GB) | Imported ova | Total Ova Laid Down | |||||||||
|---|---|---|---|---|---|---|---|---|---|---|---|---|
| Own stock | Other stock | Total | Northern hemisphere | Southern hemisphere | Total | |||||||
| 2012 | 14 | 230 | 244 | 12,735 | 0 | 12,735 | 12,979 | |||||
| 2013 | 77 | 537 | 614 | 9,275 | 0 | 9,275 | 9,889 | |||||
| 2014 | 9 | 655 | 664 | 10,376 | 0 | 10,376 | 11,040 | |||||
| 2015 | 6 | 888 | 894 | 11,227 | 0 | 11,227 | 12,121 | |||||
| 2016 | 35 | 349 | 384 | 9,550 | 0 | 9,550 | 9,934 | |||||
| 2017 | 20 | 547 | 567 | 6,474 | 0 | 6,474 | 7,041 | |||||
| 2018 | 15 | 495 | 510 | 5,808 | 0 | 5,808 | 6,318 | |||||
| 2019 | 10 | 22 | 32 | 6,519 | 0 | 6,519 | 6,551 | |||||
| 2020 | 15 | 1,552 | 1,567 | 3,712 | 965 | 4,677 | 6,244 | |||||
| 2021 | 181 | 1,068 | 1,249 | 3,645 | 0 | 3,645 | 4,894 | |||||
In 2021, the total number of eyed ova laid down to hatch decreased by 1.4 million (22%) on the 2020 figure. Imported ova came from only the Northern hemisphere during 2021. The proportion of ova from GB broodstock increased (26% of the total) and the rainbow trout industry remained reliant on imported ova. Data on the importation of ova into Scotland are also available from the health certificates and are shown in Table 9a. Any discrepancy between the figures in Tables 8 and 9a is due to data being obtained from two independent sources.
Imports from Official Import Health Certificates
| Source | 2012 | 2013 | 2014 | 2015 | 2016 | 2017 | 2018 | 2019 | 2020 | 2021 |
|---|---|---|---|---|---|---|---|---|---|---|
| Denmark | 1,950 | 1,315 | 2,500 | 2,330 | 5,535 | 3,518 | 3,728 | 5,567 | 3,703 | 1,861 |
| Isle of Man | 300 | 800 | 1,000 | 175 | 20 | 300 | 0 | 0 | 0 | 0 |
| N. Ireland | 8,332 | 5,125 | 4,780 | 6,535 | 3,040 | 1,240 | 1,085 | 380 | 150 | 0 |
| Norway | 300 | 175 | 710 | 670 | 500 | 774 | 0 | 0 | 0 | 0 |
| South Africa | 0 | 0 | 0 | 0 | 0 | 0 | 0 | 0 | 1,225 | 0 |
| Spain | 0 | 0 | 0 | 0 | 0 | 0 | 0 | 60 | 180 | 828 |
| USA | 1,800 | 2,350 | 1,700 | 1,675 | 750 | 0 | 855 | 430 | 0 | 950 |
| Totals | 12,682 | 9,765 | 10,690 | 11,385 | 9,845 | 5,832 | 5,668 | 6,437 | 5,258 | 3,639 |
| Month | Denmark | Spain | USA |
|---|---|---|---|
| January | 310 | 0 | 0 |
| February | 0 | 0 | 0 |
| March | 896 | 0 | 0 |
| April | 640 | 0 | 0 |
| May | 15 | 0 | 0 |
| June | 0 | 0 | 0 |
| July | 0 | 0 | 0 |
| August | 0 | 0 | 0 |
| September | 0 | 348 | 550 |
| October | 0 | 0 | 0 |
| November | 0 | 480 | 400 |
| December | 0 | 0 | 0 |
| Totals | 1,861 | 828 | 950 |
| Source | 2012 | 2013 | 2014 | 2015 | 2016 | 2017 | 2018 | 2019 | 2020 | 2021 |
|---|---|---|---|---|---|---|---|---|---|---|
| N. Ireland | 155 | 537 | 674 | 746 | 592 | 486 | 391 | 935 | 787 | 463 |
Suppliers within the European Union (EU) accounted for 74% of ova imported into Scotland during 2021 with the USA accounting for the remaining 26%. In recent years there has been a trend for producers to import part grown rainbow trout into Scotland from Northern Ireland.
Trade in Fry and Fingerlings
| Year | Fry and fingerlings bought | Total number bought | Total number sold | ||
|---|---|---|---|---|---|
| All female diploid no. (%) | Triploid no. (%) | Mixed sex diploid no. (%) | |||
| 2012 | 12,543 (91) | 1,226 (9) | 0 | 13,769 | 12,088 |
| 2013 | 6,734 (84) | 1,239 (16) | 0 | 7,973 | 6,749 |
| 2014 | 5,911 (81) | 1,423 (19) | 0 | 7,334 | 6,719 |
| 2015 | 6,104 (87) | 598 (9) | 290 (4) | 6,992 | 6,971 |
| 2016 | 6,452 (85) | 1,125 (15) | 0 | 7,577 | 6,779 |
| 2017 | 3,989 (73) | 1,446 (27) | 0 | 5,435 | 4,145 |
| 2018 | 979 (42) | 1,361 (58) | 0 | 2,340 | 2,383 |
| 2019 | 861 (25) | 2,532 (75) | 0 | 3,393 | 2,832 |
| 2020 | 937 (33) | 1,916 (67) | 0 | 2,853 | 2,544 |
| 2021 | 417 (13) | 2,711 (87) | 2 (<1) | 3,130 | 3,389 |
The established trade between hatcheries and on-growing farms continued in 2021. Some companies specialised in fry and fingerling production. The total number of fry and fingerlings bought increased by 10% while the number sold increased by 33%. The disparity between supply and demand is due to trade with England and Wales.
Use of Vaccines
| Year | 2012 | 2013 | 2014 | 2015 | 2016 | 2017 | 2018 | 2019 | 2020 | 2021 |
|---|---|---|---|---|---|---|---|---|---|---|
| No. of sites | 24 | 19 | 21 | 17 | 18 | 18 | 17 | 21 | 18 | 19 |
| No. of fish | 20.4 | 9.9 | 10.0 | 8.3 | 7.3 | 5.4 | 3.4 | 3.4 | 2.8 | 3.1 |
Vaccines continued to be used as a preventative treatment against enteric redmouth disease (ERM), a potentially serious bacterial infection, caused by Yersinia ruckeri. Vaccination is generally carried out as a bath treatment at the fingerling stage, although some vaccines are administered by intra-peritoneal injection. A total of 3.1 million fish were vaccinated on 19 sites.
Organic Production
Of the 48 sites recorded as being active in rainbow trout production in 2021, none were certified as organic.
Escapes
There was one incident involving the loss of 52 fish from a rainbow trout site in 2021. There was one additional incident reported where the company confirmed there was no loss of fish.
Contact
Email: lorna.munro@gov.scot