Scottish Employer Perspectives Survey 2021
Results from the 2021 Scottish Employer Perspectives Survey.
Entry to work
This chapter explores vacancy and recruitment levels among employers, the initiatives used to recruit staff, and how equality, diversity and inclusion are integrated into employers' recruitment processes. It also explores characteristics of the recruited workforce and their preparedness for work.
Vacancies
52% of employers have had at least one vacancy in the previous 12 months and 46% had recruited staff over the same time period.
A larger proportion of employers had vacancies in 2021 than in 2019 (48%), though the proportion that had recruited staff had not increased significantly from 2019 (43%).
Labour market activity increased with employer size. Almost all employers (98%) with 50 or more staff had a vacancy in the last 12 months and a similar proportion (97%) recruited at least one employee. In comparison, around a quarter (27%) of employers with 2-4 employees had vacancies in the past 12 months and a fifth (21%) had recruited at least one employee.
Figure 3 shows that employers in the Non-market Services sector were most likely to have had vacancies (74%), followed by employers in the Trade, Accommodation and Transport sector (60%), while those in Primary Sector and Utilities were least likely to have had vacancies (24%).
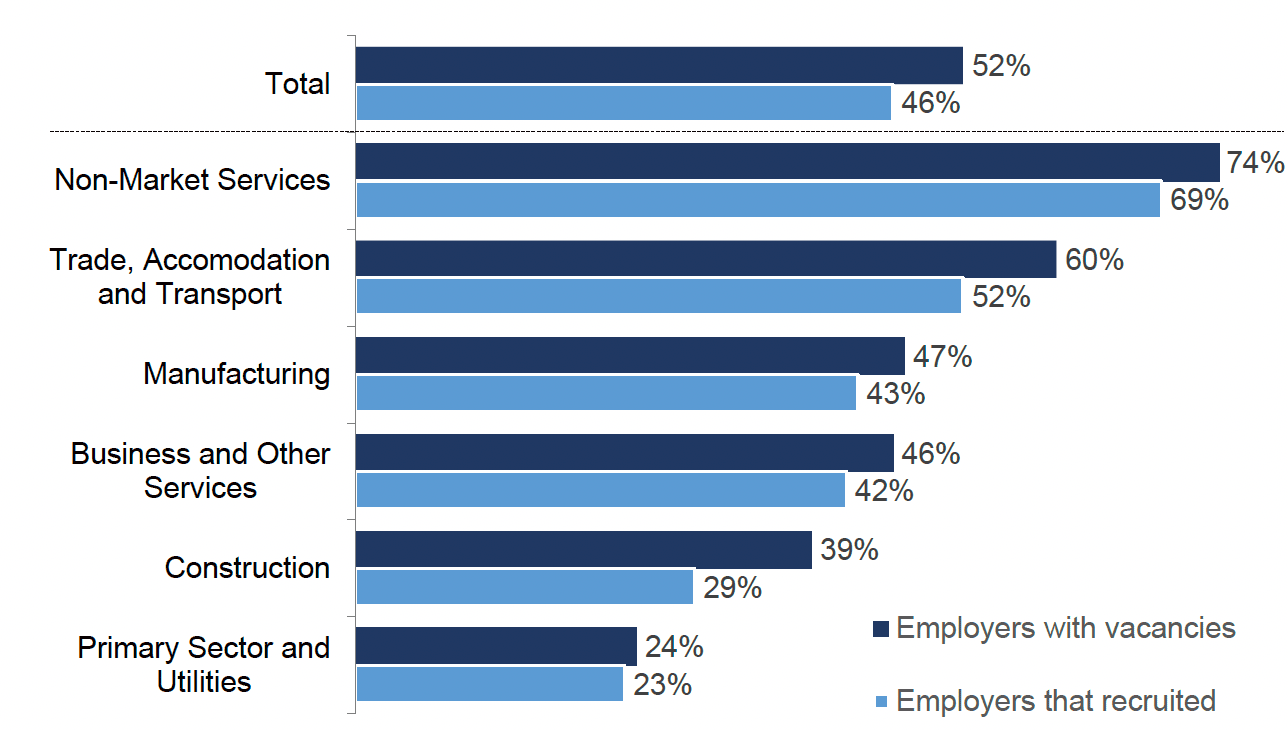
Base: All establishments (1,000)
Recruitment methods and related issues
Around three quarters (76%) of employers were aware of at least one recruitment service or initiative, an increase from 71% in 2019.
Larger employers were more likely to be aware of at least one recruitment service, employability programme or initiative (90% of establishments with 100+ employees and 88% with 50-99 employees, compared to 71% of establishments with 2-4 employers).
The most common recruitment service, employability programme or initiative that employers were aware of was Jobcentre Plus's Kickstart scheme (61%), followed by other Jobcentre Plus recruitment services (30%), Fair Start Scotland (29%), the Employability Fund (20%), the Young Person's Guarantee (18%), and the Universal Jobmatch Service (17%). Employers in the voluntary sector were most likely to be aware of at least one service, programme or initiative (94%), compared to the public (79%) and private (74%) sectors.
The Kickstart Scheme and other Jobcentre Plus recruitment services were also the most commonly used (6% and 4% respectively), while 1% of employers had used the Universal Jobmatch Service, the Young Person's Guarantee, Fair Start Scotland, and the Employability Fund. Overall, 9% of employers had used any of the prompted recruitment services, employability programmes or initiatives, the same proportion as in 2019.[6] As well as being most likely to be aware, employers in the voluntary sector were most likely to have used any service, programme or initiative (15%), while the private sector was least likely to have used any of them (8%).
The majority (83%) of employers that recruited in the 12 months prior to interview used multiple recruitment methods.
16% of employers that recruited in the preceding year used a single approach to recruitment. This was a decrease from 20% in 2019.
Word of mouth or personal recommendations were the most common method of filling vacancies (79%). Other internal resources[7] such as placing adverts on social media (65%) and placing adverts on websites (61%) were also popular and had grown since 2019 (56% and 53% respectively).
Three in ten (31%) employers that had vacancies used only internal resources to fill them, including 7% that had only used only word of mouth or personal recommendations, a decrease from 12% in 2019.
The proportion of employers that had used other paid-for recruitment services had increased from 41% in 2019 to 48% in 2021. The common types of paid-for recruitment services used to fill vacancies included recruitment websites (29%), recruitment agencies (15%), and local press (7%). Use of paid-for recruitment websites has grown since 2019 (20%), whilst use of local press has fallen (10%).
Table 1 shows that the attribute most sought by employers in candidates was having meta-skills[8] with 70% rating it as 'significant' or 'critical'. However, meta-skills were less likely to be considered 'critical' among employers with more than 100 employees (10% compared with 25% overall).
| Factor | Proportion who considered factor 'Critical' or 'Significant' | |
|---|---|---|
| 2019 | 2021 | |
| Having meta-skills | N/A | 70% |
| Having relevant work experience | 62% | 59% |
| Having Maths and English to at least National 5 or 6 | 51% | 53% |
| Having a relevant vocational qualification | 46% | 47% |
| Having particular academic qualifications such as Nationals, Highers or a degree | 35% | 39% |
Base: All establishments: 2,652 (2019); 1,000 (2021)
Equalities and diversity in recruitment
55% of employers that had vacancies in the last 12 months collected information to monitor the diversity of applicants, similar to 2019 levels (51%).
Employers with more than 50 employees were most likely to monitor equality and diversity (71% of employers with 50-99 employees; 70% of employers with more than 100 employees). This was also more common among Non-market Services[9] and Construction employers (82% and 74% respectively), and less likely in the Trade, Accommodation and Transport (44%) and the Primary Sector and Utilities (34%).
Around half (51%) of employers that had vacancies in the last 12 months advertised a role that would be suited to flexible working, similar to 2019 levels (47%).
Smaller employers were least likely to have advertised a role that would be suitable for flexible working (43% of employers with less than 10 employees). It was most prevalent among employers with 50 to 99 employees (66%). By sector, the offer of flexible working was most common in Non-market Services (65%) and least common in the Manufacturing (25%) and Construction (34%) sectors.
In terms of specific measures, two-thirds (66%) of employers that had vacancies were aware of positive action and 16% of employers had used positive action in the last 12 months to recruit someone.[10] Larger companies were more likely to have used positive action (25% of companies with 50-99 employees and 24% of companies with 100+ employees). Using positive action was also more common among employers in the Non-market Services sector (21%), but less common among Business and Other Services employers (10%).
Fewer than one in ten (9%) of employers used blind or no name recruitment in the previous 12 months.[11] Again, Non-market Services employers (22%) were most likely to have implemented this, while it was less likely among Trade, Accommodation and Transport employers (5%).
Table 2 shows employers in the public sector were more likely to use specific recruitment practices, with the exception of the use of positive action and use of 'blind or no name recruitment'.
| Recruitment Practice | All employers | Private | Voluntary | Public |
|---|---|---|---|---|
| Awareness of positive action | 66% | 65% | 72% | 77% |
| Use of positive action | 16% | 16% | 19% | 11% |
| Monitoring equality and diversity of applicants | 55% | 50% | 72% | 82% |
| Flexible working vacancies advertised | 51% | 48% | 61% | 63% |
| Use of 'blind or no name recruitment' | 9% | 5% | 27% | 24% |
Base: All establishments that had vacancies in the last 12 months (699).
Around three-quarters (77%) of employers that had vacancies had not implemented any specific practices to encourage a diverse range of applicants, a fall from 82% in 2019.
Gender Pay Gap legislation
Since April 2017, Gender Pay Gap legislation has required large employers with 250 or more employees to publish annual statistics regarding the pay of their workforce split by gender.
Two-thirds (68%) of employers were aware of the Gender Pay Gap legislation, a decrease from 74% in 2019.
Larger employers are more likely to be aware of the Gender Pay Gap legislation (84% of employers with 100 or more employees). By sector, awareness was highest in Business and Other Services (76%), while Primary Sector and Utilities and Trade, Accommodation and Transport employers were less likely to be aware (56% and 63% respectively).
A small minority (3%) of employers that were aware of the Gender Pay Gap legislation had made at least one change to their recruitment practices as a result, while 6% were unsure whether they had made a change, similar to the levels of 2019 (2% had made at least one change and 5% were unsure). Nine in ten (90%) of employers aware of the legislation had made no change to their recruitment practices; this is lower than the corresponding proportion in 2019 (94%).
The most common changes were altering the salaries of the positions recruited to; and increasing the transparency over salaries (each mentioned by 1% of those aware of the legislation).
Recruiting young people
63% of employers that recruited in the last year recruited a young person (aged under 25).
This is similar to 2019 levels (60%), after wave-on-wave decreases since 2014, as shown in Table 3.
| Recruitment Practice | Proportion of all recruiting employers | |||
|---|---|---|---|---|
| 2014 | 2016 | 2019 | 2021 | |
| Young people (aged under 25) | 66% | 64% | 60% | 63% |
Base: All establishments that recruited in the last 12 months: 2,440 (2014), 2,470 (2016), 1,611 (2019), 644 (2021)
The recruitment of young people over the last 12 months increased with size of establishment, ranging from 36% of employers with 2 to 4 employees recruiting a young person, to 92% of employers with 100 or more employees.
More information by size, sector and ROA region is available in Table 29 in the background data tables.
Figure 4 shows that employers in the Trade, Accommodation and Transport sector were most likely to employ young people (78%), while employers in the Business and Other Services sector were least likely to (48%).
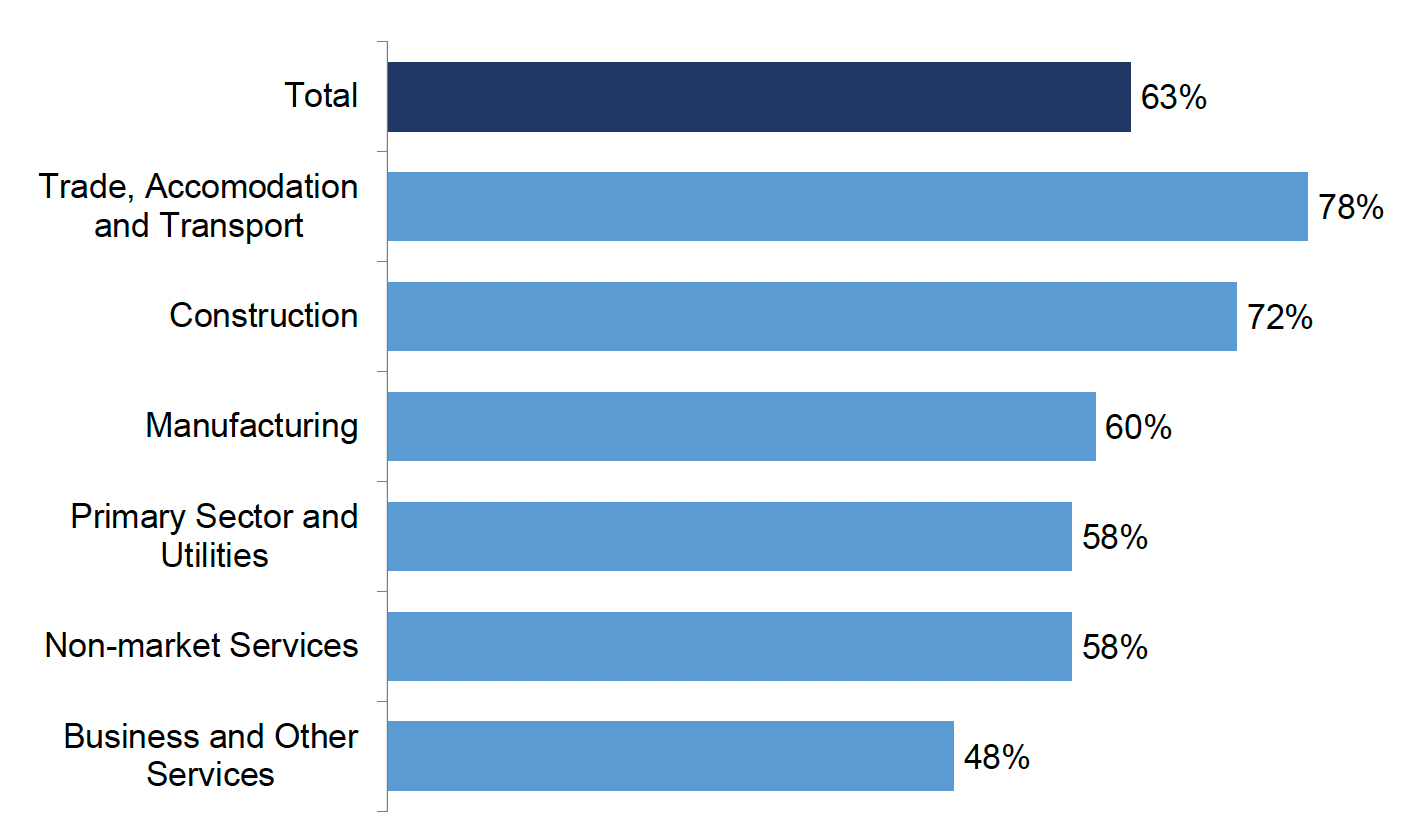
Base: All establishments that recruited in the last 12 months (644).
Recruitment directly from education
Recruiting directly from education includes recruiting an employee to their first job from a school, college, or university.
In the last 2 to 3 years from the time of interview, 35% of employers recruited an employee directly from education.
This is an increase from 2019 (30%), as shown in Table 4.
Recruiting directly from education increased with employer size, ranging from 22% of employers with 2 to 4 employees to 84% of employers with 100 or more employees. In terms of sector, employers within the Primary Sector and Utilities sector were least likely to have taken on anyone to their first job after education (24%).
More information by size, sector and ROA region is available in Table 31 in the background data tables.
Overall, a fifth (21%) of employers recruited from a Scottish secondary school, 15% recruited from a Scottish college and 14% recruited from a Scottish university. Employers were more likely in 2021 to have recruited college and university leavers than in 2019.
| Recruitment | Proportion of all employers | |||
|---|---|---|---|---|
| 2014 | 2016 | 2019 | 2021 | |
| Any education leaver | 32% | 32% | 30% | 35% |
| School leaver | 19% | 19% | 20% | 21% |
| College leaver | 11% | 11% | 12% | 15% |
| University leaver | 13% | 14% | 11% | 14% |
Base population: All establishments: 4,015 (2014), 4,009 (2016), 2,652 (2019), 1,000 (2021).
Preparedness for work
Most employers find their education leavers to be 'well' or 'very well' prepared.
80% of employers that recruited a leaver from a Scottish university said they were well or very well prepared for work. University leavers were most likely to be seen as 'well' or 'very well' prepared for work (80%) by employers, followed by college leavers (78%) and then school leavers (68%) – see Table 5.
The top three skills that young recruits were perceived by employers to lack remained the same irrespective of the education they entered work directly from. These were: lack of life experience (17% secondary school leavers; 8% college and university leavers); a poor attitude (13% secondary school leavers; 4% college leavers and 4% university leavers); and a lack of required skills or competencies (6% secondary school leavers; 8% college leavers and 3% university leavers).
| Recruitment | Proportion of employers that felt leavers were very well / well prepared for work | |||
|---|---|---|---|---|
| 2014 | 2016 | 2019 | 2021 | |
| School leaver | 63% | 65% | 58% | 68% |
| College leaver | 81% | 80% | 74% | 78% |
| University leaver | 88% | 84% | 78% | 80% |
| Base population: School leaver recruiters College leaver recruiters University leaver recruiters | 1,101 754 840 | 1,052 707 827 | 779 538 491 | 297 215 203 |
Work placements
Around a quarter (27%) of employers had provided any form of work placement over the last 12 months.
This is a decrease from the proportion in 2019 (36%) and continues a downward trend since 2016 (39%). On average, employers that offered placements had taken an average of just over 5 individuals, with a total of around 210,000 placements offered; these represent decreases on 2019 levels (around 6 individuals per employer offering placements; and around 330,000 placements).
As shown in Figure 5, the proportion of employers providing work placements increased with employer size, ranging from 18% of those with 2 to 4 employees to 60% of those with 100 or more employees. Non-market Services was the only sector where the majority of employers had provided work placements (52%); in comparison, only 16% in the Primary Sector and Utilities had done so.
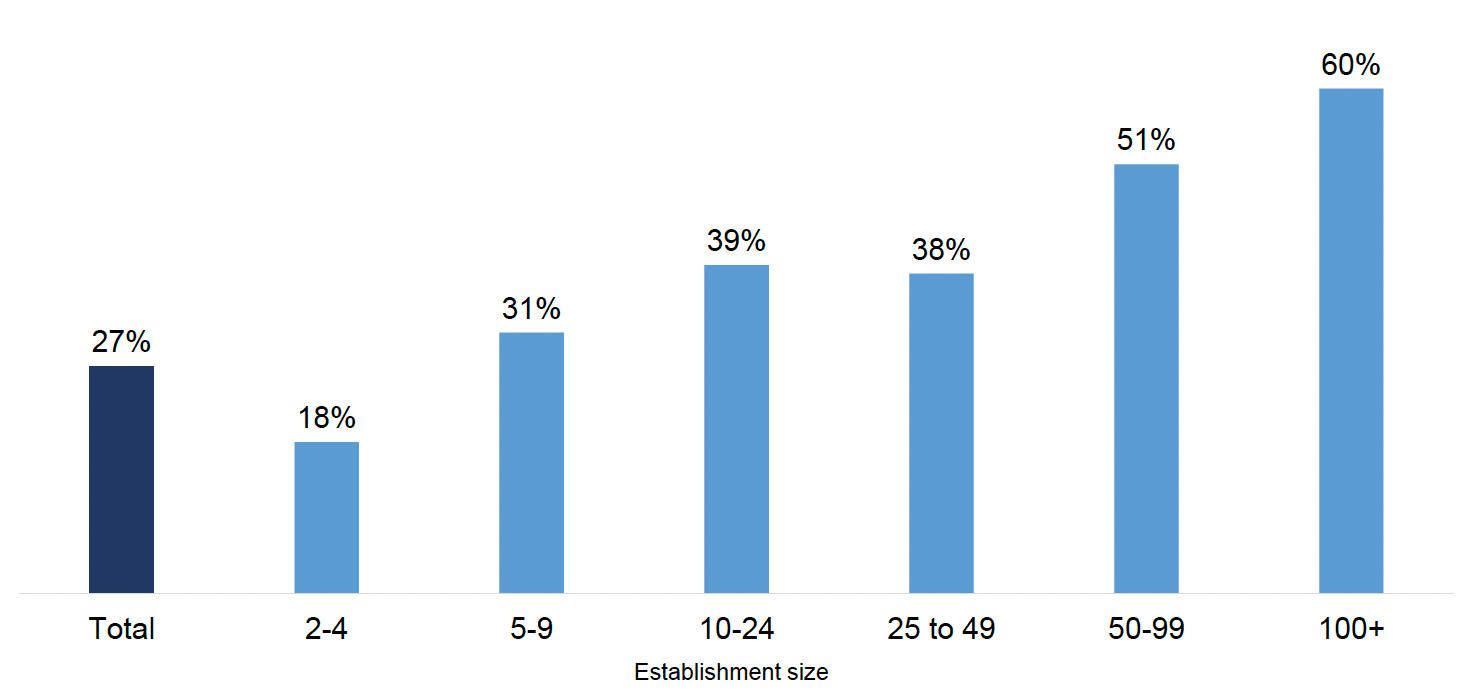
Base: All establishments: 2-4 (222); 5-9 (242); 10-24 (231); 25 to 49 (142); 50 to 99 (80); 100+ (83).
The most common types of placements provided, as shown in Table 6, were work trials for potential new recruits (11%). There were reductions in the proportion of employers providing placements for people at school (8% compared with 20% in 2019); placements for people at university (8% compared with 11%); and placements for people at college (7% compared with 12%). A full comparison to 2019 results can be found in Table 41 in the Background Tables.
| Proportion of employers that provided placement type | Total number of placements | |
|---|---|---|
| Any | 27% | 209,900 |
| Work trials for potential new recruits | 11% | 66,400 |
| Placements for people at school | 8% | 26,000 |
| Placements for people at university | 8% | 46,200 |
| Placements for people at college | 7% | 32,500 |
| Placements targeted at giving work experience to the unemployed | 4% | 16,300 |
| Internships | 3% | 10,900 |
Base: All establishments (1,000).
Almost half (46%) of employers that had provided work placements had gone on to recruit a trainee into a permanent or long-term paid role. In most cases this was directly following their placement. This is an increase from 2019, when around a third (34%) of employers had provided permanent work to a trainee.
The main reasons mentioned for not offering work placements or work inspiration activities[12] included: COVID-19 pressures such as a lack of work or site closures (37%), not having suitable roles available (30%), and not having the time or resource to manage these activities (12%).
Relatively common were also reasons relating to a lack of awareness (15%) including employers not knowing how to organise these activities, not having had anybody approach them, or not having thought about doing these before.
Other reasons for not offering work placements or work inspiration activities are shown in Table 46 in the background data tables.
Citing COVID-19 as a barrier to offering work placements or work inspiration activities was more common among mid-to-large-sized businesses (58% of those with 25 to 49 employees; 53% of those with 50 to 99 employees; and 59% of those with 100 or more employees).
Contact
Email: FHEstatistics@gov.scot