Scottish Crime and Justice Survey 2021/22: Main Findings
Main findings from the Scottish Crime and Justice Survey 2021/22.
Annex E: Interpreting charts, tables, and figures in this report
What do I need to know to help me understand the charts and tables in this report?
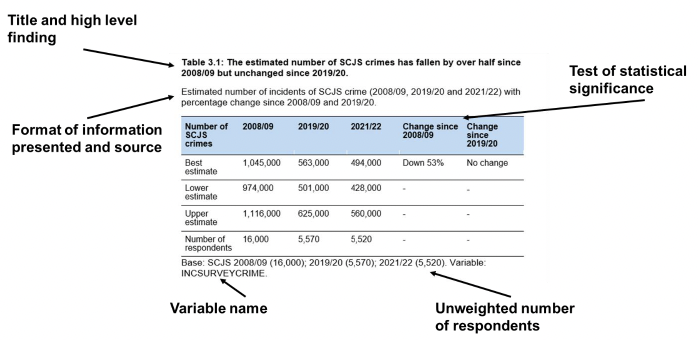
The information provided alongside figures and tables includes a title, the data source (survey year etc.), a base definition and the unweighted rounded (to the nearest 10) number of respondents and, if relevant, a variable name. Unless otherwise stated the results are from 2021/22. Examples of a chart and a table are shown below.
Where changes are referenced, either between groups or over time, this is only when a result is statistically significant at the 95% confidence level. This is due to the fact that the findings are based on a sample or respondents and therefore some level of uncertainty is associated with each measure. When testing for significance, a design effect of 1.19 is applied to the confidence intervals or each estimate, this is to account for the fact that the sample design of the SCJS is not completely random, and is stratified at police division level.
Charts

Charts and graphs presented in the report are a useful way to visualise trends over time or summarise and highlight differences between groups. Each chart features a title which provides the main key message from the information, or highlights a notable or significant finding. The subheading explains how the data is presented and what time period is covered, if no time period is stated then the data will refer to the most recent survey year. Figures presented in charts are based on weighted data unless otherwise stated, some may show the number of respondents which is the unweighted base.
Where change over time is displayed, the horizontal axis shows the period in which the SCJS fieldwork took place. Labels on the horizontal axis are only included in years in which there was SCJS fieldwork conducted, i.e. there was no survey covering 2011/12, 2013/14, 2015/16 or 2020/21. The time periods typically refer to a 12 month period covering the financial year, however as mentioned elsewhere in the report, the fieldwork for 2021/22 ran from November 2021 to December 2022. These labels have been formatted as ‘21/22’ etc. to increase the size and readability for all users.
Tables
All SCJS percentages and rates presented in the figures and tables are based on weighted data (see Chapter 9 of the accompanying Technical Report for details on survey weighting). However, figures and tables show the unweighted base which represents the number of respondents/households in the specified group or the numbers of crimes that the analysis is based on[139]. In tables and figures these are rounded to the nearest multiple of 10 (unrounded numbers are provided in data tables released alongside this report).
Most results presented in this report are rounded to whole numbers, but are available to multiple decimal places in the data tables released alongside this report. The prevalence estimate results presented in this report are provided to one decimal place which can sometimes be helpful where results are low. However, it should be noted that these results are estimates with associated ranges of uncertainty around them, which are taken account of in the statistical testing used in this report (and available more generally by using the users statistical testing tool published online alongside the supplementary data tables).
Note: table row or column percentages may not sum to 100% due to rounding.
Percentages presented in tables and figures, where they refer to the percentage of respondents, households or crimes that have the attribute being discussed, may not sum to 100%. Respondents have the option to refuse answering any question they did not wish to answer and the majority of questions have a 'don't know' option. Percentages for these response categories are generally not shown in tables and figures. In a small number of instances, to aid interpretation of the results, analysis is also presented based on data with ‘don’t know’ and ‘refused’ responses removed.
A percentage may be quoted in the report text for a single category that is identifiable in the figures/tables only by summing two or more component percentages. In order to avoid rounding errors, the percentage has been recalculated for the single combined category and therefore may differ slightly (i.e. by one or two percentage points) from the sum of the percentages derived from the figures/tables shown.
Also, percentages quoted in the report may represent variables that allow respondents to choose multiple responses. It is not possible to sum these categories when a respondent can choose multiple options. These percentages will not sum to 100% with the other percentages presented. They represent the percentage of the variable population that selected a certain response category.
The footer of each table features the variable name that was used. This name is as it appears in the SPSS datasets that are available on the UK Data Service.
Contact
Email: scjs@gov.scot