Scotland's zero waste plan: carbon metric guidance
Guidance on the carbon metric for measuring waste, produced in partnership with Entec UK Ltd.
1.0 Purpose of guidance
The Zero Waste Plan contains the following action:
5. The Scottish Government will introduce a carbon metric for waste, to identify and prioritise the materials with the highest environmental benefit for recycling, leading to better environmental outcomes, and a more efficient economy. This metric will complement the existing tonnage metric. |
Source: Zero Waste Plan for Scotland
The purpose of this document is to provide waste practitioners with guidance on the introduction of a Carbon Metric Reporting System for Recycling Performance. The Scottish Government does not intend to introduce this reporting system immediately but recognises that a better understanding of the proposals is required to inform current decision making. The implementation of the Carbon Metric Reporting System for Recycling Performance will follow the requirements for reporting set out in Annex A of the Zero Waste Plan.
Reprocessing markets are continually developing with new technologies emerging which will recover materials in a useable form. It is recognised that this will impact on the lifecycle of the material and hence the environmental impact will change. The proposed ban on specific materials from landfill will also have an effect on environmental impacts since there will no longer be the displacement of Greenhouse Gas ( GHG) emissions associated with the landfilling of biodegradable materials such as food, paper and garden waste.
The Scottish Government proposes to review the carbon data and analyses linked to the weightings reporting system described in this guidance document at appropriate intervals, to take account for updates in literature and available evidence. It will then make any necessary adjustments to the performance monitoring calculations where evidence suggests that this is necessary. It is expected that such reviews may refine the weightings, but it is not envisaged that this will have a significant bearing on metric as a decision making tool.
2.0 What is carbon metric reporting?
The Carbon Metric Reporting System for Recycling Performance is intended to inform waste policy and to promote a reduction in the environmental impact of resource use. It is not intended as a Carbon reporting tool for either UK or Scottish Climate Change targets and is not suitable for comparing and changing the materials used by businesses or households. It is designed as a decision making tool to prioritise the prevention, reuse and recycling of waste with the highest environmental benefit. It will allow stakeholders to make informed strategic decisions to the benefit of the environment by targeting recycling and re-use of high carbon impact materials.
The Scottish Government intends to use the metric to assess recycling performance for Scotland, for all sources of waste ( i.e. household, commerce, industry, construction and demolition). Sufficient data exists for Local Authority Collected Municipal Wastes ( LACMW) to apply the metric in the near future, however further data on household waste composition is required in order for the Carbon Metric Reporting System to be used to assess performance against the household waste targets for 2013 and 2020. Further improvements in data collection for other waste sectors (a further action of the Zero Waste Plan) will then make it possible for the 2025 target for all wastes to be assessed in terms of Carbon Metric Performance.
The Domestic targets set out in the Zero Waste Plan will become carbon metric based targets rather than weight based targets to encourage this resource use principle. However National and EU reporting will remain weight based and related targets will still need to be met.
3.0 How has it been developed?
Carbon Metric reporting is based upon lifecycle thinking but is not a strict lifecycle assessment. It uses the CO 2 equivalent emissions savings made from the recovery of secondary resources from the waste stream and the displacement of the primary alternative. For example, the extraction and use of aggregate which is a dense material has a relatively low carbon impact in terms of environmental emissions when compared to textiles, which are relatively light but produce much higher emissions in production. By attaching an emphasis or higher weighting on the capture of materials such as textiles for recycling and reporting in this manner, this displacement of emissions can be recognised.
There are many variables involved throughout a products' lifecycle, which affect its CO 2 equivalent emissions. Figure 1 outlines the stages of the lifecycle which have been included/excluded from the carbon metric weighting calculation.
Figure 1 - Inclusions and exclusions from the carbon metric calculation
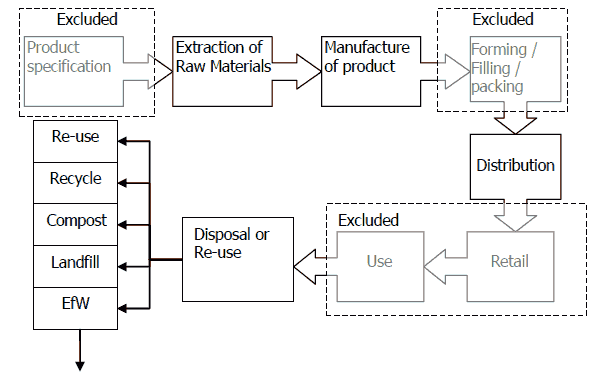
The calculation includes for CO 2 equivalent emissions generated through the extraction of the raw material, its manufacture into product, its transportation and distribution and its waste recovery/disposal method. It excludes product specification, product based biogenic carbon (that is released through plant degradation), forming, filling and packing. These stages are important sources of emissions however their emissions are product specific and are not materially different for the various waste management methods. For those stages included, average values have been calculated based upon current UK practice and it is recognised that these will alter over time.
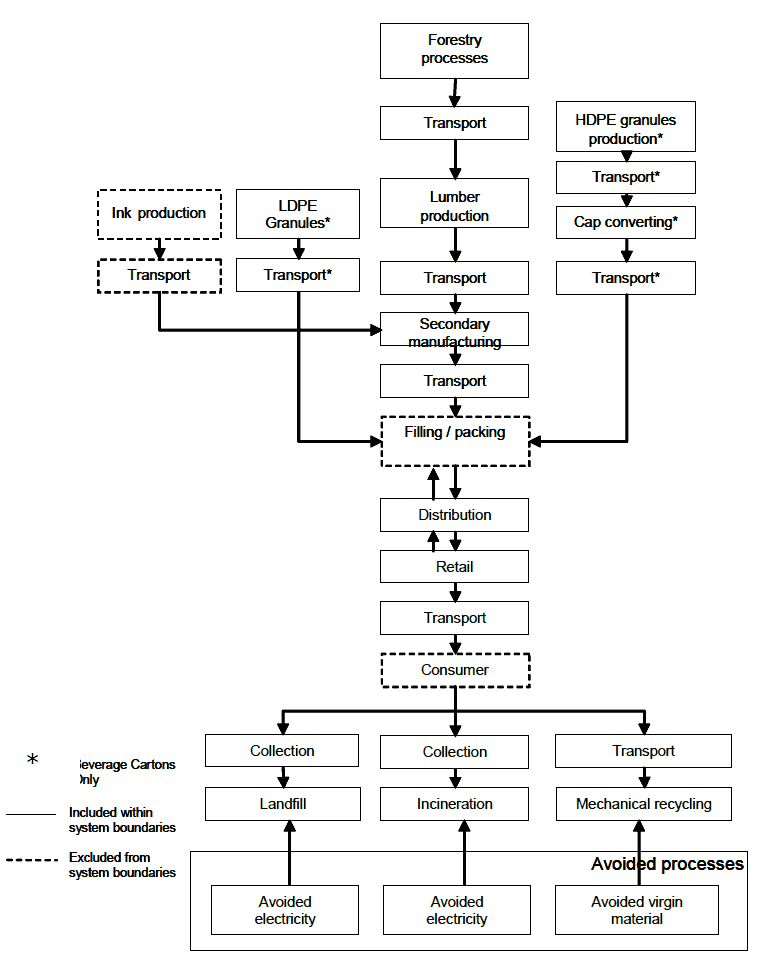
Specific inclusions and exclusions are highlighted by the following examples which show the various lifecycle stages for Aluminium compared to Wood. These examples show significant variance between material lifecycles, particularly during the early stages and in the processes avoided through re-use. Significant research has been undertaken to determine the stages for inclusion and the associated emissions for each material. The technical report describing this research is available for download at: www.zerowastescotland.org.uk/carbonmetric.
Figure 2 - The Lifecycle of Aluminium
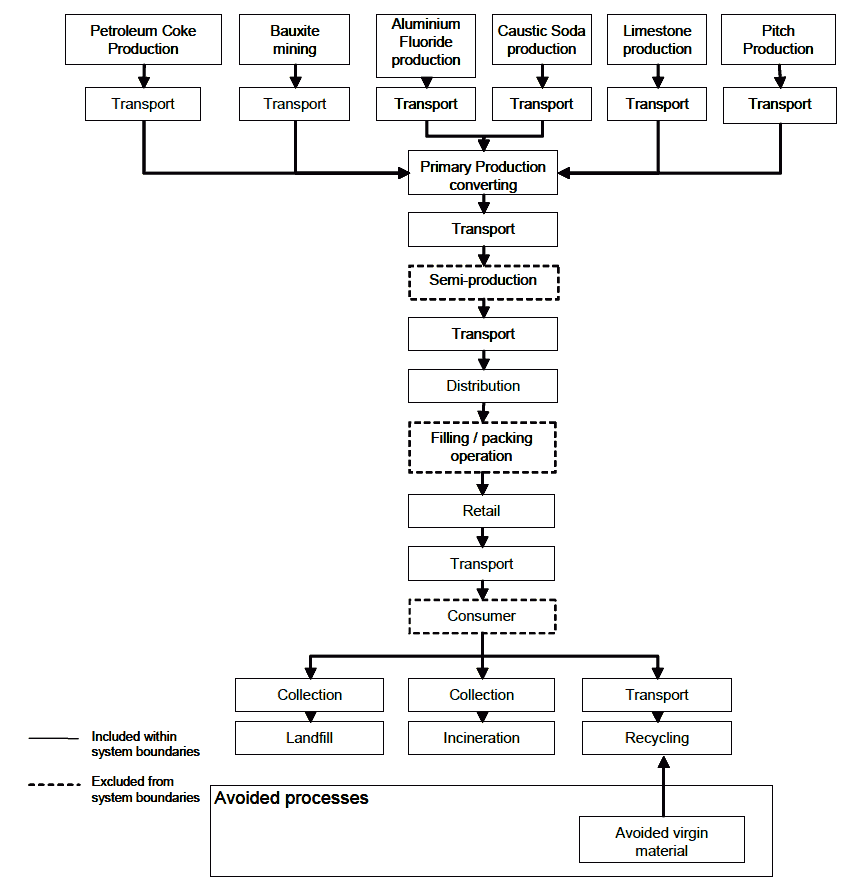
Figure 3 - The Lifecycle of Wood
4.0 The carbon metric weightings
The carbon metric reporting system for recycling performance is intentionally a range of weightings between 0 and 100 based upon the environmental benefit of primary resource displacement, with those with the greatest environmental benefit being ranked 100 proportionally down to the least ranked 0. This gives a ranking based on CO 2 equivalent per tonne for each material returned to a virgin material substitute. There will be waste streams which are assigned an identical carbon metric weighting however there will be different proportions of these materials within the waste stream which will allow stakeholders to consider which materials will provide the greatest environmental benefit when recycled.
The weightings associated with each material are set out in Table 1.
Table 1 - Carbon metric weightings
Waste Stream |
Carbon Metric Weighting |
Waste Stream |
Carbon Metric Weighting |
|---|---|---|---|
Textiles |
100.00 |
Board |
5.83 |
Textiles and Footwear |
84.70 |
Mixed paper and board |
5.68 |
Aluminium cans and foil |
65.87 |
Paper |
5.23 |
Footwear |
31.17 |
Books |
5.23 |
Mixed Cans |
27.80 |
Mineral Oil |
5.15 |
Scrap Metal |
16.07 |
WEEE - Fridges and Freezers |
4.66 |
Steel Cans |
12.25 |
Food and Drink Waste (wet AD) |
4.35 |
PET (incl forming) |
12.12 |
Food and Drink Waste (Composting) |
3.48 |
WEEE - Small |
10.54 |
Batteries (Post Consumer Non Automotive) |
3.46 |
WEEE - Mixed |
9.77 |
Glass (colour separated) |
2.78 |
WEEE - Large |
9.00 |
Mixed Food and Garden Waste (dry AD) |
2.70 |
PS (incl forming) |
8.81 |
Garden Waste (dry AD) |
2.35 |
Wood |
8.70 |
Mixed Food and Garden Waste (Composting) |
2.10 |
Average Plastics |
8.57 |
Garden Waste Composting |
1.81 |
Average plastic rigid (incl bottles) |
8.56 |
Glass (mixed colours) |
1.58 |
HDPE (incl forming) |
8.25 |
Plasterboard |
0.99 |
LDPE and LLDPE (incl forming) |
7.80 |
Aggregates (Rubble) |
0.03 |
Average plastic film (incl bags) |
7.65 |
Furniture |
0.00* |
PP (incl forming) |
6.74 |
Paint |
0.00* |
PVC (incl forming) |
6.31 |
WEEE - Fluorescent Tubes |
0.00* |
*Weightings for these materials and others are to be confirmed through further technical analysis so are currently set at 0.00
5.0 Carbon metric application
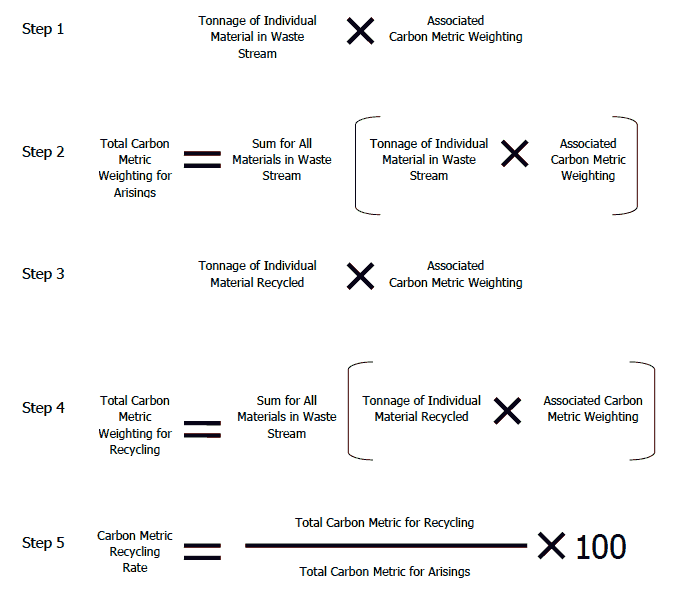
5.1 Basic calculation
In order to calculate the total carbon within the waste stream, an understanding of the composition is required together with the total volume of waste, the amount of each material recycled and the recycling route. Performance monitoring will be based upon the National Waste Composition for MSW in Scotland data developed by Zero Waste Scotland, however individual Local Authorities may opt to use local waste composition data for strategic decision making where this reports the same material types as the National study.
In order to calculate the Carbon Metric Recycling Rate, the following calculations must be applied:
1. Multiply the tonnage of each material in the waste stream by its Carbon Metric Weighting
2. Add the individual totals together to give the Total Carbon Metric Weighting for Arisings
3. Multiply the tonnage of each material recycled in the waste stream by its Carbon Metric Weighting
4. Add the individual total together to give the Total Carbon Metric Weighting for Recycling
5. Divide the Total Carbon Metric Weighting for Recycling by the Total Carbon Metric Weighting for Arisings to give Carbon Metric Recycling Rate
This is shown graphically below:
To assist waste practitioners, a Carbon Metric Calculator is provided as Annex A to this guidance. This has been populated with National Level LACMW Composition Data which can be used to interrogate performance by weight of recyclate and by primary material capture rate.
5.2 The carbon metric reporting system in practice
The following examples show the impact of the Carbon Metric for Recycling Performance. All of these relate to Local Authority Collected Municipal Waste since this is the waste stream where data is currently available, as discussed in Section 2.
5.2.1 Example 1 - strategic decision making
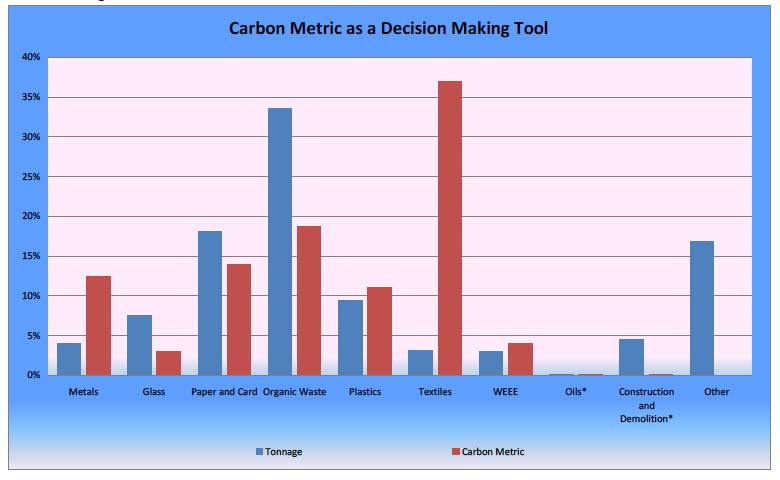
The Carbon Metric will not only be the mechanism used to monitor the performance towards recycling targets set out in the Zero Waste Plan, it will also act as a decision making tool for stakeholders to prioritise their waste management practices in such a way as to provide greatest environmental benefit.
Example 1 shows how the Carbon Metric Reporting System can be used to determine for which materials recycling is most beneficial to the environment and are priorities for extraction through separate collections or mechanical means. It shows that an emphasis on the capture of materials with a higher carbon metric weighting would provide greater contribution to the overall recycling.
Example 1 - Tonnage versus carbon metric contributions to local authority collected municipal waste arisings
5.2.2 Importance of capture rate
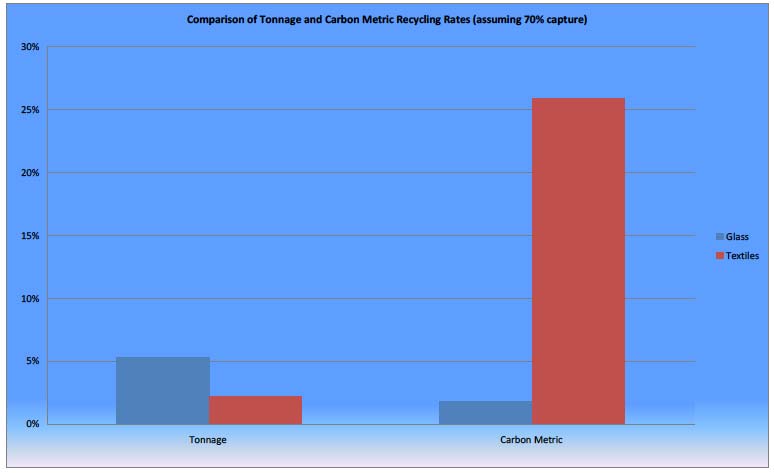
Since the Carbon Metric Reporting System rewards the use of secondary materials that provide greatest environmental benefit, capture rate becomes more important.
The amount of Glass and Textiles within the Municipal Waste Stream in terms of tonnage is 241,000 and 99,000 tpa respectively for 2009/10 however the current capture rates for these materials are very different (43.61% for Glass versus 20.18% for Textiles). Example 2 shows the contribution that each would make to the overall recycling rates should capture rates for glass and textiles be comparable at 70%, if capture rates for other materials are unchanged.
Example 2 shows that the contribution to the recycling rate on a tonnage basis is greater for glass (5.3%) than textiles (2.26%) however when the carbon metric weighting is applied, a capture rate of 70% provides a much greater contribution to recycling for textiles (25.9%) than glass (1.7%).
Example 2 - Comparison of tonnage based and carbon metric based recycling rates
5.2.3 Meeting Zero Waste Plan targets
The Zero Waste Plan for Scotland sets out statutory targets for the recycling and recovery of Scotland's waste.
The following examples highlight how the Zero Waste Plan targets can be met starting with the impact of applying the Carbon Metric Reporting System to the 2009/10 weight based performance levels and then showing how both the 50% tonnage based EU recycling target recycling rate and then the 70% carbon based Zero Waste Plan target recycling rate can be met. It is recognised that, like the carbon metric, the EU target is for household waste and not LACMW, and future analysis will reflect this once sufficient data on household waste is available.
Example 3a shows the impact of introducing the Carbon Metric Reporting System on 2009/10 recycling levels for Local Authority Collected Municipal Wastes.
Example 3a - The contribution of each material stream to 2009/10 LACMW tonnage and related carbon metric recycling rates
Material Stream |
Carbon Metric Weighting |
Contribution to Recycling Rates |
Capture Rate |
|
|---|---|---|---|---|
Tonnage |
Carbon Metric |
|||
Metals |
12-66 |
1.44% |
3.92% |
35.73% |
Glass |
1.5-2.8 |
3.28% |
1.08% |
43.61% |
Paper and Card |
5.2-5.9 |
8.02% |
6.26% |
44.26% |
Organic Waste |
1.8-8.7 |
15.29% |
6.40% |
45.59% |
Plastics |
6.3-12 |
0.68% |
0.82% |
7.16% |
Textiles |
31-100 |
0.62% |
7.47% |
20.18% |
WEEE |
3.4-11 |
1.07% |
1.31% |
36.57% |
Oils |
5.15 |
0.02% |
0.01% |
100% |
Construction & Demolition |
0-1 |
3.19% |
0.01% |
71.23% |
Other |
0 |
2.29% |
0.00% |
13.62% |
Overall Recycling Rate |
35.91% |
27.28% |
- | |
A feasible approach to meeting both the 50% tonnage based EU recycling target recycling rate and the 70% carbon based Scottish Government target recycling rate is to build upon current recycling levels. As shown in Example 3a, the 2009/10 tonnage based recycling was approximately 36% with the carbon based equivalent approximately 27%. This was due to the capture from the residual waste stream of heavier materials such as construction and demolition waste (71.23% captured), organic waste (45.59% captured) and glass (43.61% captured). In contrast those materials which are less dense but carry a much higher carbon impact were not targeted as readily, for example metals (35.73% capture), textiles (20.18% capture), plastics (7.16% capture). By maintaining the capture rates for those more dense materials which have been successfully collected and building on the existing performance of other streams, it is possible to meet the 2020 EU recycling target.
Example 3b displays one method of achieving the EU required target tonnage recycling rate of 50% by 2020. The capture rates highlighted in yellow have been amended to reflect improvements required through source segregated recycling or mechanical extraction. In addition, the capture rate for food waste has been increased in recognition of the mandatory requirement for dedicated food waste collections in 2013 and a landfill ban on source segregated food waste in 2015.
Example 3b - Reaching 50% tonnage based recycling target building on 2009/10 recycling levels
Material Stream |
Carbon Metric Weighting |
Contribution to Recycling Rates |
Capture Rate |
|
|---|---|---|---|---|
Tonnage |
Carbon Metric |
|||
Metals |
12-66 |
2.41% |
6.57% |
60.00% |
Glass |
1.5-2.8 |
3.28% |
1.08% |
43.61% |
Paper and Card |
5.2-5.9 |
10.88% |
8.49% |
60.00% |
Organic Waste |
1.8-8.7 |
20.13% |
8.42% |
60.00% |
Plastics |
6.3-12 |
5.66% |
6.87% |
60.00% |
Textiles |
31-100 |
1.85% |
22.20% |
60.00% |
WEEE |
3.4-11 |
1.07% |
1.31% |
36.57% |
Oils |
5.15 |
0.02% |
0.01% |
100% |
Construction & Demolition |
0-1 |
3.19% |
0.01% |
71.23% |
Other |
0 |
2.29% |
0.00% |
13.62% |
Overall Recycling Rate |
50.78% |
54.97% |
- |
|
Example 3c below displays one approach to achieving the Zero Waste Plan target of 70% recycling by 2025. This builds upon the efforts made to reach a 50% tonnage recycling level shown above by further enhancing the capture rates of those materials with the highest Carbon weightings.
Example 3c - Reaching 70% carbon metric recycling target building on 2009/10 recycling levels
Material Stream |
Carbon Metric Weighting |
Contribution to Recycling Rates |
Capture Rate |
|
|---|---|---|---|---|
Tonnage |
Carbon Metric |
|||
Metals |
12-66 |
3.22% |
8.77% |
80.00% |
Glass |
1.5-2.8 |
4.52% |
1.49% |
60.00% |
Paper and Card |
5.2-5.9 |
12.69% |
9.91% |
70.00% |
Organic Waste |
1.8-8.7 |
23.48% |
9.82% |
70.00% |
Plastics |
6.3-12 |
7.54% |
9.16% |
80.00% |
Textiles |
31-100 |
2.47% |
29.60% |
80.00% |
WEEE |
3.4-11 |
1.07% |
1.31% |
36.57% |
Oils |
5.15 |
0.02% |
0.01% |
100.00% |
Construction & Demolition |
0-1 |
3.19% |
0.01% |
71.23% |
Other |
0 |
2.29% |
0.00% |
13.62% |
Overall Recycling Rate |
60.49% |
70.08% |
- |
|
6.0 How does it compliment current reporting methods?
The Scottish Government is obligated to report recycling performance via Defra to the European Union on tonnage recycled, composted and recovered. This method of reporting will remain and will be managed through the current WasteDataFlow ( WDF) reporting system.
As a Nation, we are still required to work towards the target of 50% recycling/composting of household waste by 2020 as prescribed by the revised Waste Framework Directive. This is, and will continue to be, a weight based target.
The carbon metric reporting system for recycling performance will be used for domestic performance monitoring in relation to the 50%, 60% and 70% targets included in the Zero Waste Plan. Performance against these targets will be calculated by SEPA from the information provided in the WDF returns. Authorities will not be required to calculate this performance on an individual basis.
7.0 Frequently Asked Questions
1 Does this mean that the 50%, 60% and 70% recycling targets within the Zero Waste Plan are now carbon based performance targets?
Yes. All domestic targets for all wastes will be carbon metric based targets. The 2013 and 2020 domestic targets are for household waste and this can only be expressed in Carbon Metric performance terms once more information is available on household waste arisings rather than LACMW. The UK's requirement to meet the EU target of household waste recycling/composting of 50% by 2020 on a tonnage basis remains.
2 What is the unit of measurement for the weighting?
There is no unit of measurement for the weighting system so that there is no need to calculate the actual emissions avoided by recycling. The weighting is a multiplication factor which places highest weighting on the materials with highest GHG emissions from primary resource displacement.
3 Why does the metric not include the full material lifecycle?
The metric is intended to promote recycling and therefore is based upon the portion of primary resource displacement that is common to all materials. There are many factors involved in lifecycle calculation. Those lifecycle stages excluded from the carbon metric calculations are those which vary widely depending on the use of the material; and those which do not materially affect the weighted ranking of materials.
4 What source of data has been used to calculate the environmental impact?
WRAP has undertaken detailed research into the greenhouse gases displaced by the use of secondary materials rather than primary. This has included a range of previously published data on the types of materials currently in use in the UK market and the processing and reprocessing methods used.
5 Will the metric be applied to other wastes?
Yes. The Local Authority Collected Municipal Waste stream has been selected first due to its advanced stage of data reporting, however as reporting improves for other sectors, these will also be required to report performance and to aim to meet the Zero Waste Plan targets for recycling, composting and diversion from landfill.
As indicated in the Zero Waste Plan (Annex A) once better data is available, the Scottish Government will consider the need for specific targets for Commercial & Industrial and Construction wastes.
It is likely that data will be available to allow the recycling performance across all wastes to be calculated in advance of the 2025 70% target.
6 Should I include carbon metric performance monitoring into my waste management contracts?
The majority of waste contracts include mechanisms for reporting contract performance. Traditionally, this has been performance against tonnage based targets, however since Scottish domestic targets are now carbon metric based, it is appropriate for contractors to report accordingly. Notwithstanding the fact that any review that is undertaken is not expected to change weightings to the extent that it will have an impact on decision making, it is not recommended that specific reference(s) are made to carbon weightings in any contract documentation or performance frameworks. Local Authorities are invited to consider including high capture rates for those materials with greatest GHG displacement as advised by the metric weighting system. For example to recover 80% of all Aluminium available by weight, or 70% of textiles.
7 Since the Scottish Government places emphasis on the separate collection and treatment of food waste, why is this not reflected in the carbon metric weighting?
The metric is based upon the displacement of primary resources and is therefore weighted towards inorganic materials. However, since the carbon metric takes account of tonnage recycled combined with the weighting, then those materials with a low carbon metric but high volume (such as food) also contribute as significantly to the targets as those with low volume but high weighting (such as aluminium).
8 The carbon metric weightings have changed significantly since the publication of the Zero Waste Plan. Why is this?
A substantial amount of research has been undertaken by Scottish Government and WRAP since the publication of the Plan. This research has uncovered further data on lifecycle emissions and also further considered which elements should be included and excluded from the metric. This has led to the change in weightings published within this Guidance document which show that the recovery of textiles in particular has a much higher environmental benefit than previously understood.
9 The Zero Waste Plan (section 11.8) stated that it was possible to achieve high levels of carbon-metric based recycling by only collecting 31% of total waste arisings by tonnage. Is this no longer possible?
It is no longer possible to achieve 87% carbon metric recycling by collecting 31% of arisings by weight. As stated in the Guidance, the level of capture (how much material you collect) is key to achieving high levels of carbon-metric based recycling and there are various ways to achieve this. The Carbon Metric Calculator provided with this Guidance should assist in establishing what materials and what levels of capture are required to meet future targets.
8.0 Further information
The Carbon Metric Calculator can be found at: http://www.scotland.gov.uk/Topics/Environment/waste-and-pollution/Waste-1/CarbonMetricCalculator
If you require additional information regarding this guidance please contact the Zero Waste Team on: 0131 244 0655.
This guidance document was produced in partnership with Entec UK Ltd.
Contact
Email: Central Enquiries Unit ceu@gov.scot