National innovation strategy 2023 to 2033
Our vision is for Scotland to be one of the most innovative small nations in the world. This is our ten-year strategy to deliver that ambition. Innovation is a key tool to make Scotland a fairer, more equal, wealthier and greener country.
10. Innovation Scorecard
Vision
The Strategy's four transformational programmes will be designed and delivered to support our vision of Scotland becoming one of the most innovative small nations in the world. To ensure we are making the necessary progress towards that ambition we will track our innovation performance on a number of a key metrics over the next ten years.
We will do this through Scotland's Innovation Scorecard which will track Scotland's innovation performance over time on a set of key indicators against other nations.
Context
The European Innovation Scoreboard provides a starting point for EU-wide comparisons between Scotland and other European regions and nations.[29] EU countries and regions are assessed in four performance groups: Innovation leaders, Strong innovators, Moderate innovators and Emerging innovators. As part of its analysis of Scotland we can see:
i. Scotland's innovation credentials are ranked as 'strong' alongside other nations and regions including Ireland, Norway, Iceland, Austria and the West Midlands, but below those deemed to be innovation 'leaders' such as Denmark, Finland, Belgium, Sweden, and South East England.
ii. Scotland's innovation performance is among the strongest in Europe in a number of areas including skills and education levels in the workforce. Scotland is ranked the top performing country in the OECD in terms of Higher Education investment in R&D as a percentage of GDP.
iii. Scotland has an average level of performance relative to comparable 'strong 'nations and regions on aspects including employment in innovative enterprises, and innovation expenditure per employee.
iv. Scotland falls short relative to comparable 'strong' regions and countries in other areas – business R&D, SME product and processes innovations, and levels of employment in knowledge-intensive activities.
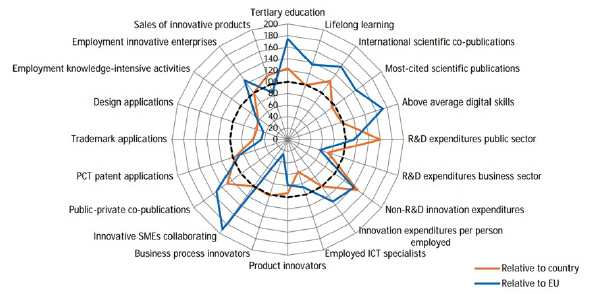
Source: European Commission's Regional Innovation Scoreboard 2021
Approach
The Scottish Innovation Ecosystem is based on an infrastructure of public, private and third sector organisations and a set of existing innovation assets based on Scotland's natural advantages, research specialisms and existing clusters of innovative businesses. These generate opportunities for public and private investment throughout the innovation process which we see in terms of both an innovation pipeline and a wider process of diffusion and adoption across Scotland's business and wider organisational base.
Our Innovation Scorecard will monitor the performance of our innovation ecosystem across each of its elements and stages using the best and most up to date data and evidence available. We will continue to engage across Europe and internationally and seek to learn from others in how we measure and assess our innovation performance and its impacts on the national economy.
While we need to be aware that there are often lengthy time lags until economic impacts emerge from new innovations, and we also need to factor in time to implement and deliver a new strategy, the Scorecard will provide a useful snapshot of the health of the Scottish innovation ecosystem over time.
Innovation Pipeline
Key metrics have been identified for each stage of the innovation pipeline:
- Concept – which aims to track the generation of new ideas both within universities and the private sector
- Convert – which aims to measure the movement of early-stage research towards being closer to market
- Commercialise – which aims to track the realisation of the early economic benefits of innovation
For Concept we have selected patents and collaborations as our key metrics. Patents are traditionally used to track innovation and allow for comparison across different geographies. We have chosen to measure Patents Granted which is a more concrete indicator than applications. We will also track innovation between higher education and the wider economy through monitoring data on academic income from business and community interactions – this is a useful indicator of collaboration.
For Convert we have selected early stage risk capital and spin-outs accessing equity finance as our key metrics. The attraction of investment capital is an effective indicator of innovation that is closer to the market. Although not all deals are innovation driven, this is a strong proxy for innovation as the data shows the top sectors for deals are generally those associated with innovation. We will track risk capital overall and deals below £10 million, early-stage deals, and we will measure both the number and the value of deals. We will also measure the number of university spin-outs which are attracting equity finance and as such are likely to be high-growth start-ups.
Source: Scottish Enterprise, June 2021, Investing in Ambition: Scotland's Risk Capital Market in Context
For Commercialise, we have selected BERD jobs and high growth businesses. Whilst the number of BERD jobs may be small (as it is in other countries), there is a common understanding that there are large multipliers around these jobs for other professional occupations in innovating companies. We will also monitor the numbers of high growth businesses. These companies generate disproportionate jobs and innovation and are key to economic transformation. Finally, we will measure later stage investment (venture capital) which is an indicator that the projects behind the deals in question are seen by investors to offer strong opportunities for returns.
Manufacturing and Supply Chain - in addition, we will track the number of manufacturing jobs within each of our cluster priorities, drawing out rich data to include high value jobs, skills spending and apprenticeship numbers.
Diffusion and Adoption
The Innovation Scorecard will track 'diffusion and adoption' across the business base by measuring the percentage of innovation-active businesses and overall levels of research and development 'investment'.
The measure of innovation active businesses follows the OECD definition of innovation and assesses the following activities, within the survey period:
1. the introduction of a new or significantly improved product (good or service) or process;
2. engagement in innovation projects not yet complete, scaled back, or abandoned;
3. new and significantly improved forms of organisation, business structures or practices, and marketing concepts or strategies;
4. investment activities in areas such as internal research and development, training, acquisition of external knowledge or machinery and equipment linked to innovation activities.
A business that had engaged in any of the activities described in points 1 to 3 is defined as being 'innovation-active'. A business that
had engaged in any of the activities described in points 1 to 4 is defined as a 'broader innovator'. Finally, any businesses that had engaged in the activity described in point 3 were classed as a 'wider innovator'.[30]
We are also interested in measuring the adoption of innovation in the public sector. There is not currently a suitable available metric for measuring innovation in the public sector, but we will work with key stakeholders and learn from international best practise to pursue this ambition over the course of the Strategy's ten-year lifecycle.
For Investment we will monitor Expenditure on Research and Development from the innovation triple helix – industry, academia, and the public sector. We will track this for business and higher education and at an overall level (also including government investment) as a percentage of GDP to allow international comparisons. (N.B. these indicators are currently being reviewed by the Office for National Statistics following a significant initial revision to the method used to collect the data.)
Diversity and Inclusion
As part of the Scorecard, we will also develop suitable metrics to capture and assess participation and impact in the innovation ecosystem including data on equalities, diversity and inclusion. This will include access to finance, funding, jobs and opportunities. We will ensure that the Strategy's programmes are developed with diversity and inclusion at their heart and that suitable metrics and indicators are utilised to monitor this.
Action
14. We will publish an annual Innovation Scorecard.
The initial framework for this scorecard is shown in the table on page 68.
| Ecosystem |
Tracking |
Metrics Used In Scorecard |
Current Performance |
Comparison |
Progress Since Last Year |
|---|---|---|---|---|---|
| Concept |
The generation of new ideas within universities and the private sector. |
1. Patents granted 2. Academic Income from Business and Community Interactions |
|
|
|
| Convert |
The movement of early-stage research to being closer to market. |
3. Risk capital (deals under £10 million) 4. BERD jobs (as a percentage of 16-64 labour force) |
|
|
|
| Commercialise |
The realisation of the early economic benefits of innovation. |
5. High growth businesses 6. Later-stage equity (deals £10 million and over) |
|
|
|
| Adoption |
Organisations that are adopting innovation and have become innovation-active. |
7. Percentage of innovation-active businesses |
|
|
|
| Investment |
Expenditure on research and development. |
8. GERD as a percentage of GDP 9. BERD as a percentage of GDP 10. HERD as a percentage of GDP 11. GovERD as a percentage of GDP |
|
|
|
| Investment |
|
|
World-leading Life Sciences innovation in Dundee
In 2014 Dundee was named as the UK's first City of Design by the United Nations. The City has been recognised by UNESCO for its diverse contributions to fields including medical research, comics and video games. Dundee was added to the UNESCO grouping of "creative cities" alongside European cities Turin, Helsinki, Bilbao and Curitiba in Brazil. The title recognised the design innovations which Dundee has contributed to the world, including aspirin, biomedical research which has led to hundreds of new cancer drugs, orange marmalade and video games including Lemmings and Grand Theft Auto.
Dundee is a vibrant location for education, research, and enterprise that is harnessing scientific discoveries to address local and global health challenges. It has world-renowned capabilities in life sciences research that is boosting UK life sciences competitiveness and growing the regional economy.
Dundee has an exceptional track record in life sciences and health technology commercialisation and in securing international venture capital investment to support it. Commercial successes include:
- Exscientia, a world leader in Artificial Intelligence-driven drug discovery and design that underwent a £0.5 billion IPO in 2021.
- Amphista Therapeutics, a global leader in the development of next-generation targeted protein degrader therapeutics; and
- Current Health, developed by CEO Chris McCann while studying at the University School of Medicine, delivers world leading remote patient monitoring to propel home-based care models.
Based on these strengths and successes, Dundee University is spearheading a step-change in life sciences R&D by creating a Life Sciences Innovation District. This will grow the biomedical cluster and, crucially, provide the physical infrastructure and support to anchor and scale high growth life sciences companies in the city for benefit of the regional economy. The first stages, the building of an Innovation Hub for spinout companies and a facility for MedTech innovation, are already underway.
Together with exciting developments at the James Hutton Institute, at the outskirts of Dundee, in agricultural and environmental science and in advancing food and ecological security, the Life Sciences Innovation District Dundee makes Dundee a go-to place for Life Sciences innovation and R&D. The inward investment will create hundreds of quality jobs for school leavers and graduates in the region and will be an exemplar of how exceptional science can drive the Scottish economy.
Contact
Email: Innovation@Gov.Scot