Scotland's Devolved Employment Services: statistical summary February 2023
This publication presents statistics for Fair Start Scotland (FSS) from April 2018 to December 2022 and experimental statistics on the No One Left Behind strategic approach to employability delivery, reporting on those receiving support from April 2019 to September 2022.
Fair Start Scotland (FSS)
Introduction
FSS is the Scottish Government's devolved employability support service, and aims to help those further from the labour market move into and sustain fair work. FSS launched on 3 April 2018 with funding to support up to 38,000 people into work over an initial three year referral period to end March 2021. In response to the economic impacts of the COVID-19 pandemic, referral into the service has been extended to March 2023.
FSS provides individualised one-to-one support to unemployed people who face the greatest challenges to obtaining work, including people with a disability or health condition, people with convictions, care-experienced young people, single parents, refugees, ethnic minorities, and people who live in some of the most deprived areas in Scotland. More information about the service can be found on mygov.scot - get help to find a job.
FSS is delivered by a mixed economy of public, private and third sector providers across nine geographical areas throughout Scotland. Potential participants can engage with FSS in a variety of ways. A referral can be made by an individual's Jobcentre Plus (JCP) Work Coach. Alternatively, participants can be signposted to FSS through third party organisations or they can self-refer to their local provider if they meet specific criteria. Third-party referrals relate to referrals from outwith JCP.
After a referral is made, the participant is matched with a provider in their local area. The provider makes contact and offers an introduction in which the service is fully explained. The participant is then given the necessary information to engage with FSS.
Following the extension of FSS beyond the initial three year period, people who have previously received support can re-join the service. As a result, the total number of starts in years 1 to 3 equals the number of people but from year 4 onwards and thus overall, the total number of starts is not the same as the number of people who have received support.
This report refers to the following groups throughout:
- People – unique individuals counted only once. Therefore, if a participant has joined the service more than once, they will only be counted once under the people metric.
- Starts – number of starts on the service. As people can now re-join, the number of starts may not equal the number of unique people. For example, if a participant has joined the service on two separate occasions, this will be counted twice under starts but only once under people.
- Re-joins – refers to starts that are not first time starts. It should also be noted people may re-join more than once. The sum of the people metric and re-joins equals the number of starts on the service.
Most of the statistics in this report cover the period since FSS was launched in April 2018 up until the most recent quarter (October – December 2022). However, for some data items such as job outcomes, it is more appropriate to only consider those participants where enough time has passed that we have complete data. This varies depending on the metric but is noted within the relevant sections of the report.
See the background section for further details.
How many FSS referrals and starts have there been?
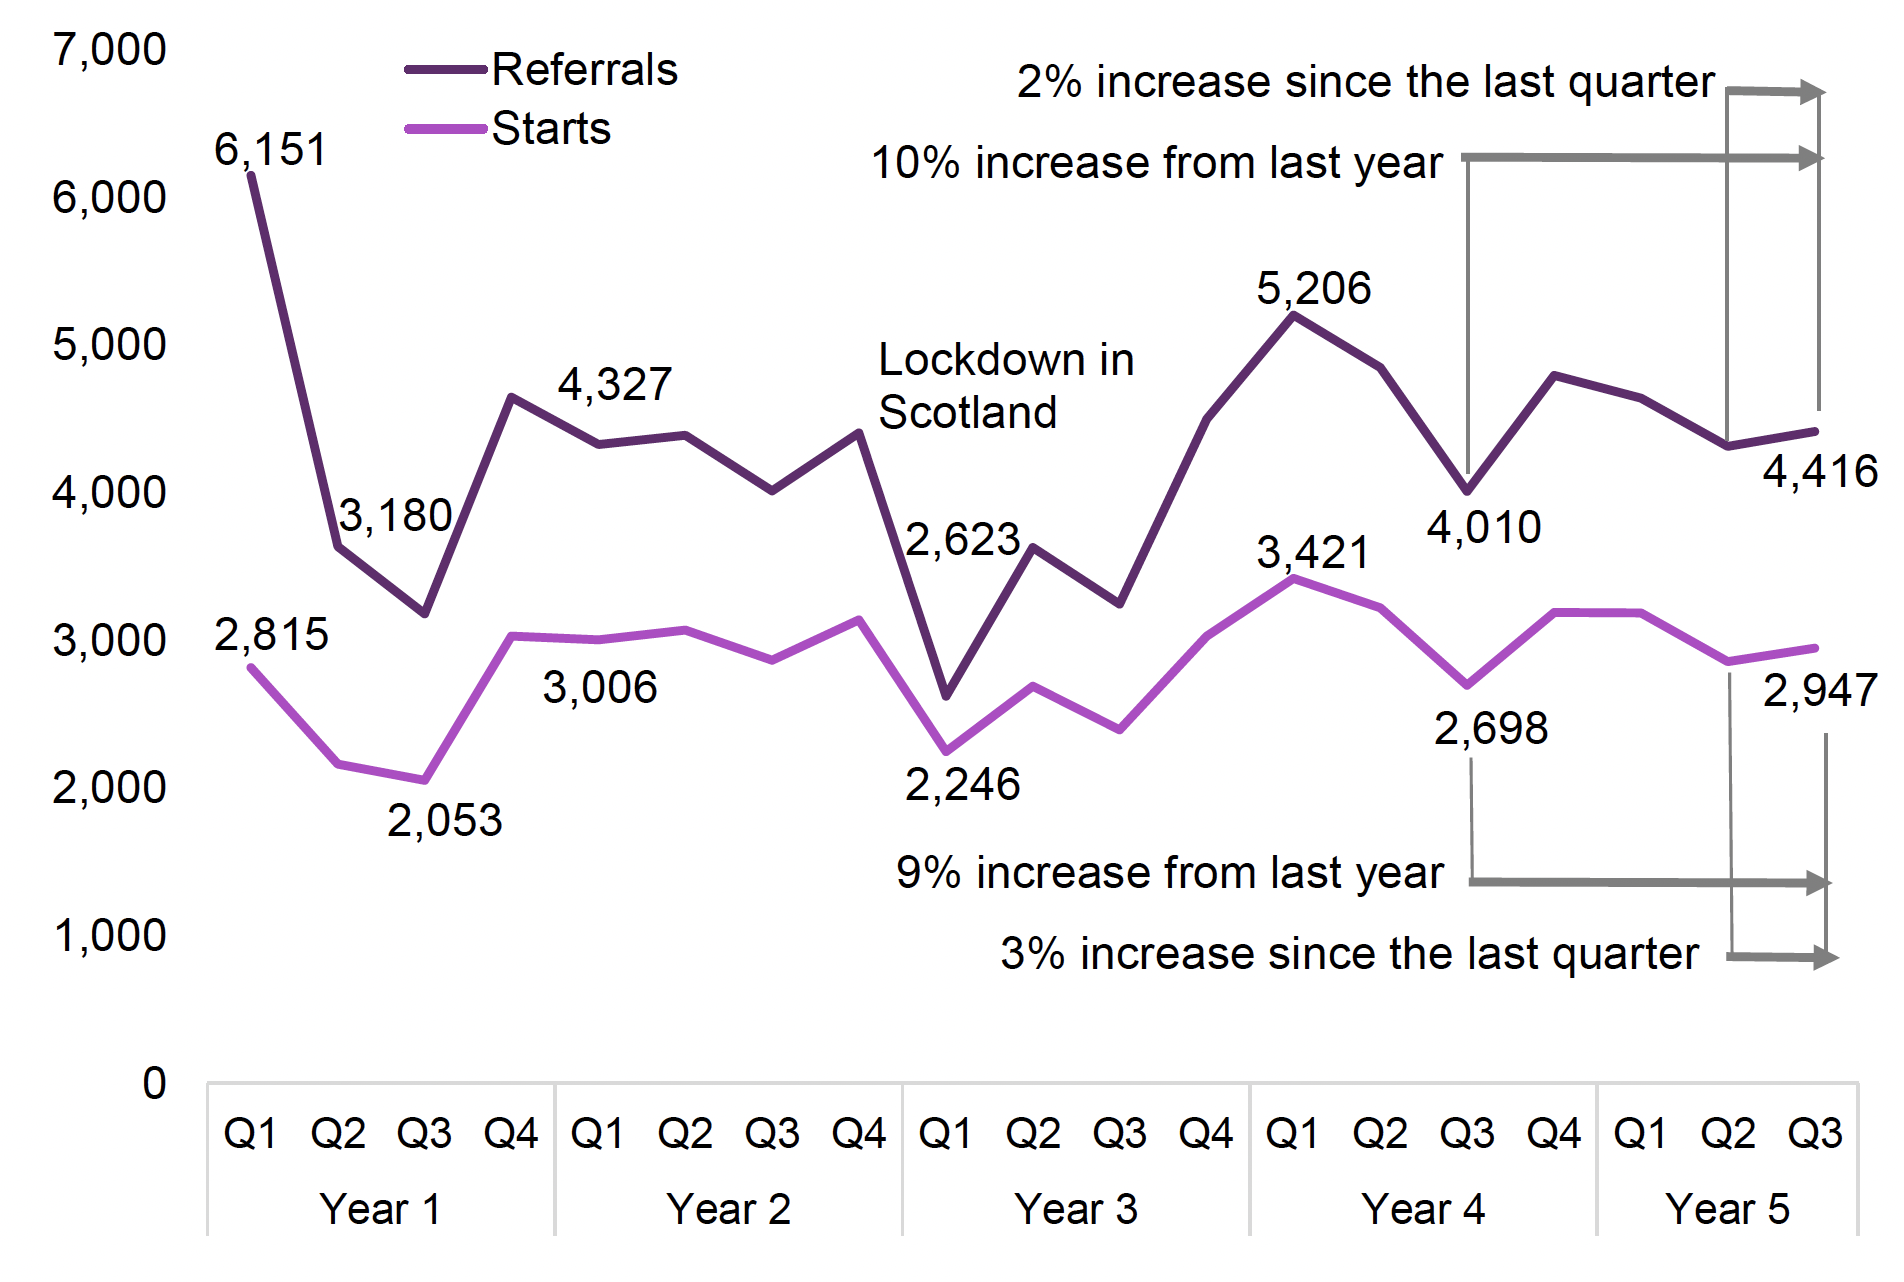
There were 80,992 referrals to FSS between its launch in April 2018 and the end of December 2022. Of the total referrals to FSS, 54,030 started receiving employability support. This includes 3,899 re-joins to the service from participants that have previously been supported by FSS.
Referrals and starts peaked in April – June 2021 following the lows observed during lockdown. While there has been a decrease from this high point, referrals and starts are at similar levels observed pre-pandemic (See Background Information section on the impact of COVID-19). Referrals have risen by 2% to 4,416 this quarter and starts by 3% to 2,947. Compared to the equivalent quarter in 2021, referrals have increased by 10% and starts by 9%.
Who are the people that have joined FSS?
Of the 54,030 FSS starts, 50,131 people have started on the service, with the difference reflecting participants re-joining the service. The following breakdown of equality groups are based on the characteristics of those 50,131 people when they first joined FSS.
Gender
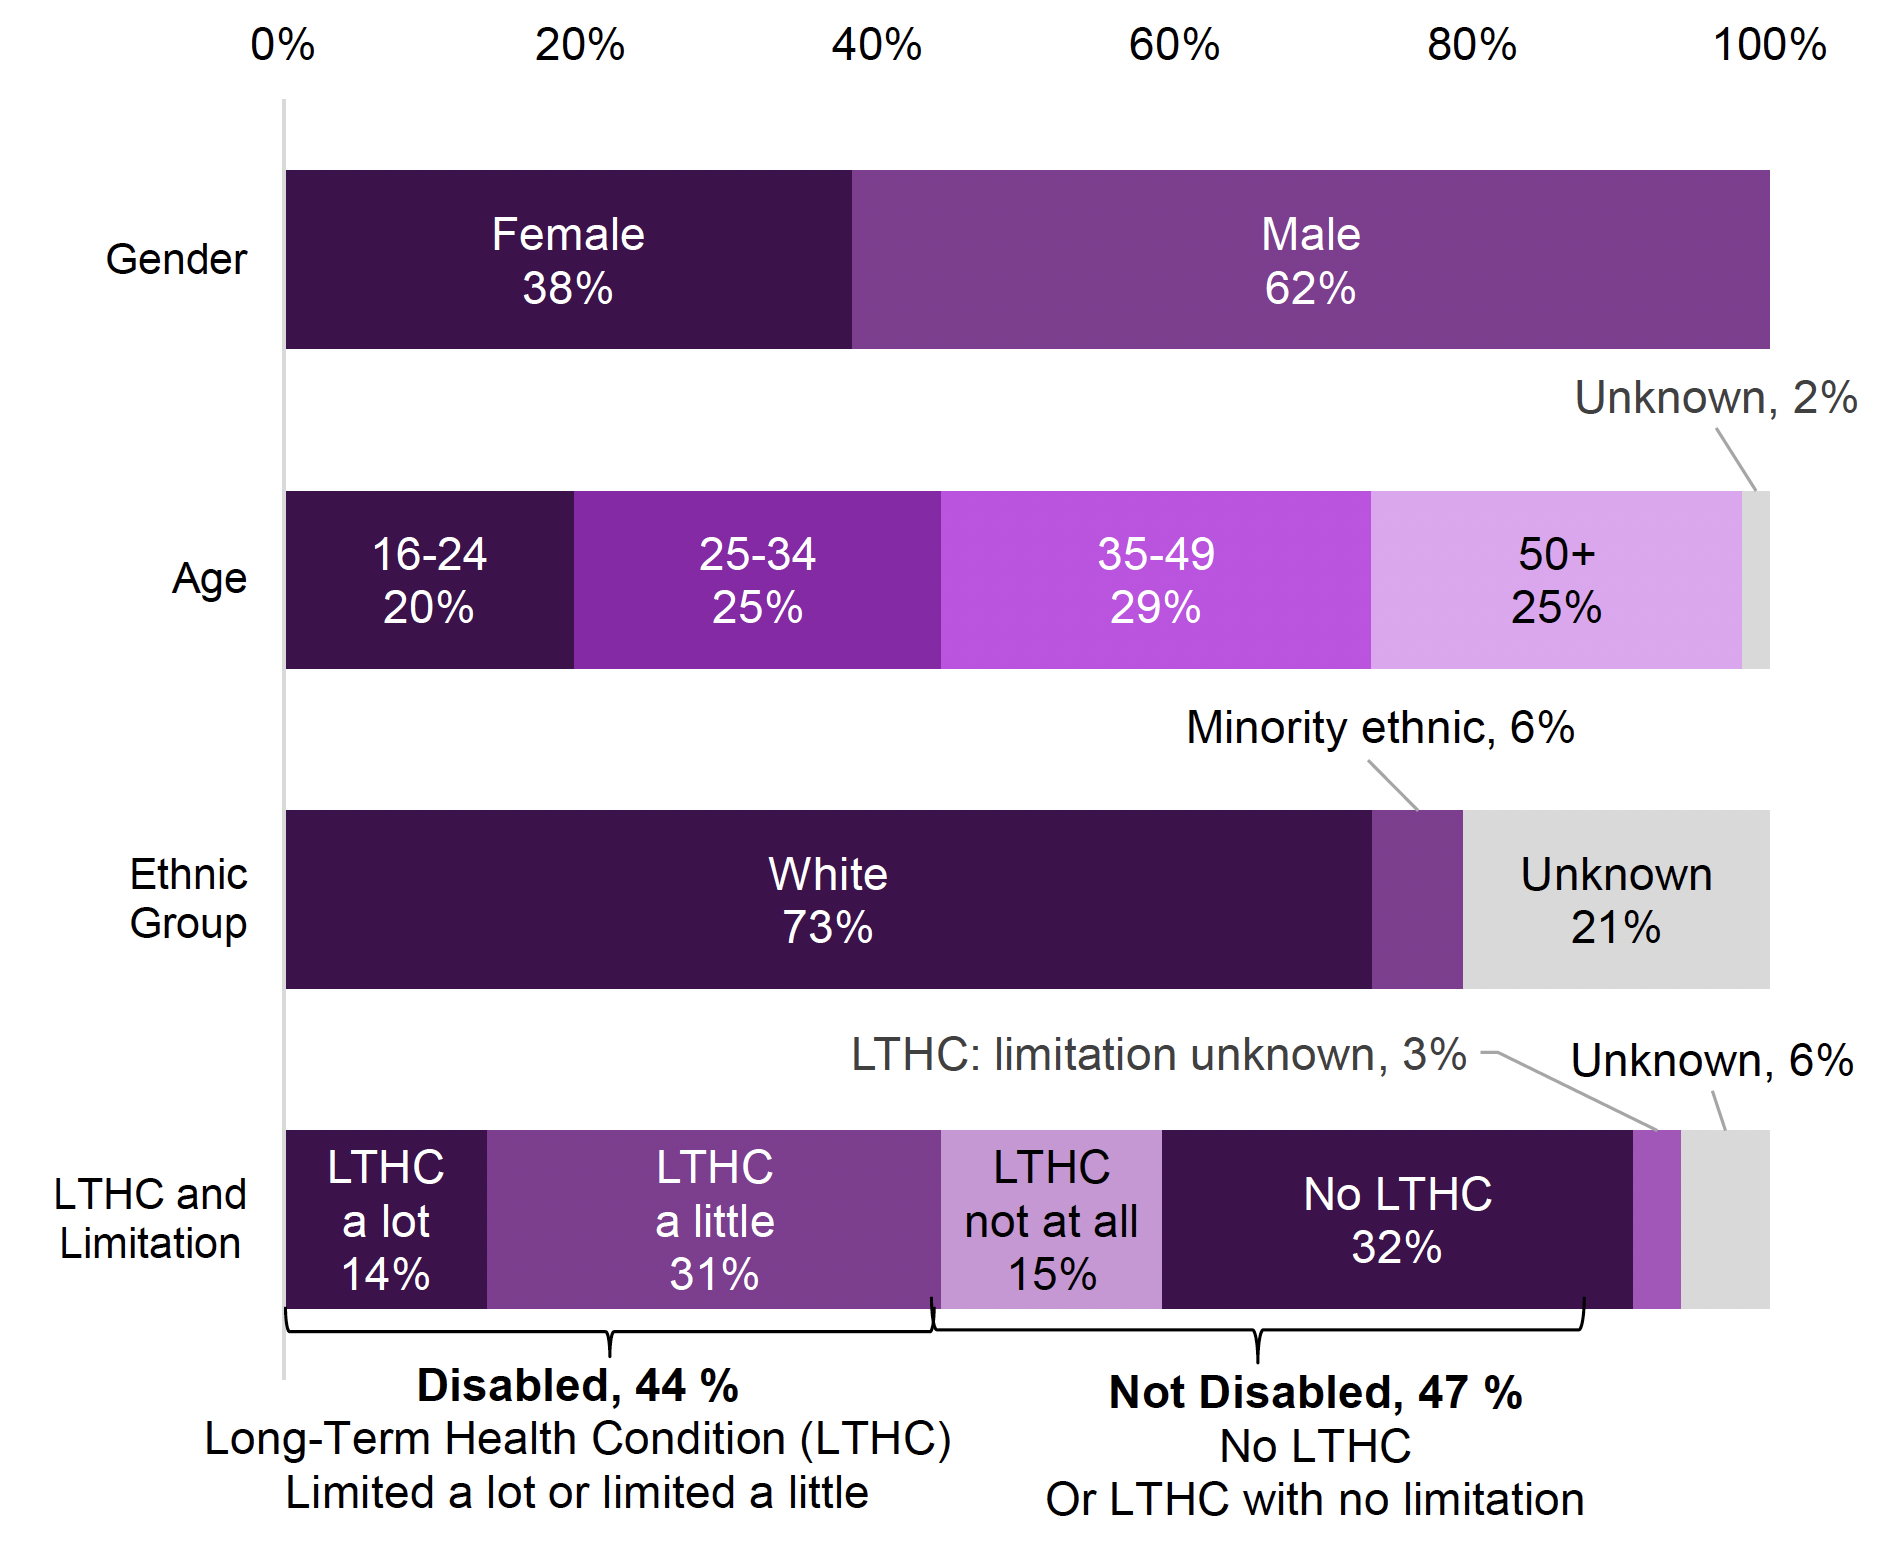
Most people joining FSS are male (62%) while 38% are female. However, there is evidence that this gap is narrowing. The proportion of females in FSS has increased from 35% in year 1 to 40% in year 4. In the most recent quarter of year 5 (October – December 2022), 44% of participants were female, the highest proportion in a single quarter to date.
Age
The most common age group of people joining FSS is 35-49 years (29%), followed by 50 years old & over and 25-34 years (both at 25%). The lowest proportion of people are in the 16-24 years old age group (20%).
Over the course of years 1 to 3, there was an increase in the proportion of participants from the youngest age group (16-24), from 16% to 25%. In year 4 however there was a reversal, with the proportion falling to 16%. In the most recent quarter, the proportion was 18%.
For the oldest age group, 50 years old & over, the proportion has followed a reversed trend to that observed in the youngest age group. In years 1 to 3, it decreased from 30% to 20% but in year 4 increased to 27%. In the most recent quarter, the proportion was 22%.
Figure 2: Breakdown of people starting FSS by equality characteristic group, April 2018 to December 2022
Ethnicity
Overall, 6% of people who have joined FSS were from minority ethnic backgrounds and 73% were white, with ethnicity unknown for the remaining 21% of participants.
In the most recent quarter 12% of participants were from a minority ethnic group and 82% of participants were white. Monitoring changes to the proportion of minority ethnic participants over time is difficult due to the high proportion of unknowns, and there is ongoing work to improve data quality and collection.During the first Covid-19 lockdown, FSS service delivery moved to over the phone or online which impacted on the collection of equalities data. There has been subsequent work with FSS service providers to maximise response rates. Please see the Data Quality section in the Background Information for more details.
So far in year 5, the proportion of unknowns is 7% and was 5% in the most recent quarter. This has followed improvements observed in year 4 where unknowns were at 13% compared to higher proportions in the earlier years of the service (year 1: 17%, year 2: 31%, year 3: 29%).
Disability
Disability is defined based on answers to two questions related to long-term health condition (LTHC) and ability to carry out activies. Please see background information for more detail.
Overall, a similar proportion of FSS participants have reported a disability (44%) as reported not having a disability (47%), while this was unknown for the remaining 9%. The proportion of disabled participants has varied across years with the highest proportion (55%) in year 1 and the lowest (32%) in year 3, where an impact on the collection of equalities data in general was observed following the move away from face to face service delivery due to Covid-19. There may also have been a direct impact from Covid-19 policies such as shielding. In year 4, the proportion of disabled participants increased to 47%. In year 5 to date, the proportion of disabled participants is 45% though it was lower in the most recent quarter at 40%.
Long-Term Health Conditions
Overall, 62% of people joining FSS reported having a LTHC, 32% reported no LTHC, with 6% being unknown. In year 5 to date, 56% of people have reported a LTHC, though this was lower in the most recent quarter at 51%.
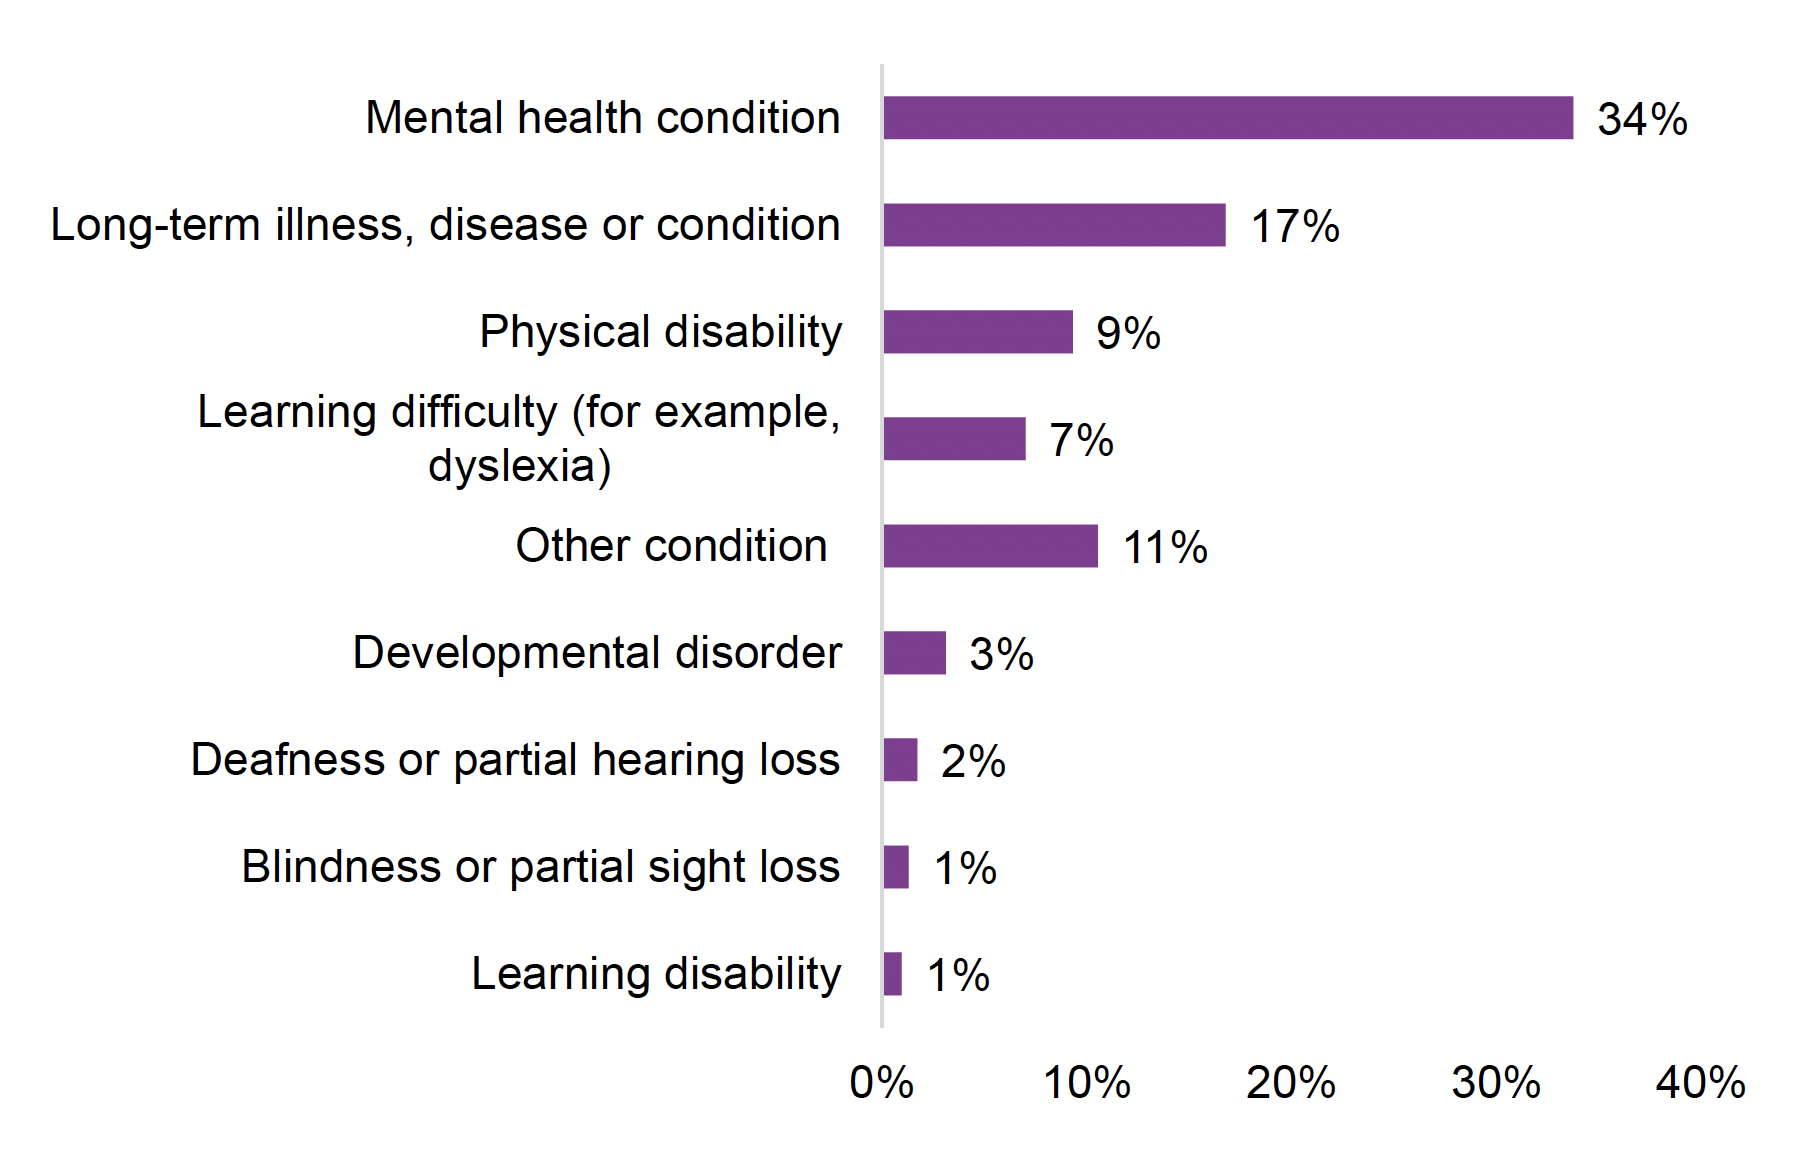
There are many LTHC that may impact upon a person's ability to gain and maintain employment without additional support and participants may have and report more than one LTHC. The most commonly reported LTHC by participants joining FSS was a mental health condition (34%). While the proportion of people reporting a mental health condition has fluctuated, from 31% in year 1 to 36% in years 2 and 3, it has remained the most widely reported condition. See figure 2 for a breakdown of the most commonly reported LTHC by FSS participants.
Parents
Annual data on FSS participants that are parents was first published in May 2021. From the August 2022 statistical publication quarterly parent data for FSS participants has been published, covering year 5 onwards.
Of people joining FSS for the first time 10,393 were parents, while there has been 11,247 total parent starts on the service since its launch in April 2018, including re-joins.
Cumulative totals should be interpreted with caution and comparison of data between years is not possible due to the way the collection has developed over time. See background information for more details.
In the latest quarter, of the 813 parent starts on FSS there were 722 people who were parents accessing FSS support for the first time. These 722 parents represented 29% of all 2,511 people accessing FSS support for the first time in this quarter. This is the highest quarterly proportion in year 5 to date (April – June 2022: 26%, July – September 2022: 27%).
Of the 722 parents in the most recent quarter, the following groups were observed in terms of parents and those from families at highest risk of being affected by child poverty (see background information for more detail):
- 34% were disabled,
- 38% were lone parents,
- 2% were mothers aged under 25,
- 20% were parents with three or more children,
- 38% had a child aged under 12 months, and,
- 17% were from a minority ethnic background.
Reach of service
The Year 3 evaluation of the service, covering the period April 2020 to March 2021, showed that; women, people from minority ethnic backgrounds, young people (16-24 years) and 50-64 year age groups were under-represented on the service when comparing participants accessing support during the third year of FSS with the unemployed population of Scotland. Meanwhile, a higher proportion of disabled people and people aged 25-34 accessed support compared to the overall unemployed population of Scotland.
These findings were consistent with both the Year 1 and Year 2 evaluations of the service, covering 2018/19 and 2019/20 respectively, for gender, ethnic group and disability. Prior to year 3 it was found that all younger age groups (16-34, rather than just 16-24) were under-represented when compared against the overall unemployed population of Scotland.
How many FSS early leavers have there been?
Someone is defined as having left FSS early (an 'early leaver') if they leave FSS before the end of the pre-employment support period and without having sustained employment for at least 3 months. The pre-employment support period usually lasts for up to 1 year but can last up to 18 months in some cases. However this has only applied to a small number of people to date.
There have been 25,590 early leavers from the 54,030 FSS starts (includes 3,899 re-joins). As time goes on we get a more complete picture of the proportion of starts on the service that stay on FSS or leave early.
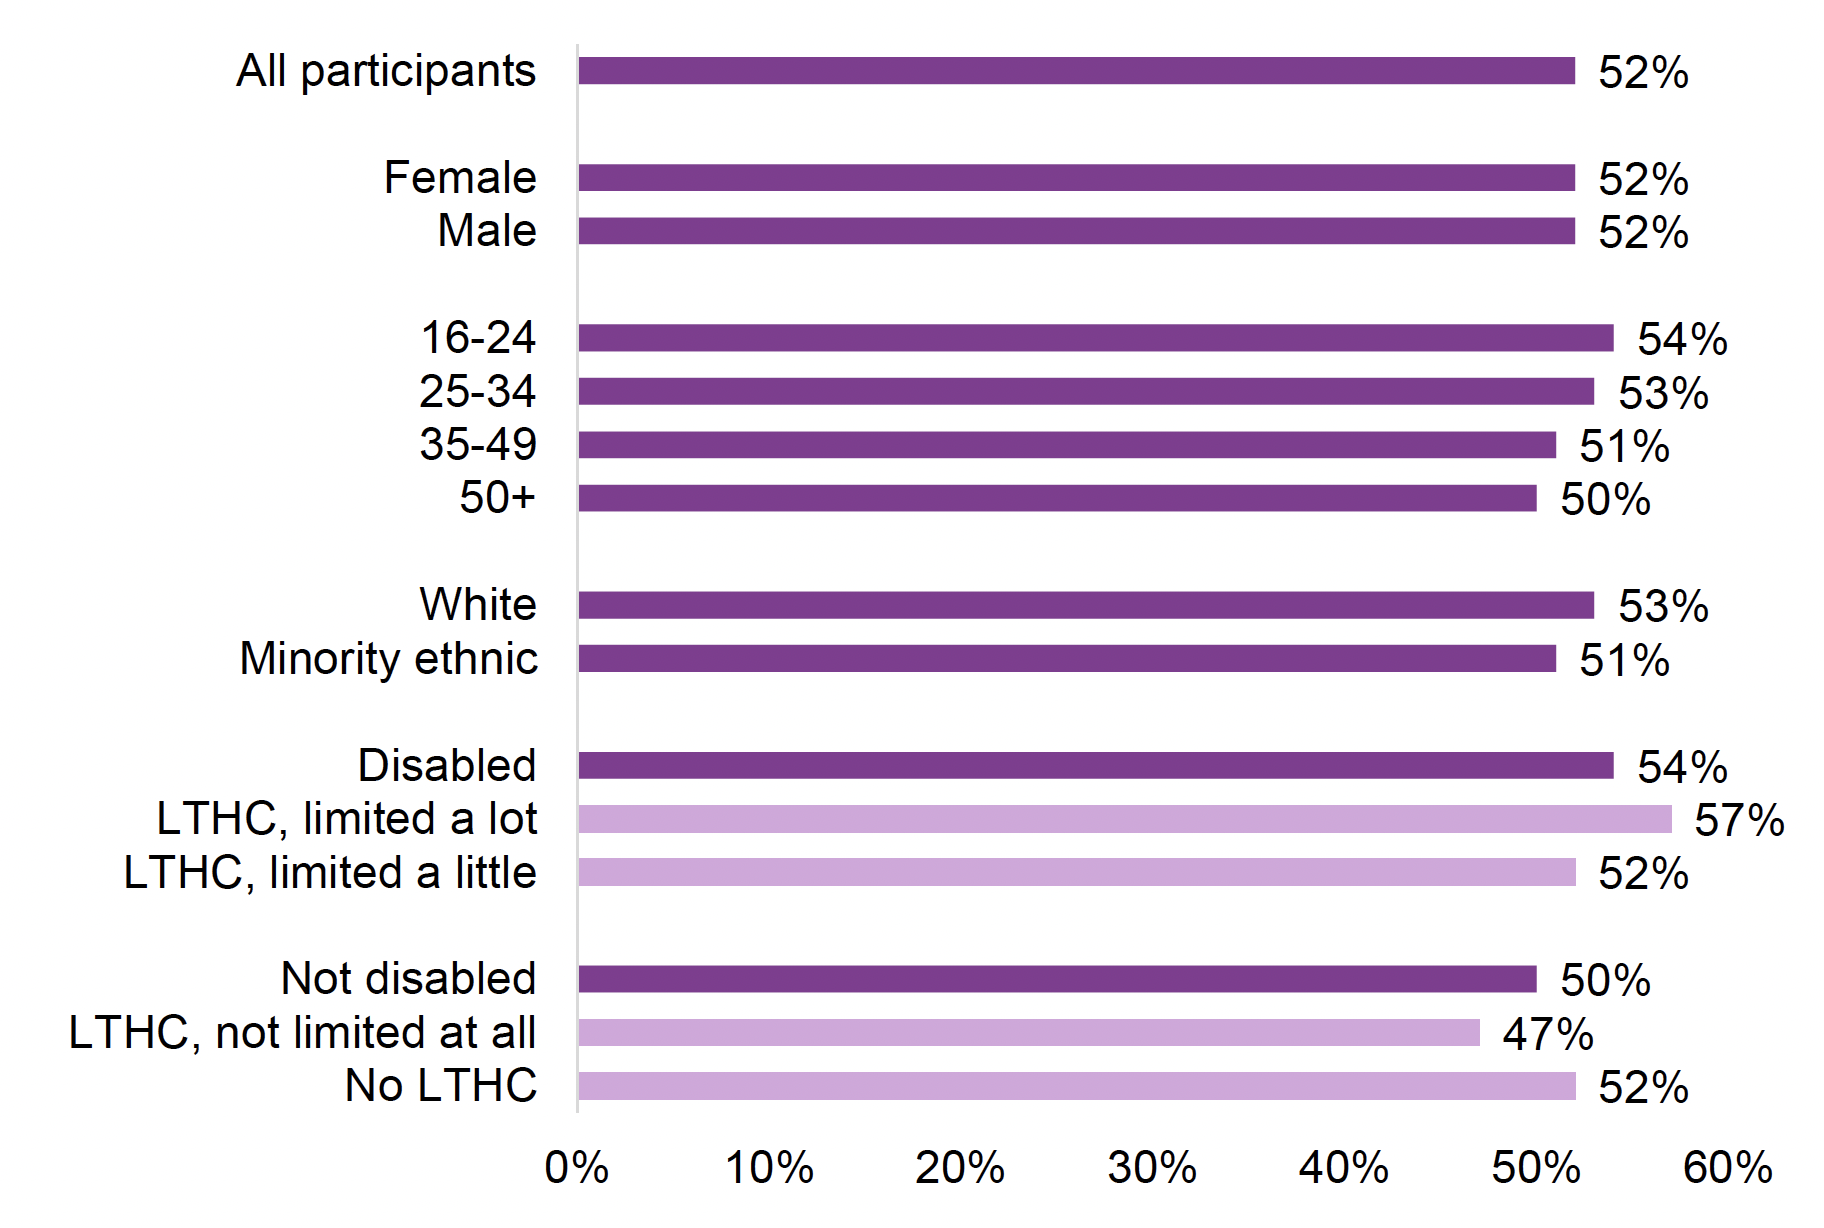
Where we have a complete picture, based on participants with a start date one year or longer, 52% of starts have left early. This rate is based on 21,764 early leavers from a cohort of 41,849 starting between the period April 2018 and December 2021 (including 1,864 re-joins). There was a reduction in early leavers between years 1 and 2 from 53% to 46%, however in year 3 this increased to 52% and in the first three quarters of year 4, 58% of participants have left FSS early.
Figure 4 shows the percentage of starts leaving early across each of the equalities groups. The percentage of early leavers was higher for those reporting a disability, particularly for those who have a LTHC that limits daily activities a lot (57%); compared with those with a LTHC that did not limit daily activities at all (47%). Younger participants also had higher early leaver rates: 54% of those aged 16-24, compared with 50% of those aged 50 & over.
How many FSS starts entered and sustained employment?
There has been a total of 18,819 job starts from the 54,030 FSS starts, including the 3,899 re-joins to the service, since the launch of FSS.
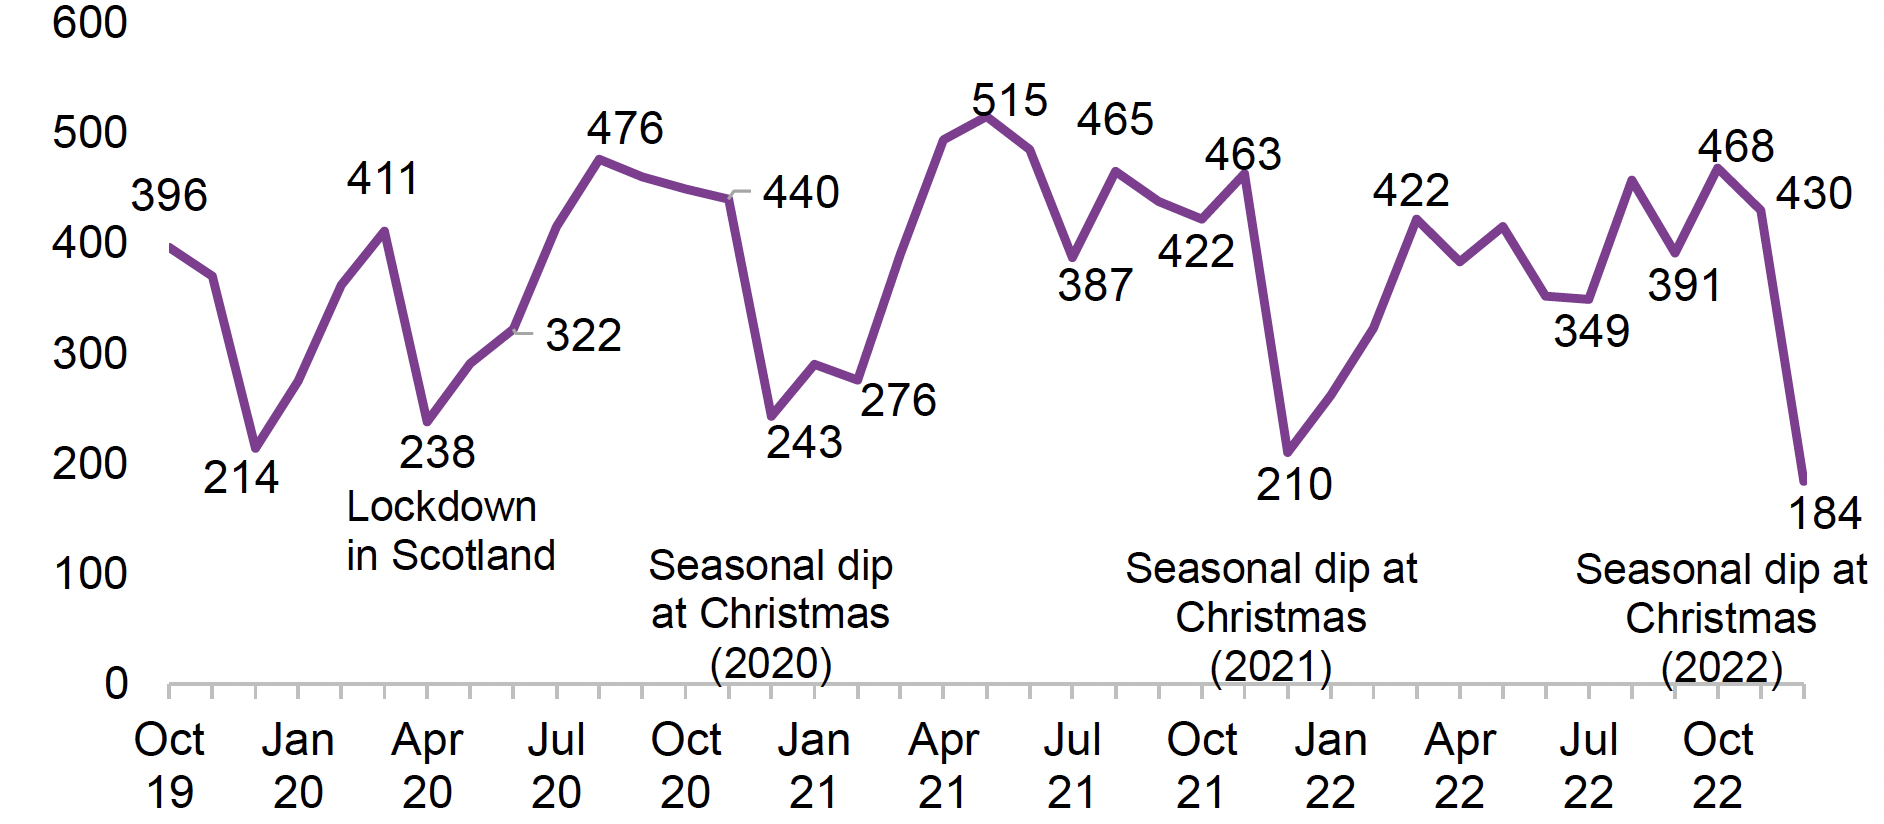
Figure 5 shows both the impact of Covid-19 restrictions beginning in March 2020 and the regular seasonal decline observed each Christmas with subsequent increases in the new year. There can be significant variation in the number of job starts by month with the highest number of job starts in any one month in May 2021 (515), the only time monthly job starts have surpassed 500. In the last quarter job starts rose to 468 in October before sharply falling to 184 in December, however, it is important to be cautious when interpreting data for the most recent months as there can be delays between a participant starting a job and it being recorded by service providers. In addition, job starts tend to be lower in December.
Of the 18,819 job starts, so far 12,687 had sustained employment for at least 3 months (13 weeks), 9,586 sustained employment for at least 6 months (26 weeks), and 6,470 sustained employment for at least 12 months (52 weeks), as of December 2022.
Job outcome rates can only be reported for start cohorts where enough time has passed in pre-employment support and for outcomes to be achieved, therefore the number of participants and time periods included differ by outcome type. The following table summarises this for each outcome type.
| Outcome | Time period of starting on service | Participants | Re-joins |
|---|---|---|---|
| Job Starts | April 2018 to December 2021 | 41,849 | 1,864 |
| 3 month job outcome | April 2018 to September 2021 | 39,151 | 1,339 |
| 6 month job outcome | April 2018 to June 2021 | 35,928 | 689 |
| 12 month job outcome | April 2018 to December 2020 | 29,478 | 0 |
For start cohorts where enough time has passed in pre-employment support and for outcomes to be achieved, job outcome rates show:
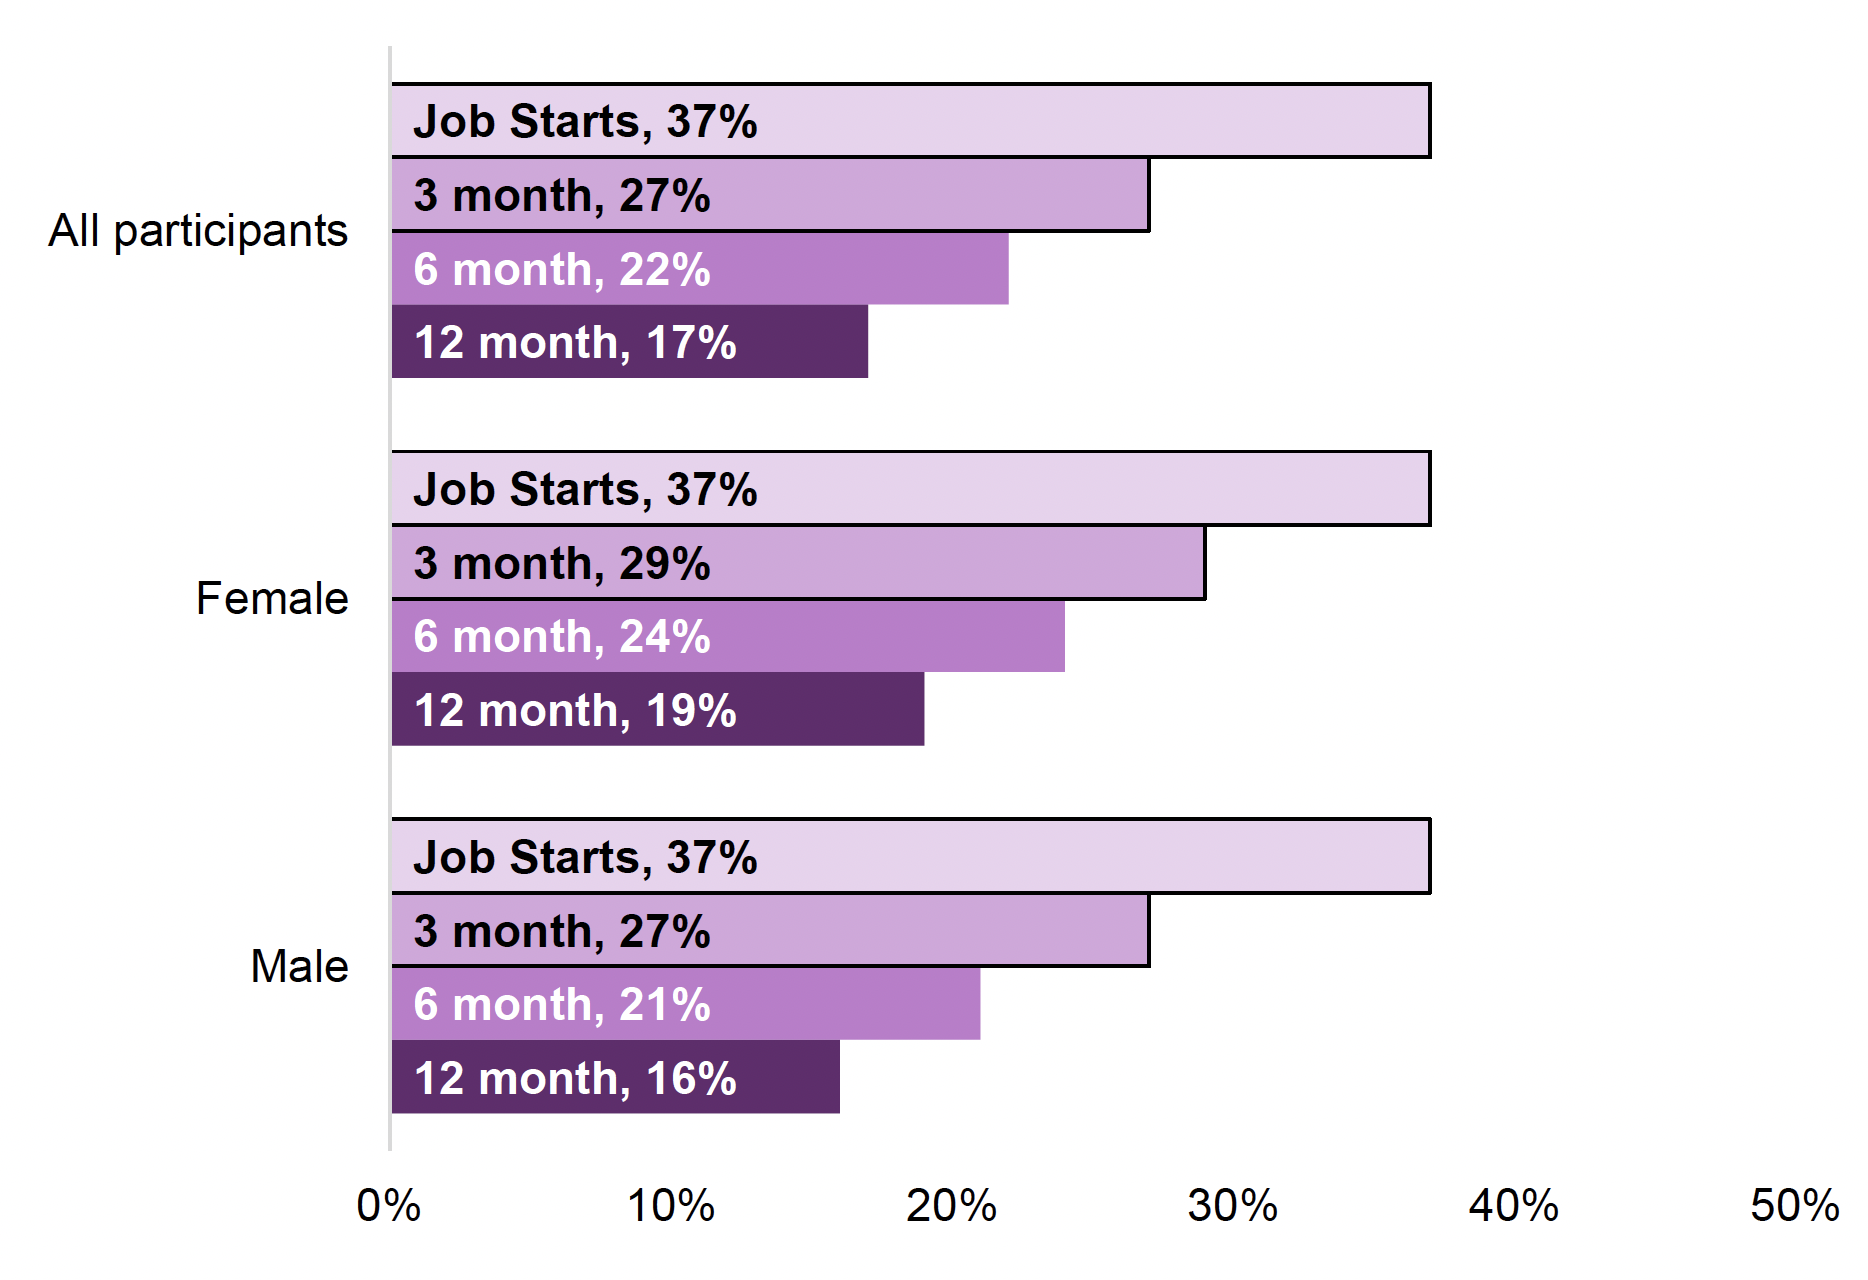
- Most FSS starts did not enter work or go on to sustain employment: 37% started a job, 27% sustained employment for 3 months, 22% sustained employment for 6 months, and 17% sustained employment for 12 months however,
- a high percentage of job starts are sustained: 73% of FSS starts that entered employment went on to sustain employment for 3 months, 81% of those who sustained employment for 3 months went on to reach 6 months, and 77% of those who sustained employment for 6 months went on to reach at least 12 months.
Gender
Whilst the job start rate is the same for males and females at 37%, slightly higher rates for each job outcome were achieved by female starts: 29% of female starts and 27% of male starts achieved a 3 month job outcome, 24% of female starts and 21% of male starts achieved a 6 month job outcome and 19% of female starts and 16% of male starts achieved a 12 month job outcome.
Age
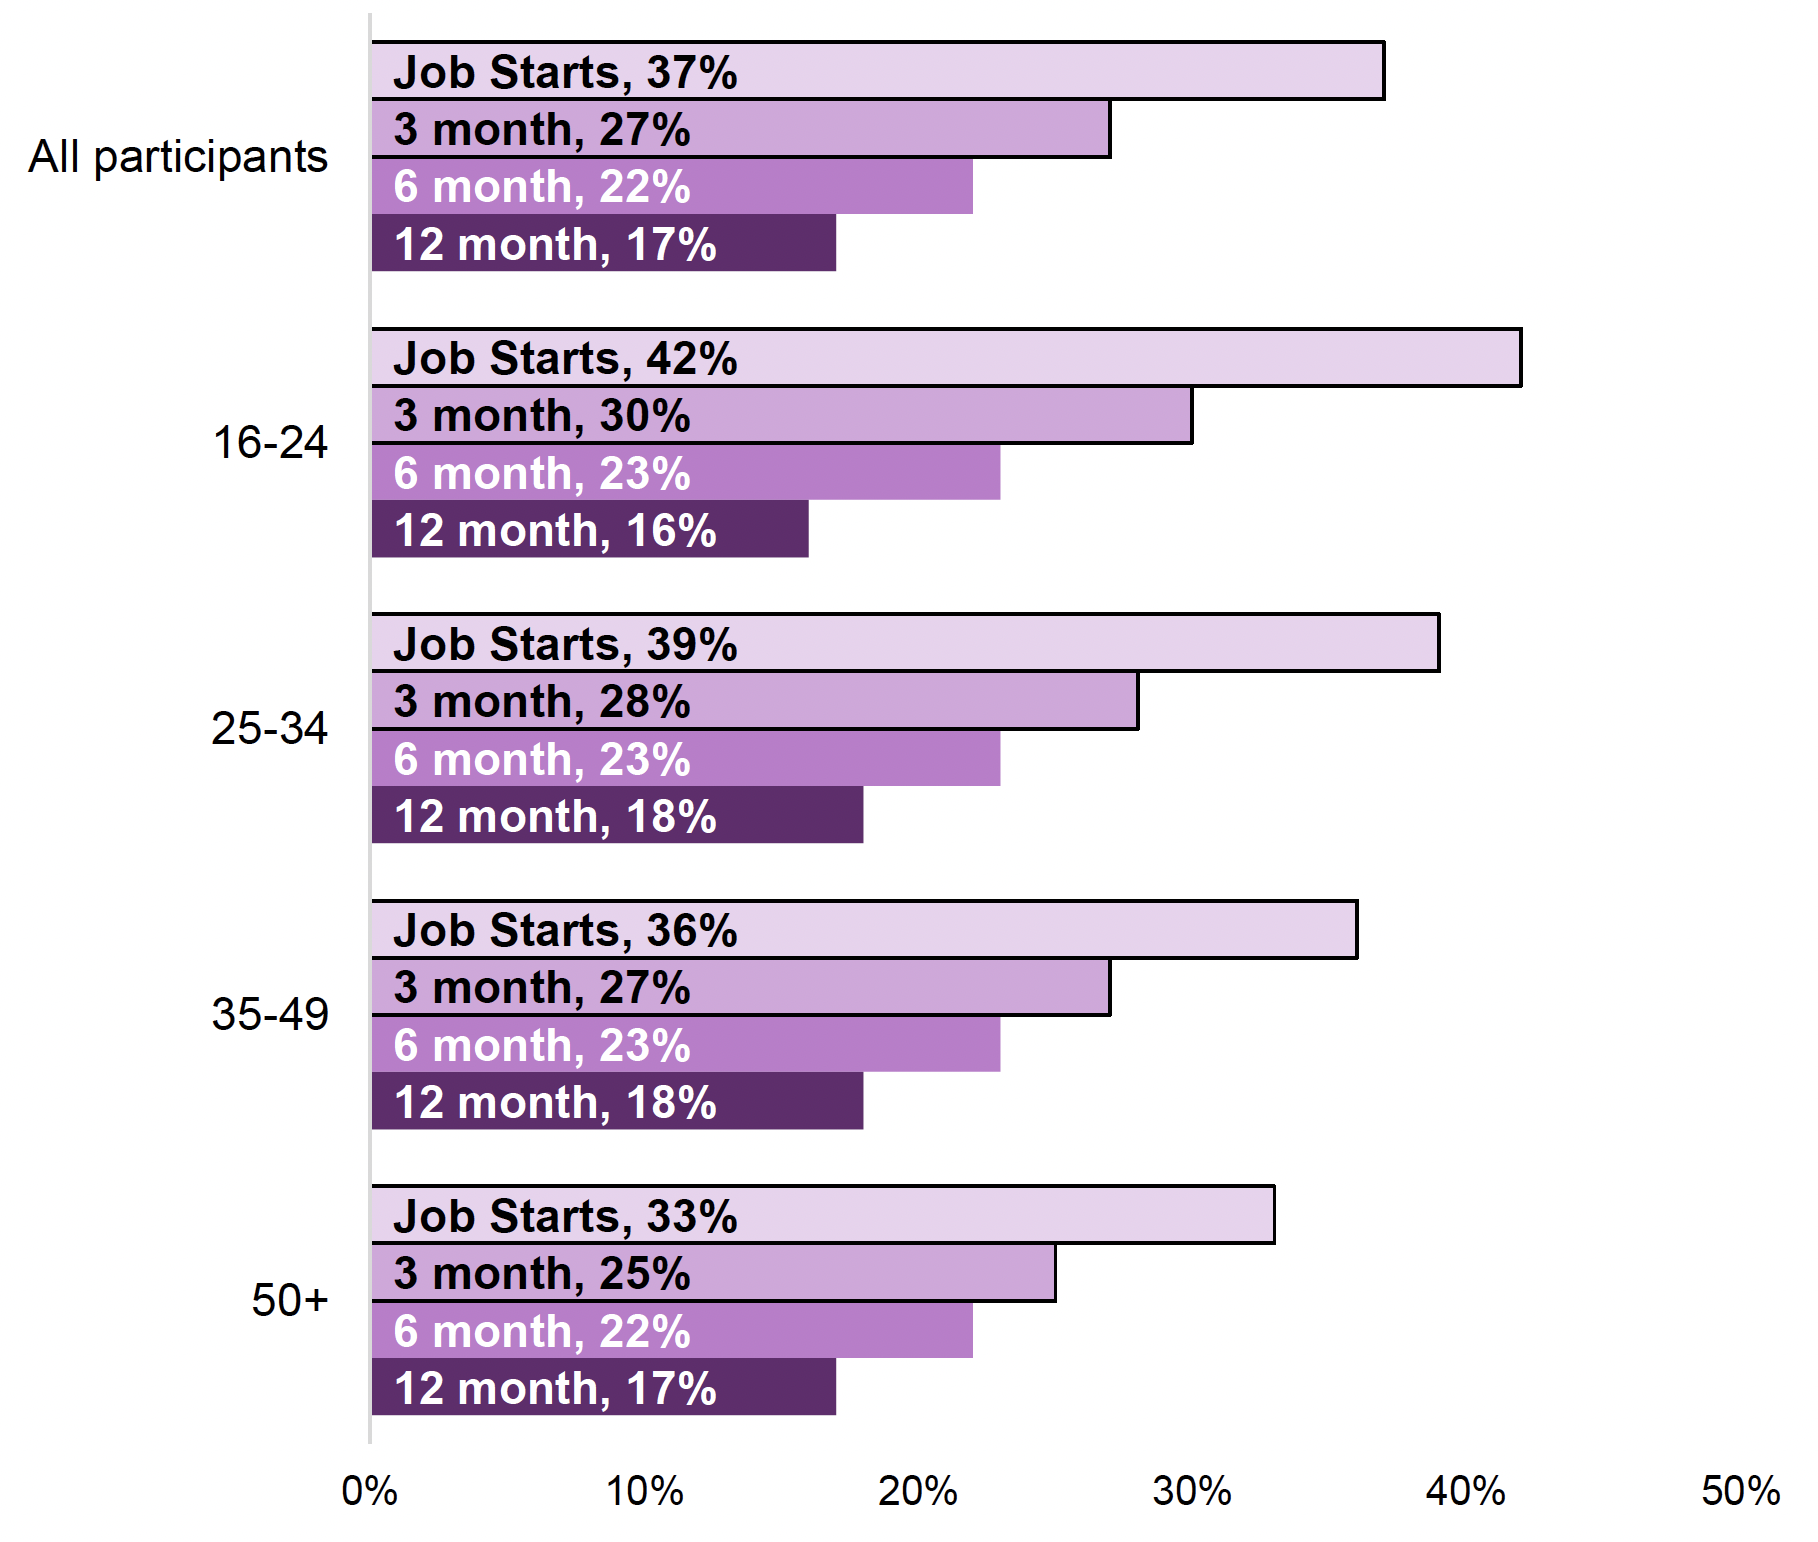
While the youngest age group (16-24) made up the lowest proportion of FSS participants, this group achieved higher rates of job starts and 3 month job outcomes compared to other age groups. However this difference narrows or reverses when looking at 6 and 12 month job outcomes. Those in the oldest age group (50 years and older) had the lowest outcome rates for job starts and 3 month job outcomes, though this difference narrowed at 6 and 12 months.
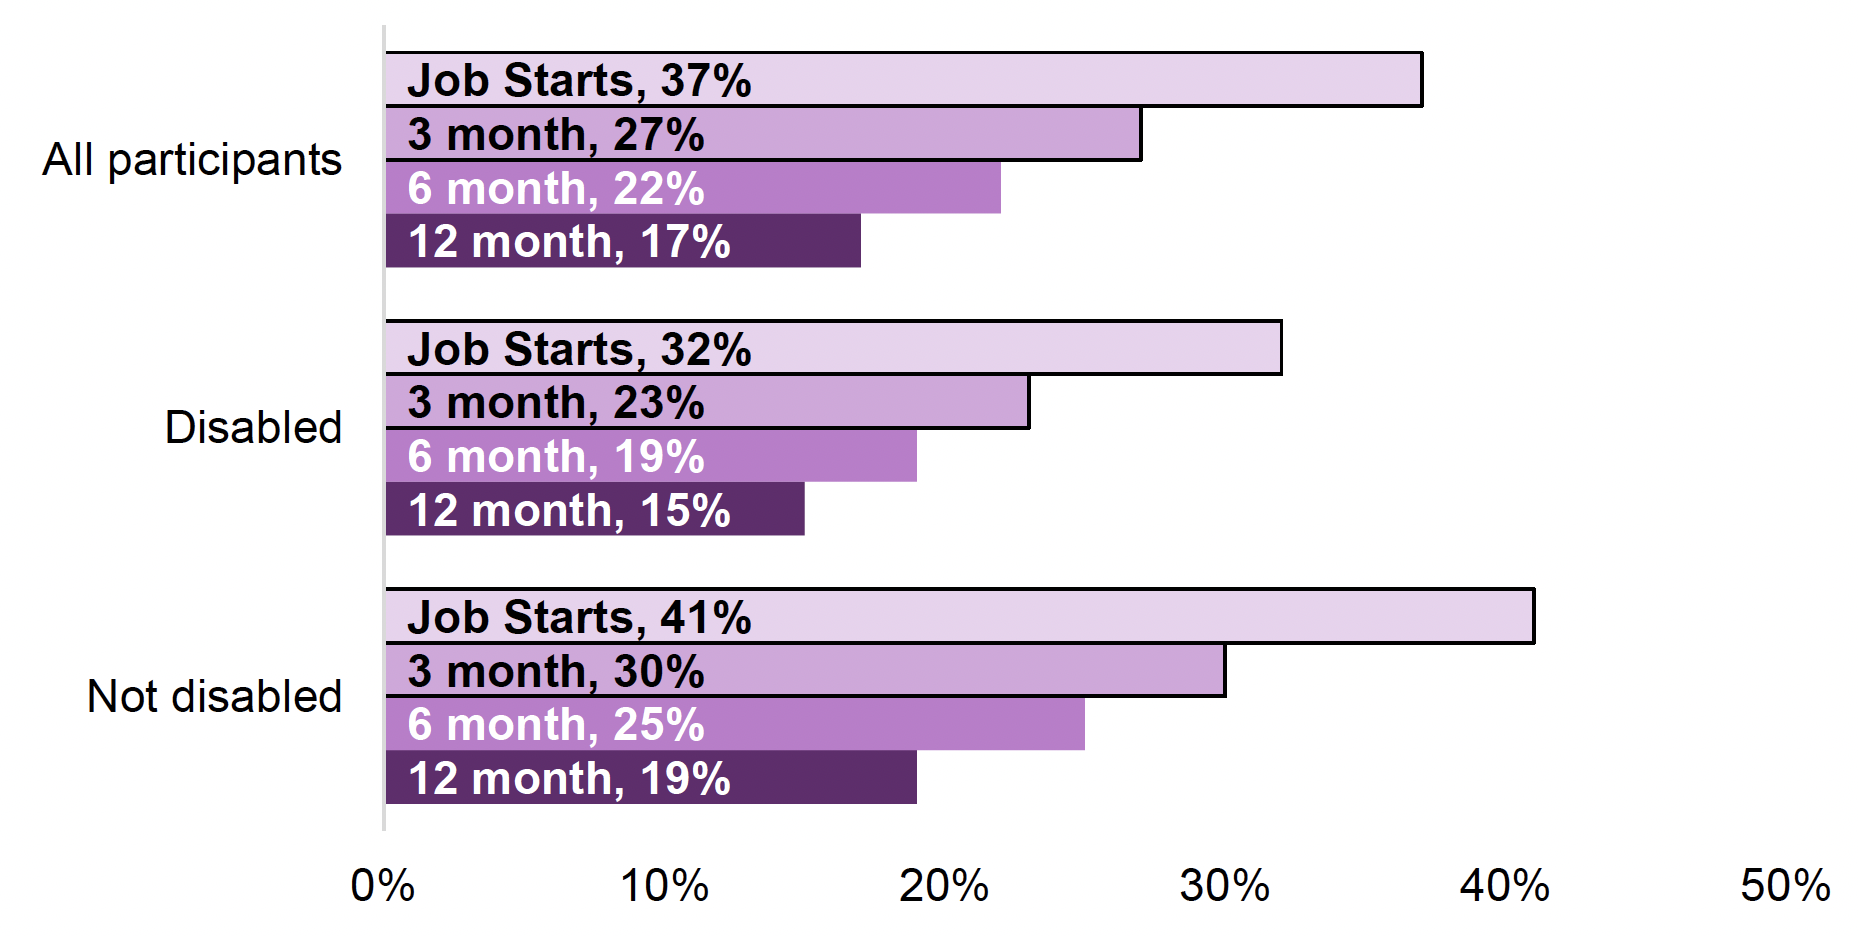
Long-Term Health Condition and Disability
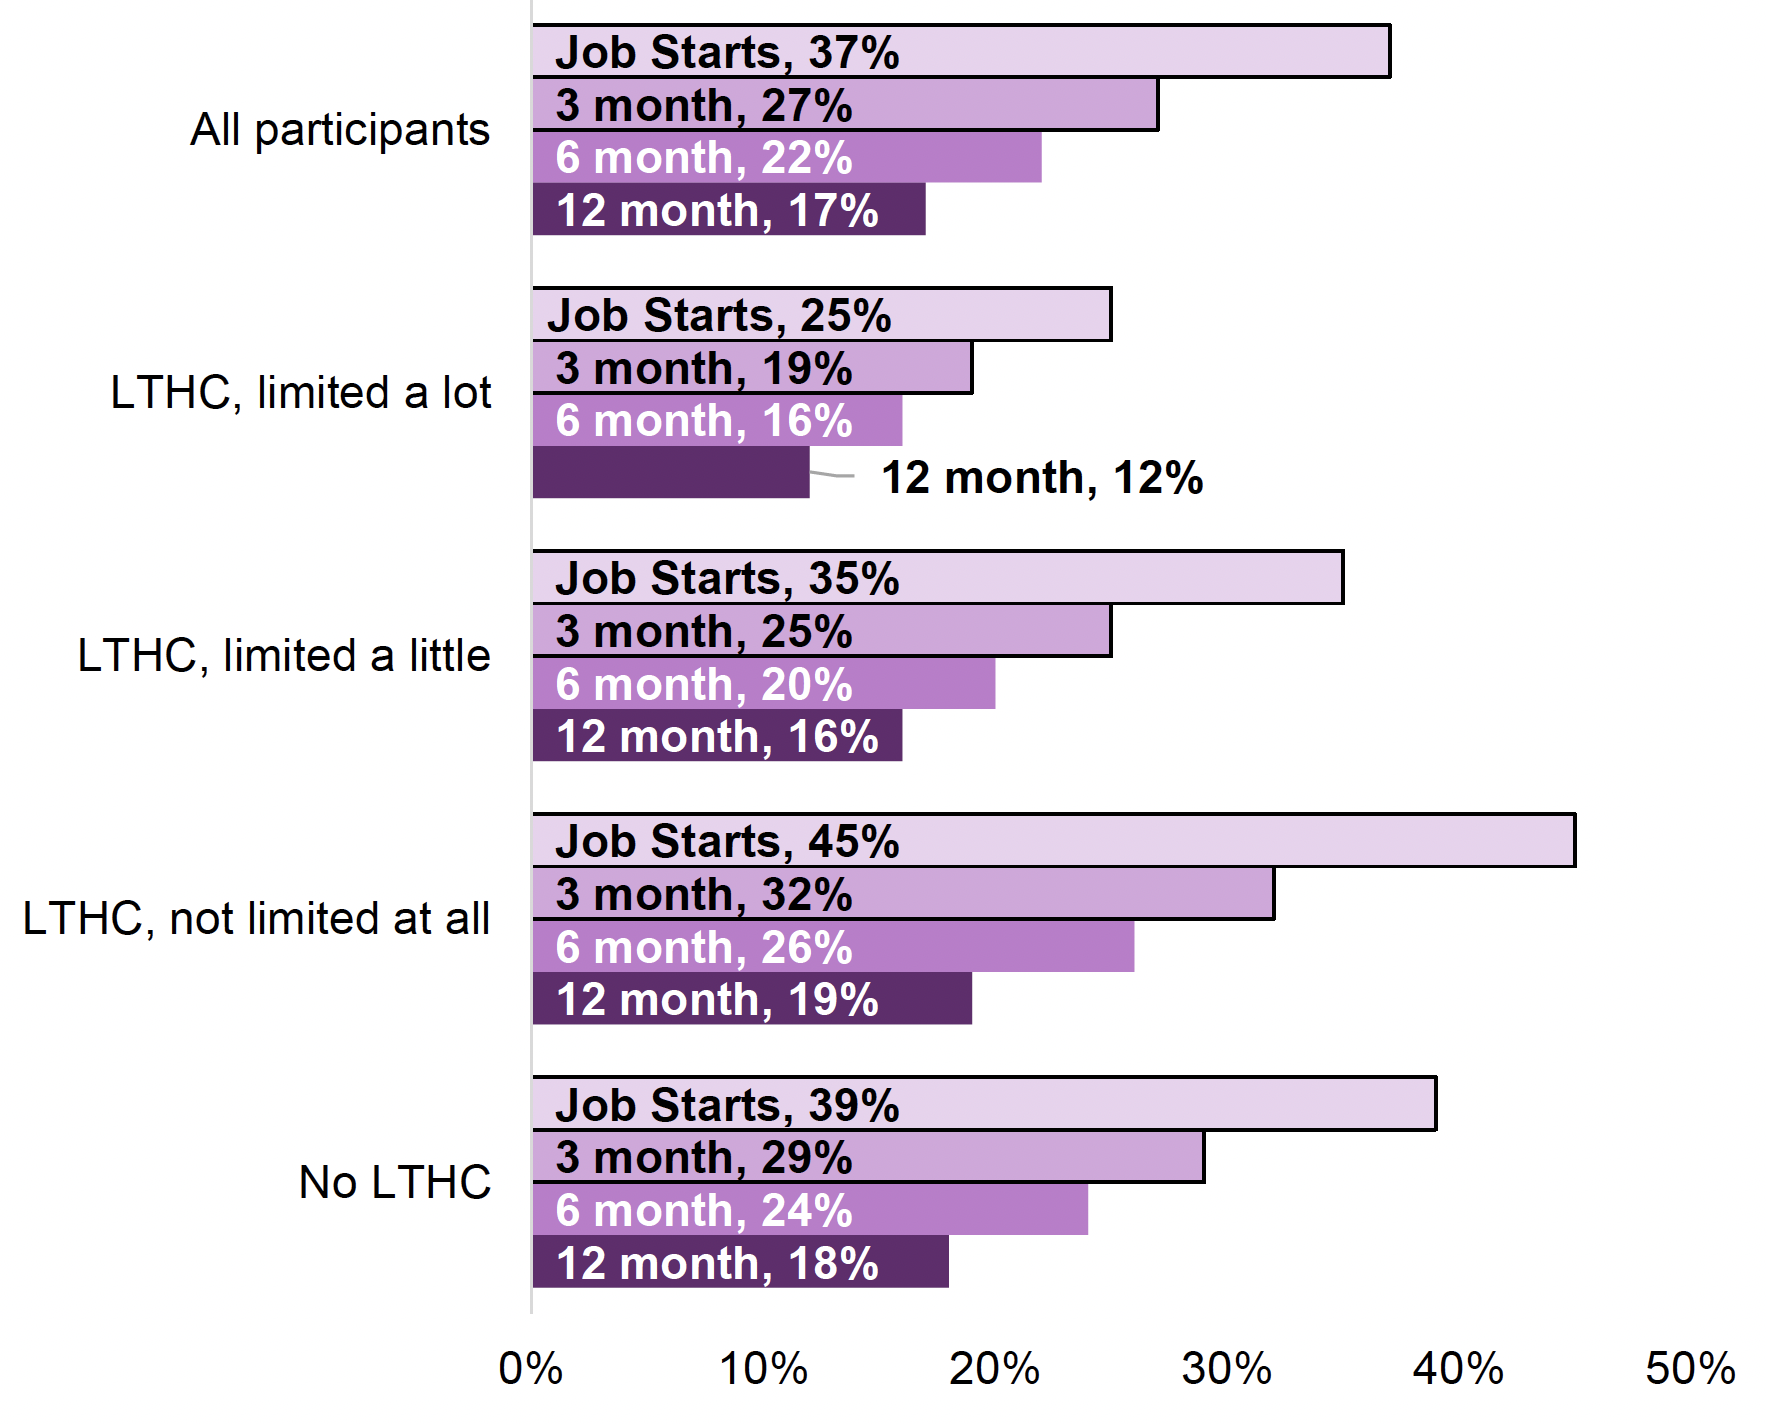
Of the FSS starts with a long-term health condition that limited daily activities a lot, 25% went on to start work, compared to 45% of starts that had a health condition that did not limit daily activities. The difference between these two groups was also observed in the proportions sustaining employment at 3 months (19% for those limited a lot, and 32% for those not limited at all), 6 months (16% and 26%) and 12 months (12% and 19%).
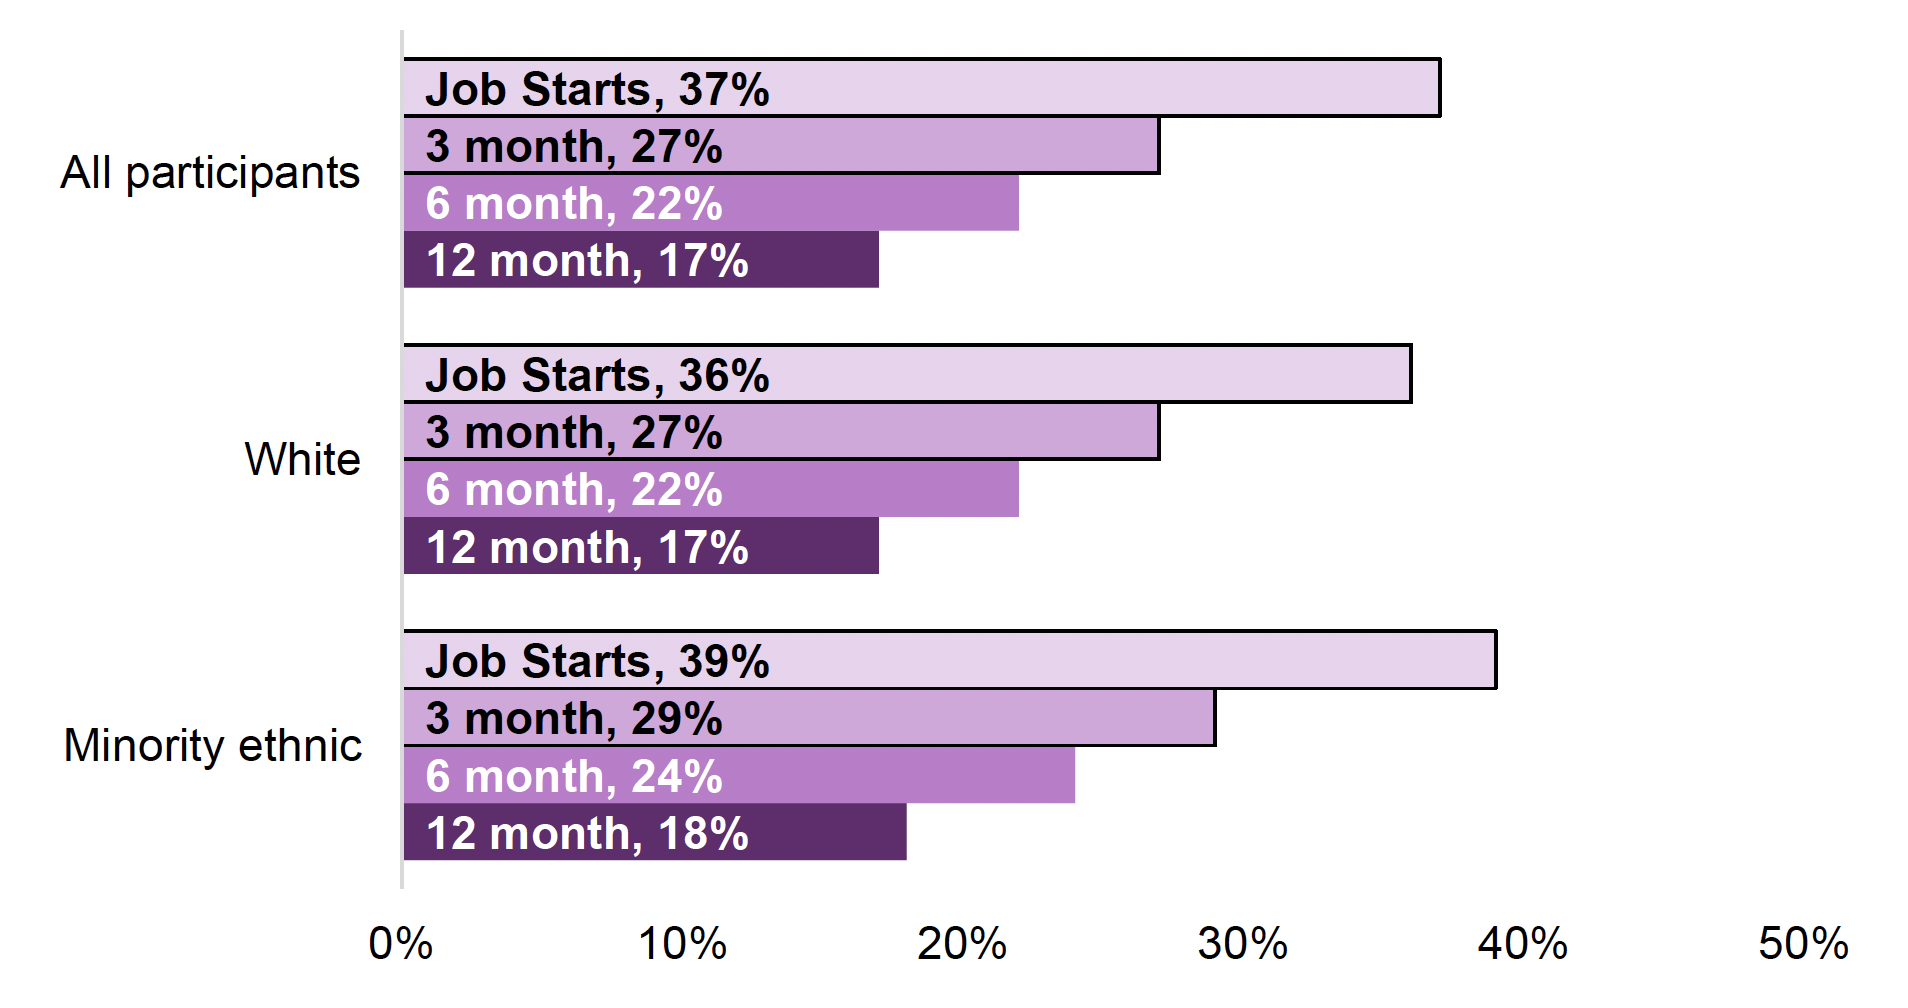
Ethnicity
Of the FSS starts that were from minority ethnic backgrounds, 39% went on to start work, compared to 36% of white participants. Small differences were also seen for 3 month outcomes (29% for minority ethnic participants; 27% for white participants), 6 month outcomes (24% and 22%), and 12 month outcomes (18% and 17%).
How many parent starts on FSS entered and sustained employment?
For the 11,247 FSS starts that were parents, job outcome rates can only be reported for start cohorts where enough time has passed in pre-employment support (12 months) and for outcomes to be achieved, therefore the number of parents and time periods included differ by outcome type. The following table summarises this for each outcome type.
| Outcome | Time period of starting on service | Parents Included | Parent Re-joins |
|---|---|---|---|
| Job Starts | April 2018 – December 2021 | 8,052 | 418 |
| 3 month job outcome | April 2018 – September 2021 | 7,305 | 309 |
| 6 month job outcome | April 2018 – June 2021 | 6,373 | 169 |
| 12 month job outcome | April 2018 – December 2020 | 4,508 | 0 |
For start cohorts where enough time has passed in pre-employment support and for outcomes to be achieved, job outcome rates show:
- Most parent FSS starts did not enter work or go on to sustain employment: 38% started a job, 28% sustained employment for 3 months, 24% sustained employment for 6 months, and 18% sustained employment for 12 months.
Job Starts
The proportion of parents (38%) starting a job after joining the service is similar to the proportion of participants overall at 37%. The proportion of disabled parents (32%) starting a job was the same as disabled participants not reported to be parents and lower than the 41% of FSS starts who were not disabled and not reported to be parents. A job start was achieved by 32% of lone parent starts, 34% of parent starts that were mothers under 25, 38% of parent starts with three or more children, 37% of parent starts that had a child aged under 12 months and 38% of FSS starts that were minority ethnic parents.
3 month job outcome
A similar proportion of parents (28%) achieved a 3 month job outcome compared to FSS participants overall (27%). However, this was again lower for disabled parents (24%) and disabled participants who were not reported to be parents (23%). The highest rates were observed in those participants who were not disabled and not reported to be parents (30%). Three months sustained employment was achieved by 24% of lone parent starts, 24% of parent starts that were mothers under 25, 28% of parent starts with three or more children, 26% of parent starts that had a child aged under 12 months and 30% of FSS starts that were minority ethnic parents.
6 month job outcome
A similar proportion of parents (24%) achieved a 6 month job outcome compared with all FSS participants (22%). This was lower for disabled parents and disabled participants not reported to be parents (both 19%). Six months sustained employment was achieved by 20% of lone parent starts, 17% of parent starts that were mothers under 25, 23% of parent starts with three or more children, 22% of parent starts that had a child aged under 12 months and 24% of FSS starts that were minority ethnic parents.
12 month job outcome
The proportion of parents achieving a 12 month job outcome was 18%, similar to the proportion of FSS participants overall at 17% and for disabled parents (16%) and disabled participants who were not reported to be parents (15%). Twelve months sustained employment was achieved by 15% of lone parent starts, 12% of parent starts that were mothers under 25, 20% of parent starts with three or more children, 18% of parent starts that had a child aged under 12 months and 17% of FSS starts that were minority ethnic parents.
All outcome rates for parents should be used with caution as some percentages are based on very small numbers.
Contact
Email: employabilitydata@gov.scot