Building standards fee income and re-investment in service delivery: review
Research looking at the fee income generated by building warrant applications and the level of re-investment of income back into the local authority building standards service following the 2017 fee increase. It also provides initial modelling for a new building standards fees model.
3. Key Performance Outcomes
3.1 Introduction
3.1.1 The performance framework sets out a number of verification KPOs. This section considers the performance of the authorities against three of the KPOs which have targets (KPO1, KPO4 and KPO5).
3.2 KPO1
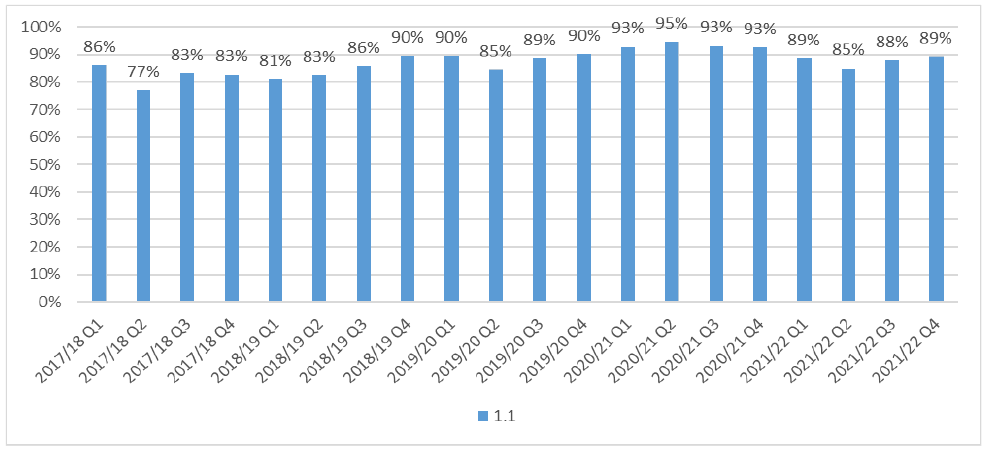
3.2.1 KPO1 seeks to minimise the time taken to issue a first report or building warrant or amendment to a building warrant. The KPO is split into two parts with the following targets:
- KPO1.1: 95% of first reports (for building warrants and amendments) to be issued within 20 days.
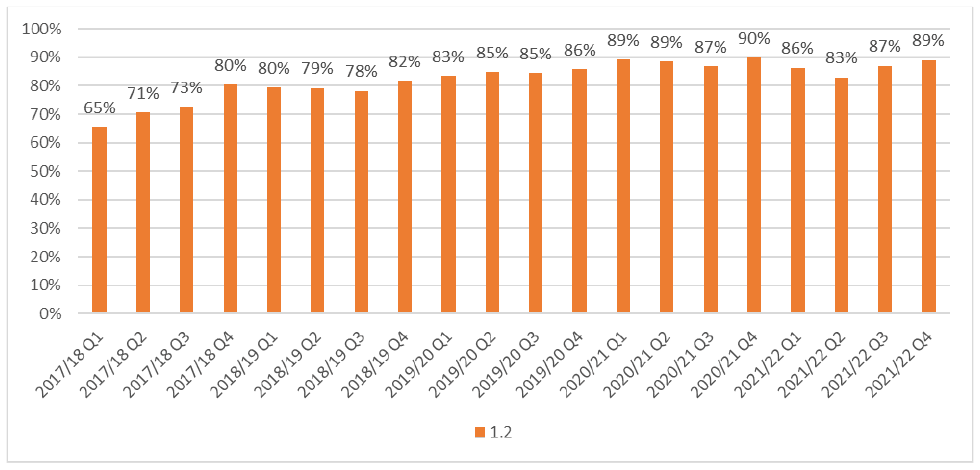
- KPO1.2: 90% of building warrants and amendments to be issued within 10 days from receipt of all satisfactory information.
3.2.2 Figure 3.1 shows, for Scotland, the percentage of first reports and amendments issued within 20 days for each quarter between 2017/18 and 2021/22 (KPO1.1). For Scotland, the 95% target was only met once in Q2 of 2020/21.
3.2.3 Table 3.1 provides a summary of the average percentage achieved each year since 2017/18 by local authority. Six authorities have achieved or exceeded the target every year and two authorities were more than 10 percentage points below the target of 95% throughout the period. Most authorities (including those which have not met the 95% target) have generally seen their performance improve since 2016/17.
| Authority | 2017/18 | 2018/19 | 2019/20 | 2020/21 | 2021/22 |
|---|---|---|---|---|---|
| 1 | 84.0 | 91.1 | 98.7 | 98.1 | 97.5 |
| 2 | 90.8 | 95.4 | 94.1 | 97.6 | 96.2 |
| 3 | 92.9 | 86.3 | 97.6 | 95.0 | 81.7 |
| 4 | 96.5 | 96.5 | 98.0 | 96.6 | 96.0 |
| 5 | 98.3 | 96.1 | 98.5 | 96.5 | 96.2 |
| 6 | 67.8 | 37.0 | 41.8 | 67.6 | 48.9 |
| 7 | 87.5 | 86.8 | 85.8 | 87.2 | 55.8 |
| 8 | 96.3 | 96.0 | 93.1 | 99.5 | 99.8 |
| 9 | 77.6 | 58.8 | 41.1 | 97.5 | 88.2 |
| 10 | 52.9 | 54.1 | 87.8 | 90.3 | 91.5 |
| 11 | 61.4 | 80.3 | 84.5 | 91.0 | 78.9 |
| 12 | 60.9 | 81.7 | 95.9 | 97.7 | 93.7 |
| 13 | 98.6 | 98.5 | 92.0 | 94.8 | 95.6 |
| 14 | 93.8 | 92.9 | 99.1 | 98.3 | 98.9 |
| 15 | 95.8 | 97.9 | 97.7 | 95.8 | 95.8 |
| 16 | 85.4 | 89.0 | 84.9 | 96.4 | 88.3 |
| 17 | 96.5 | 94.7 | 94.3 | 95.4 | 92.0 |
| 18 | 95.8 | 96.1 | 91.7 | 96.6 | 91.9 |
| 19 | 86.9 | 98.4 | 99.0 | 97.2 | 98.0 |
| 20 | 98.5 | 99.9 | 100.0 | 97.4 | 98.5 |
| 21 | 99.7 | 98.6 | 80.0 | 91.5 | 96.8 |
| 22 | 92.7 | 91.2 | 92.1 | 96.8 | 75.9 |
| 23 | 97.8 | 99.6 | 99.4 | 97.1 | 97.8 |
| 24 | 97.8 | 95.9 | 82.9 | 92.6 | 88.9 |
| 25 | 32.2 | 48.4 | 52.8 | 42.1 | 48.2 |
| 26 | 56.0 | 59.6 | 86.8 | 93.2 | 68.4 |
| 27 | 90.5 | 72.3 | 94.1 | 97.5 | 97.0 |
| 28 | 51.5 | 57.1 | 76.1 | 80.7 | 91.9 |
| 29 | 82.4 | 73.1 | 89.7 | 95.2 | 79.3 |
| 30 | 78.8 | 91.6 | 97.4 | 95.2 | 93.2 |
| 31 | 72.9 | 70.8 | 71.0 | 82.5 | 89.3 |
| 32 | 100.0 | 100.0 | 100.0 | 100.0 | 100.0 |
| Scotland | 82.2 | 84.8 | 88.2 | 93.3 | 87.7 |
3.2.4 Figure 3.2 shows the percentage of building warrants and amendments issued within 10 days at the national level for each quarter between 2017/18 and 2021/22 (KPO1.2). For Scotland, the 90% target was only met once in Q4 of 2020/21. Although the target has not often been met, there has been a general improvement in performance over time.
3.2.5 Table 3.2 provides a summary of the average proportion of building warrants and amendments issued within 10 days of receipt of all satisfactory information (KPO1.2) for each year since 2017/18 by local authority. Seven authorities have achieved or exceeded the 90% target since 2017/18 while one authority was more than 10 percentage points below the 90% target throughout the period. Two authorities have seen their performance slip significantly in 2021/22 while two authorities have experienced a reduction in performance over the five years.
| Authority | 2017/18 | 2018/19 | 2019/20 | 2020/21 | 2021/22 |
|---|---|---|---|---|---|
| 1 | 58.6 | 82.2 | 87.2 | 87.6 | 79.2 |
| 2 | 93.1 | 94.3 | 94.2 | 97.4 | 95.6 |
| 3 | 92.1 | 92.4 | 97.2 | 96.2 | 93.2 |
| 4 | 96.3 | 97.8 | 98.5 | 98.2 | 98.3 |
| 5 | 89.9 | 89.4 | 96.7 | 87.0 | 95.0 |
| 6 | 34.1 | 78.3 | 62.9 | 89.9 | 86.4 |
| 7 | 85.9 | 87.0 | 86.8 | 87.3 | 75.6 |
| 8 | 89.0 | 92.2 | 89.3 | 92.9 | 97.4 |
| 9 | 64.1 | 44.0 | 61.7 | 94.2 | 83.1 |
| 10 | 94.4 | 73.6 | 81.4 | 87.7 | 89.3 |
| 11 | 93.1 | 98.6 | 97.7 | 95.6 | 96.4 |
| 12 | 43.0 | 63.3 | 83.5 | 94.7 | 92.8 |
| 13 | 81.7 | 90.9 | 90.0 | 92.2 | 92.7 |
| 14 | 71.5 | 72.1 | 84.7 | 87.8 | 83.4 |
| 15 | 77.5 | 80.9 | 83.1 | 69.5 | 78.4 |
| 16 | 0.0 | 74.8 | 83.5 | 90.2 | 89.4 |
| 17 | 90.4 | 74.6 | 77.9 | 57.3 | 62.7 |
| 18 | 84.4 | 84.6 | 78.9 | 85.8 | 79.2 |
| 19 | 62.0 | 94.4 | 99.0 | 90.4 | 91.6 |
| 20 | 91.7 | 95.8 | 92.7 | 95.1 | 93.5 |
| 21 | 100.0 | 99.7 | 96.0 | 96.9 | 95.2 |
| 22 | 85.9 | 78.3 | 94.5 | 92.4 | 77.3 |
| 23 | 79.1 | 97.9 | 97.4 | 95.1 | 95.3 |
| 24 | 94.7 | 88.9 | 81.7 | 91.0 | 87.4 |
| 25 | 45.6 | 59.6 | 55.6 | 41.7 | 65.3 |
| 26 | 61.4 | 77.9 | 85.3 | 73.9 | 74.0 |
| 27 | 90.6 | 92.3 | 97.2 | 93.6 | 95.9 |
| 28 | 68.3 | 54.3 | 46.4 | 86.1 | 92.9 |
| 29 | 0.0 | 70.1 | 77.4 | 86.5 | 75.5 |
| 30 | 0.0 | 48.9 | 98.1 | 96.7 | 93.4 |
| 31 | 87.9 | 87.6 | 55.7 | 71.7 | 55.8 |
| 32 | 83.8 | 98.1 | 99.7 | 99.9 | 99.5 |
| Scotland | 72.2 | 81.0 | 84.6 | 88.6 | 86.3 |
3.3 KPO4
3.3.1 KPO4 relates to understanding and responding to the customer experience. The target is to a achieve a minimum average rating of 7.5 out of 10. Table 3.3 shows the overall satisfaction scores by local authority from 2018 to 2021 from the National Customer Satisfaction Surveys[12] which are undertaken to support the verification performance framework. The surveys collect feedback from customers from the preceding 12 months i.e. the 2020 return is based in customers who use the building standards system between the period 1 April 2019 and 31 March 2020.
3.3.2 The average customer satisfaction rating shown in the Table is RAG-rated as follows:
- Green – 7.5 and above.
- Amber – between 6.5 and 7.4.
- Red – 6.4 and below.
3.3.3 Table 3.3 shows that 14 authorities have consistently achieved the target of a rating of 7.5 and above. Only two authorities have consistently scored in the red range throughout the period.
3.3.4 Comparative analysis shows that the majority of authorities which met KPO1.1 and KPO1.2 targets also have good customer satisfaction scores. The one exception is an urban authority which met the KPO1.1 target but had a very poor customer satisfaction score throughout the period.
3.3.5 A primarily urban authority, which performed poorly on KPO1.1 and KPO1.2, also struggled with customer satisfaction, although there was improved performance in 2019 and 2020. A further (primarily urban authority), which had performed well on all KPOs until 2020/21, has seen performance dip over the last year.
| 2018 | 2019 | 2020 | 2021 | |
|---|---|---|---|---|
| Aberdeen City | 8.5 | 8.0 | 8.3 | 8.1 |
| Aberdeenshire | 8.4 | 8.6 | 8.3 | 8.2 |
| Angus | 8.3 | 8.9 | 8.5 | 8.0 |
| Argyll and Bute | 8.1 | 8.5 | 8.6 | 8.0 |
| City of Edinburgh | 4.3 | 5.4 | 6.2 | 5.5 |
| Clackmannanshire | 8.7 | 8.9 | 8.4 | 8.0 |
| Dumfries and Galloway | 6.8 | 7.1 | 7.9 | 8.2 |
| Dundee City | 7.7 | 7.6 | 7.4 | 6.5 |
| East Ayrshire | 8.4 | 8.2 | 8.7 | 7.9 |
| East Dunbartonshire | 6.4 | 4.8 | 6.9 | 6.3 |
| East Lothian | 6.7 | 6.9 | 7.4 | 7.4 |
| East Renfrewshire | 8.3 | 8.1 | 8 | 7.6 |
| Eilean Siar | 8.5 | 8.5 | 8.6 | 8.7 |
| Falkirk | 8.2 | 7.9 | 7.4 | 7.4 |
| Fife | 6.8 | 7.5 | 7.6 | 7.2 |
| Glasgow City | 5.3 | 5.4 | 6.2 | 5.7 |
| Highland | 7.4 | 7.7 | 7.6 | 7.3 |
| Inverclyde | 6.7 | 6.3 | 5.9 | 6.9 |
| Midlothian | 7.5 | 8.8 | 7.8 | 7.8 |
| Moray | 7.6 | 8.0 | 7.7 | 8.0 |
| North Ayrshire | 8.8 | 8.6 | 7.8 | 8.0 |
| North Lanarkshire | 7.5 | 7.5 | 7.4 | 6.2 |
| Orkney | 8.2 | 8.6 | 8.2 | 7.6 |
| Perth and Kinross | 8.2 | 8.3 | 8.1 | 7.4 |
| Renfrewshire | 6.2 | 7.2 | 6.7 | 5.9 |
| Scottish Borders | 7.4 | 7.4 | 7.5 | 6.7 |
| Shetland | 7.4 | 7.6 | 8.2 | 6.7 |
| South Ayrshire | 6.7 | 7.7 | 7.8 | 6.5 |
| South Lanarkshire | 7.8 | 8.0 | 8.4 | 8.0 |
| Stirling | 7.2 | 7.4 | 7.3 | 6.9 |
| West Dunbartonshire | 7.8 | 8.1 | 6.2 | 6.1 |
| West Lothian | 7.6 | 8.7 | 8.1 | 8.2 |
| SCOTLAND | 7.0 | 7.4 | 7.5 | 7.1 |
3.4 KPO5
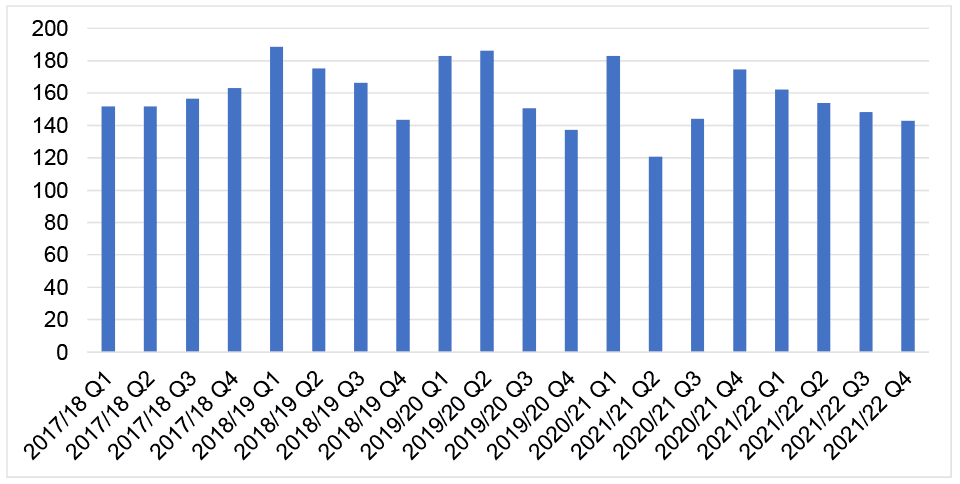
3.4.1 KPO5 is concerned with maintaining financial governance and the target is for building standards fee income to cover indicative verification service costs (staff costs plus 30%). This KPO is not scored, but Figure 3.3 provides a summary of the percentage of building warrant related fee income compared to verification staff costs. For Scotland, the target of building standards related fee income covering verification staff costs plus 30% has been achieved in every quarter since the start of 2017/18 except for Q2 in 2020/21. Q2 in 2020/21 was the only quarter where KPO1.1 achieved.
3.4.2 Table 3.4 provides a summary of the average percentage of building standards related fee income measured against verification staff costs for each year between 2017/18 and 2021/22 by local authority. There are two rural authorities where building standards related fee income has never exceeded verification costs. For six authorities (both primarily urban and rural), building standards related fee income exceeds verification staff costs but not by more than 30%. For four authorities (from urban to rural), building standards related fee income exceeds verification staff costs by a considerable amount (e.g. income is almost twice staff costs).
3.4.3 The authorities where income is considerably greater than staff costs are authorities which tended to perform less well under KPO1. This suggests that these authorities may be under-staffed with subsequent effects on the KPO1 target.
| Authority | 2017/18 | 2018/19 | 2019/20 | 2020/21 | 2021/22 |
|---|---|---|---|---|---|
| 1 | 87.2 | 124.9 | 153.1 | 116.0 | 112.3 |
| 2 | 137.5 | 133.4 | 130.2 | 123.5 | 135.5 |
| 3 | 132.0 | 143.2 | 141.5 | 144.1 | 130.8 |
| 4 | 87.3 | 111.1 | 84.9 | 114.9 | 112.4 |
| 5 | 142.7 | 175.2 | 164.8 | 182.0 | 135.3 |
| 6 | 127.7 | 166.8 | 217.7 | 196.0 | 191.9 |
| 7 | 182.1 | 172.5 | 144.6 | 159.7 | 178.3 |
| 8 | 130.4 | 103.1 | 100.9 | 113.1 | 134.3 |
| 9 | 202.8 | 333.4 | 242.5 | 200.0 | 181.2 |
| 10 | 184.3 | 196.9 | 142.9 | 150.5 | 154.4 |
| 11 | 194.4 | 197.8 | 183.3 | 182.4 | 178.4 |
| 12 | 168.0 | 202.3 | 180.5 | 182.8 | 188.1 |
| 13 | 102.3 | 136.6 | 165.6 | 192.1 | 109.4 |
| 14 | 166.6 | 165.3 | 150.4 | 177.4 | 219.0 |
| 15 | 248.0 | 212.1 | 201.0 | 167.3 | 147.8 |
| 16 | 196.7 | 261.2 | 185.3 | 169.0 | 171.8 |
| 17 | 125.0 | 184.9 | 106.1 | 90.8 | 85.1 |
| 18 | 135.8 | 191.6 | 161.7 | 159.4 | 148.6 |
| 19 | 103.8 | 112.9 | 115.9 | 114.9 | 93.0 |
| 20 | 68.6 | 87.4 | 70.6 | 72.2 | 68.4 |
| 21 | 188.5 | 176.1 | 241.0 | 167.8 | 144.1 |
| 22 | 186.5 | 163.1 | 199.7 | 165.8 | 213.4 |
| 23 | 172.4 | 121.0 | 117.8 | 107.0 | 114.6 |
| 24 | 170.8 | 172.8 | 184.7 | 214.2 | 172.8 |
| 25 | 258.5 | 198.8 | 268 | 241.8 | 204.6 |
| 26 | 158.3 | 210.1 | 206.9 | 209.3 | 187.6 |
| 27 | 79.0 | 70.2 | 75.0 | 70.0 | 85.0 |
| 28 | 138.5 | 130.8 | 121.2 | 121.1 | 107.9 |
| 29 | 184.4 | 141.8 | 142.1 | 138.5 | 145.4 |
| 30 | 161.2 | 145.3 | 159.3 | 121.3 | 149.1 |
| 31 | 111.5 | 153.4 | 125.0 | 126.3 | 82.9 |
| 32 | 113.3 | 157.7 | 218.8 | 160.4 | 126.7 |
| Scotland | 155.9 | 167.2 | 162.8 | 155.2 | 151.4 |
3.5 Summary
3.5.1 The main points to note include:
- For Scotland. KPO1.1 and KPO1.5 have each only been met in one quarter since 2017/18.
- There is considerable variation across authorities with some meeting the target every year and others being significantly below the target.
- KPO4 has only once been met at the Scotland level in the last four years although 14 authorities have consistently met the target.
- KPO5 has been achieved for Scotland in every quarter since 2017/18 with the exception of Q2 in 2020/21 which was probably a result of reduced applications due to Covid. This was the only quarter where KPO1.1 was achieved.
- Some authorities do not receive enough fee income to cover verification staff costs while others have fee income which is almost twice their staff costs plus 30%.
- The authorities where fee income is considerably greater than staff costs are authorities which tended to perform less well under KPO1 suggesting that these authorities may be understaffed.
Contact
Email: buildingstandards@gov.scot