Building standards fee income and re-investment in service delivery: review
Research looking at the fee income generated by building warrant applications and the level of re-investment of income back into the local authority building standards service following the 2017 fee increase. It also provides initial modelling for a new building standards fees model.
2. Building Standards Income and Expenditure
2.1 Introduction
2.1.1 This section considers the income and expenditure of the building standards service across Scotland and by local authority. The analysis considers published data from local government financial returns and data provided directly to BSD from building standards departments as part of their quarterly KPO returns. The analysis however, begins with an overview of the number and character of building warrant applications.
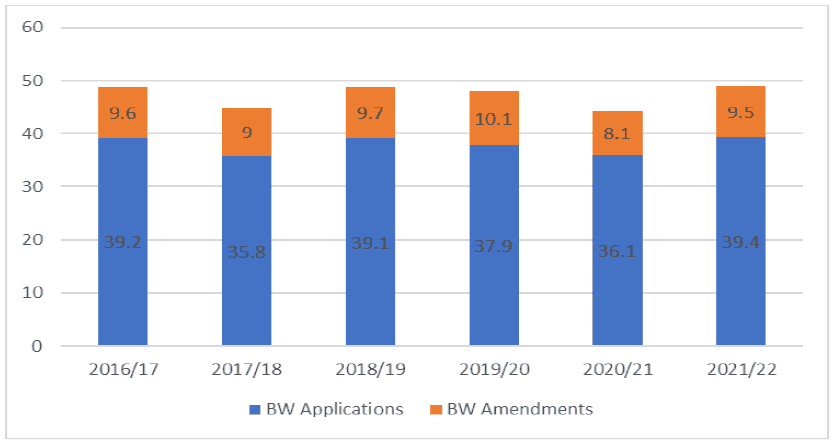
2.1.2 Figure 2.1 shows that the number of building warrant applications has fluctuated at around 38,000 per annum (excluding 2017/18 and 2020/21). The dip in 2020/21 is likely to be the effect of Covid 19 with the dip in 2017/18 possibly related to the fees increase in July 2017. The number of applications for amendments to warrants also fluctuates from year to year, but averages approximately 9,300 per annum. This is approximately 24% of total building warrant applications.
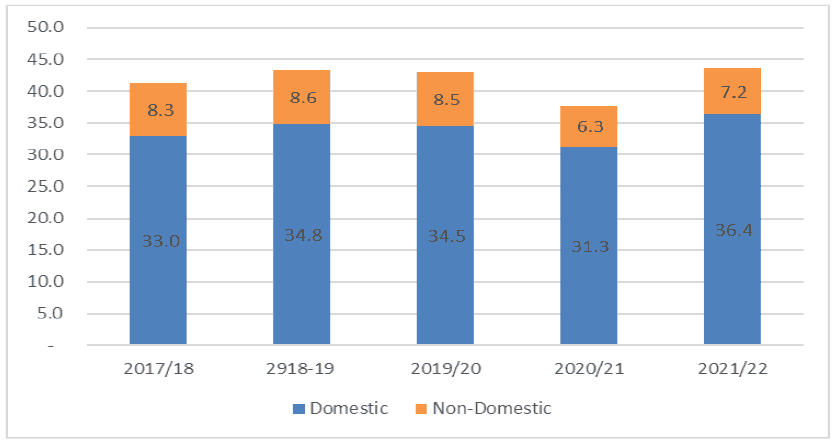
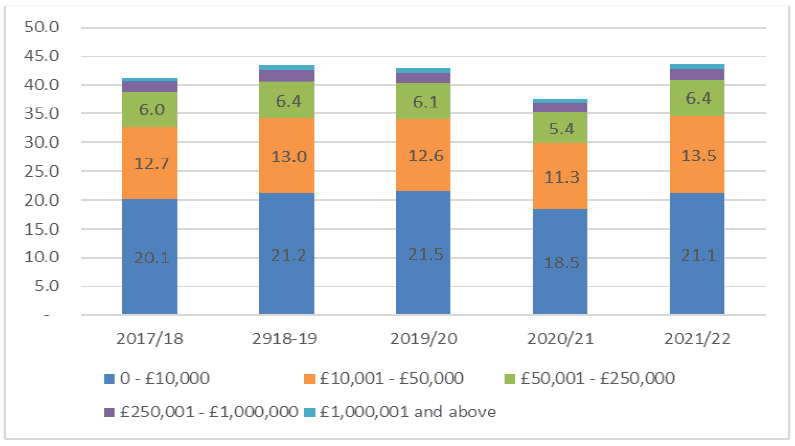
2.1.3 Data on the characteristics of warrants issued are available for the period from 2017/18. Figures 2.2 and 2.3 show the distribution of warrants by domestic and non-domestic activities and by value of work band respectively. The main points to note are:
- Domestic building warrants are the dominant type of warrant accounting for approximately 80% of warrants issued.
- Warrants issued in the lowest value of work band (£0 to £10,000) account for almost half of all warrants with a further 30% in the £10,001 to £50,000 value of work band.
2.2 Local Financial Returns Data
Scotland
2.2.1 Scottish Local Government Financial Statistics (SLGFS) is an annual publication that provides a comprehensive overview of the financial activity of Scottish local authorities based on authorities audited accounts. Within the publication, there is detailed information on the cost of providing local government services and any income associated with different services.
2.2.2 Within SLGFS, building standards is included within the service category “Building, Planning and Development” and information on all expenditure and income relating to building standards, planning and economic development is available from Local Financial Return (LFR) 07.
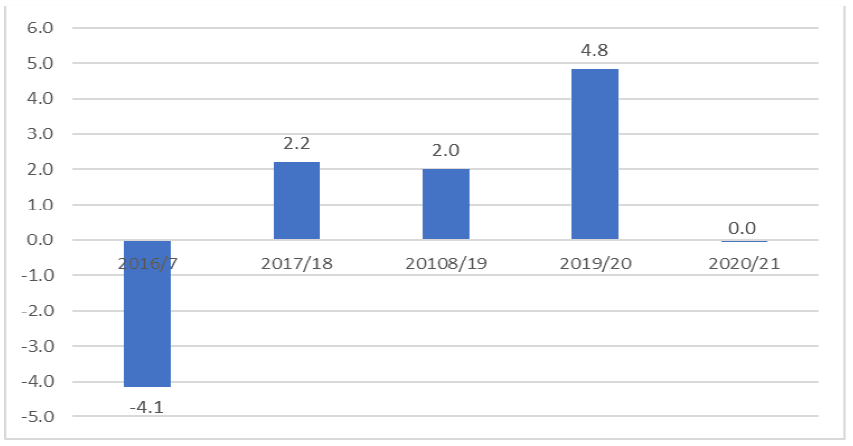
2.2.3 Figure 2.4 shows the overall position of building standards[6] in Scotland with respect to income and expenditure from the LFRs. This is all expenditure on building standards, not just verification expenditure. In 2016/17, expenditure on building standards exceeded the income of the service by £4.1 million. Following the increase in fees in July 2017, the position was reversed, and income exceeded expenditure by £2.2 million in 2017/18. A similar surplus was achieved in 2018/19 with a substantial surplus of £4.8 million achieved in 2019/20. There was a slight deficit in 2020/21, but this figure is likely to have been affected by the Covid pandemic.
2.2.4 Figure 2.5 shows gross service income and expenditure in Scotland between 2016/17 and 2020/21. The LFRs do not provide any breakdown of income, they only show the total income an authority receives in relation to the specific service provided. The income could be from customer/client receipts or specific grants.
2.2.5 The effect of the fee increase in July 2017 is seen in the change in income between 2016/17 and 2017/18 with income increasing by over £6 million (20%) between these two years while the number of building warrants and amendments fell by 8% from 48,800 to 44,800. Further increases in income were achieved in 2018/19 and 2019/20 before income dropped back in 2020/21 as Covid 19 impacted construction activity. In 2018/19 and 2019/20 income per building warrant and amendment application was approximately 50% higher than 2016/17.
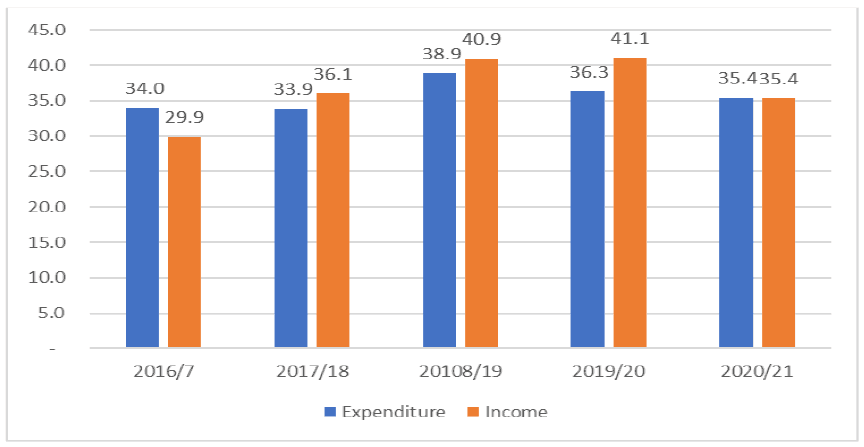
2.2.6 Expenditure on building standards has fluctuated throughout the period. Between 2016/17 and 2018/19, it increased by almost £5 million (14%) to £38.9 million but has since decreased to £35.4 million in 2020/21. Care should be taken with 2020/21 data as it is expected that there will be an impact due to the Covid Pandemic.
2.2.7 Expenditure in the LFR is broken down into three components:
- Support services: the provision of services such as IT, HR, legal etc.
- Recharge income from other services: this is included to ensure double counting caused by internal charging is eliminated within the gross expenditure calculation.
- All other expenditure: this covers employee costs, operating costs (e.g. premises, transport, supplies and services) and transfer payments.
2.2.8 Across Scotland as a whole, support services accounted for approximately 10% of total expenditure in 2020/21. This has been broadly stable at between 10% and 12% since 2017/18[7].
2.2.9 “All other expenditure” accounted for 92% of building standards expenditure in 2020/21 and is a very broad category which does not allow employment costs to be identified separately from other operating costs. Gross service expenditure is also understood to include an element of central overheads but these are not shown separately. The Local Government Finance Unit have confirmed that no further breakdown is available for building standards.
Local Authorities
2.2.10 The net position of each local authority in terms of income relative to expenditure is shown in Annex B for each of the five years of data. In 2016/17 (before the 2017 fee increase) only ten authorities returned an excess of income over expenditure. By 2018/9 and 2019/20 this had increased to 20 authorities, although there has been a decrease in this number in 2020/21.
2.2.11 Throughout the period, LFR data shows that eight authorities have spent more on their whole building standards service than they have received in income – Aberdeenshire, Argyll and Bute, East Ayrshire, East Dunbartonshire, Falkirk, Na-Eileanan Siar, Shetland Islands and South Ayrshire. Some of the authorities (Aberdeenshire, Argyll and Bute, Falkirk and Shetland Islands) have experienced a decline in their expenditure over the period, but the reduction is not sufficient to move them to surplus authorities.
2.2.12 Seven authorities have brought in more income than they have spent on building standards throughout the period – Angus, East Lothian, Glasgow, Orkney Islands, Renfrewshire, South Lanarkshire and West Lothian.
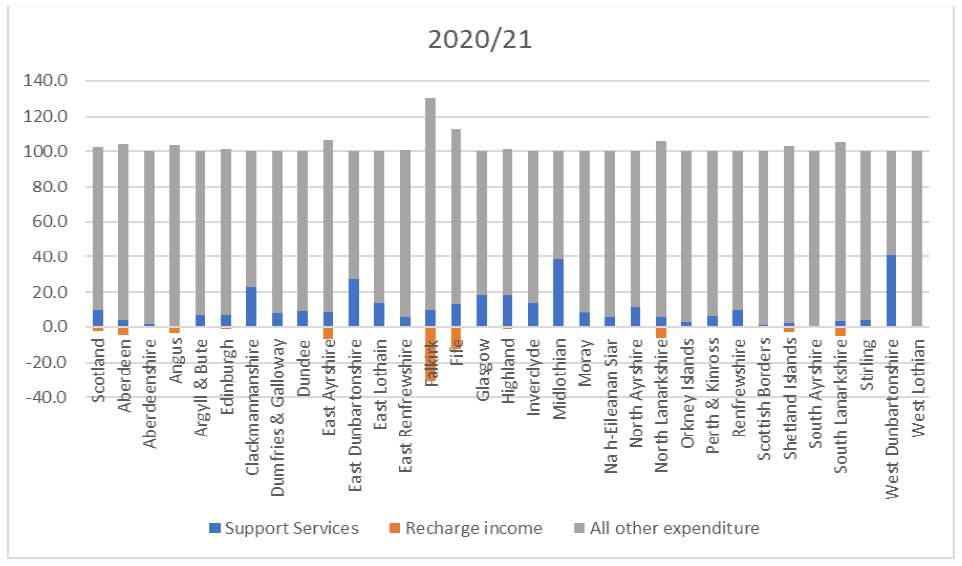
2.2.13 Figure 2.6 provides a summary of the main components of expenditure for Scotland and each local authority in 2020/21 using local financial return data. The Figure shows that there is considerable variation in the share of expenditure accounted for by support services with the share being around 40% for West Dunbartonshire and Midlothian and less than 2% for Aberdeenshire, Angus, Scottish Borders, Shetland Islands and West Lothian.
2.2.14 The substantial variation across authorities raises concerns about the consistency of the treatment of components of expenditure across authorities.
2.3 Verification Income Data from BSD Returns
Scotland
2.3.1 BSD collect more detailed information from building standards departments on a quarterly basis as part of the building standards performance framework. Data from the quarterly returns show building warrant related fee income increased from £26.6 million in 2016/17 to £32.1 million in 2017/18 and £35 million in 2018/19. Building warrant related fee income has remained relatively stable at around £35 million per annum since 2018/19. Details are shown in Figure 2.7.
2.3.2 Comparison of 2016/17 and 2018/19 (the first full year of the fee increase) shows there was an increase in fees of almost £8.45 million or 31.8% between these two years. Figure 2.1 above shows that building warrant applications and amendments were broadly stable between these two dates (48,784 in 2016/17 and 48,819 in 2018/19). To isolate the impact of the fees increase in 2017/18, average income per warrant application in 2016/17 has been applied to the number of applications in 2018/19 to determine 2018/19 income without the increased fees. Of the £8.45 million in additional fee income between 2016/17 and 2018/19, £8.43 million can be attributed to the fee increase.
2.3.3 The data show that the 2017 increase in fees achieved, at the Scotland level, the objective of delivering an additional £3.5 million in income.
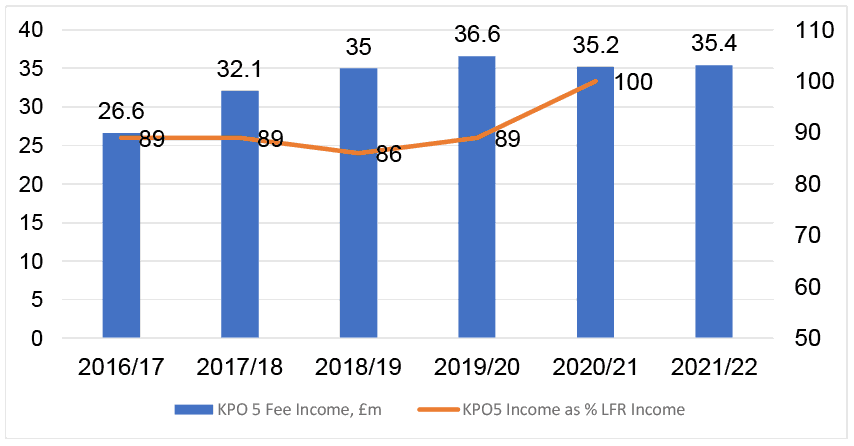
2.3.4 Comparison of building warrant related fee income with gross service income in Figure 2.5 shows that for the five years for which there are data, building warrant related fee income has averaged 90% of gross service income (although it was almost 100% in 2020/21). It is not clear why fee income is systematically lower, but it is expected that the LFR includes some income related to non-verification activity while the BSD return data is fee income related only to building warrants.
Local Authorities
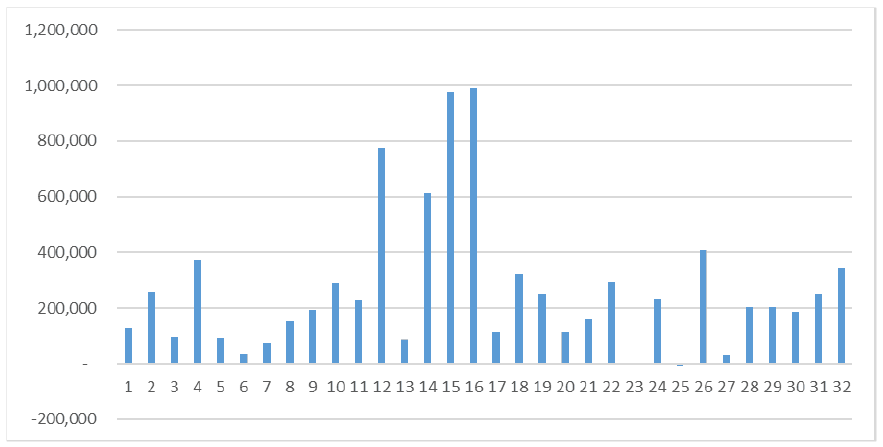
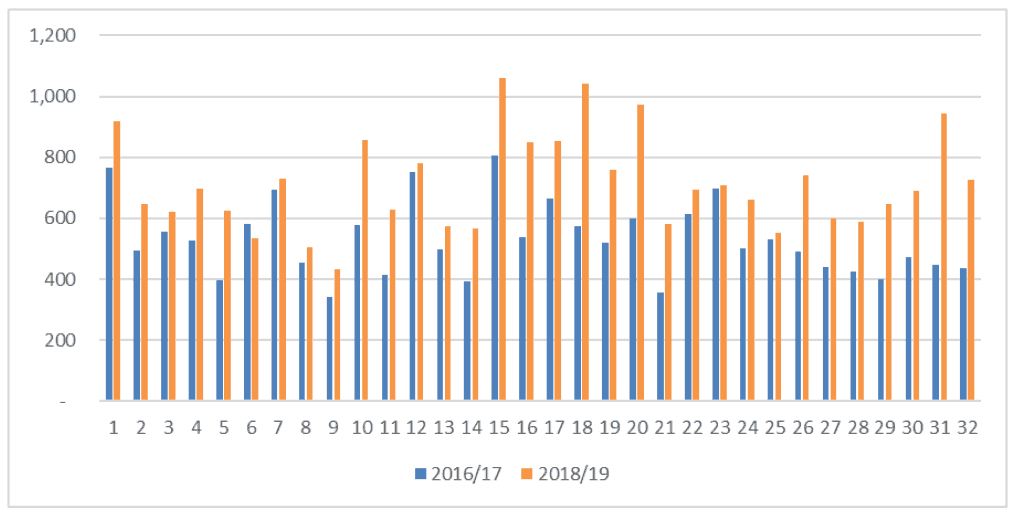
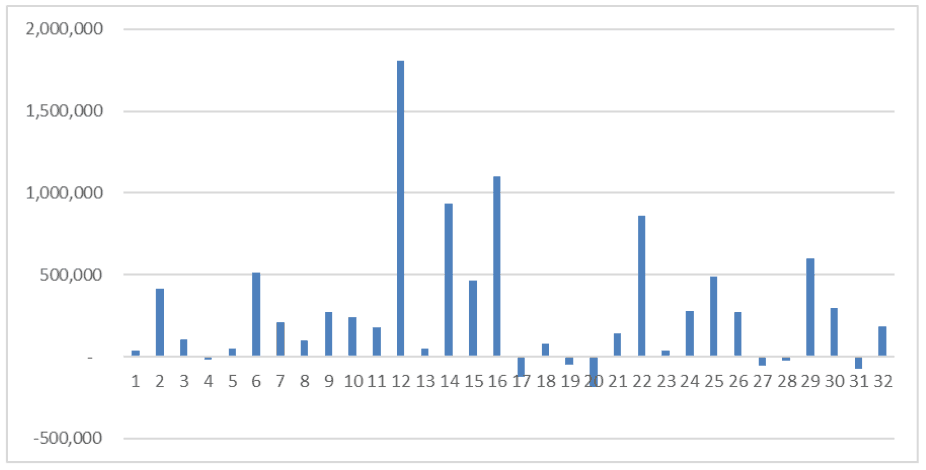
2.3.5 In general, the fees increase in 2017 led to an increase in building warrant fees in most authorities. Figure 2.8 shows the change in income in individual local authorities between 2016/17 and 2018/19. All but two authorities saw their building warrant related fee income increase between 2016/17 and 2018/19. In both authorities where there was a reduction in income, the reduction was relatively small (-0.7% and -1.5%). Not surprisingly, the largest increases in fee income were in the authorities with the largest number of building warrant applications.
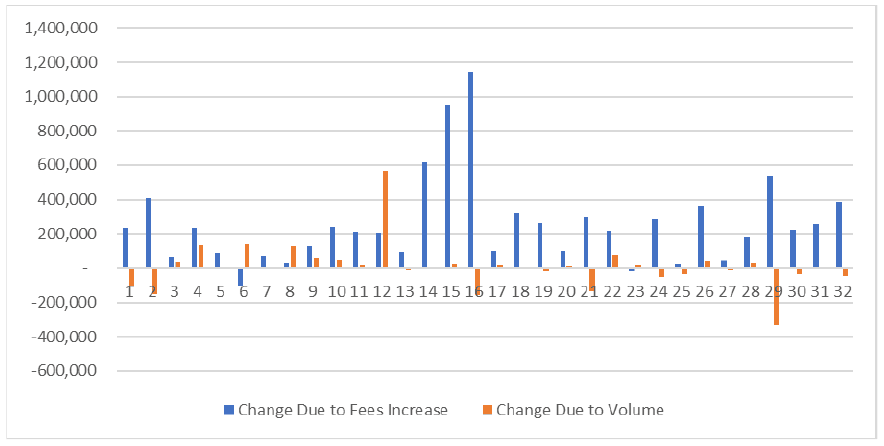
2.3.6 Figure 2.9 shows the change in fee income in each authority where the change is split between the change as a result of the fees increase and a change due to the volume of applications. In the two authorities where income did not increase, there was a reduction in applications between the two dates such that the increase in income from the change in fees was insufficient to offset the reduction in income due to a lower number of applications.
2.3.7 For most authorities, the change in income was driven by the increase in fees, although there were two authorities where the increase in income was predominantly due to an increase in the volume of applications. In one authority, the number of building warrant and amendment applications increased between the two dates, but average income per application was much lower in 2018/19 despite the increase in fees. This may suggest a lower number of “high value” projects in 2018/19.
2.3.8 For Scotland, average fee income per application (building warrants and amendments) increased from £544 in 2016/17 to £717 in 2018/19 and was £724 in 2021/22. This is an uplift of approximately 30%. In most authorities there is a clear increase in average income per application between the two years. Details are shown in Figure 2.10.
2.4 Verification Cost Data from BSD Returns
Scotland
2.4.1 Since 2017/18, BSD has collected data on the cost of providing the verification service as part of KPO5. Data are available for staff costs, non-staff related costs and other verification related investment. Total direct verification costs have increased each year from £23 million in 2017/18 to £26.2 million in 2021/22. These direct verification costs do not include any allowance for general overheads in authorities attributable to the delivery of the service (e.g. office costs, many IT costs, HR etc.). Details are shown in Figure 2.11 which also shows the components of total verification costs.
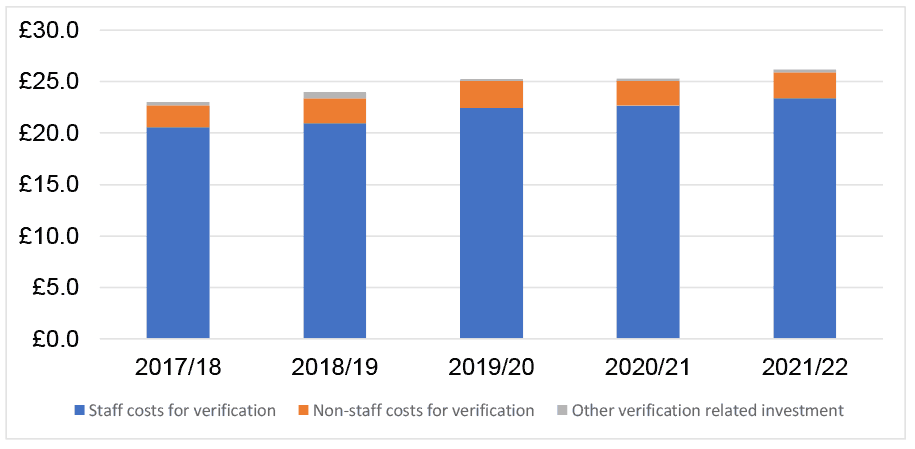
2.4.2 The direct cost of providing verification services is dominated by staff costs which at £23.4 million in 2021/22 accounted for almost 90% of the £26.2 million total direct costs. Other verification costs account for approximately 10% of costs.
Local Authorities
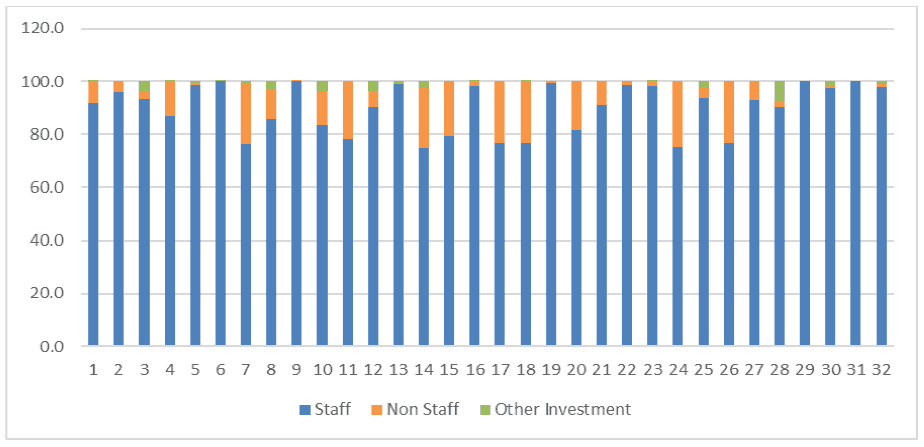
2.4.3 The breakdown of verification costs by component shows quite a lot of variation across authorities. Details are shown in Figure 2.12. Three authorities have 100% of their verification expenditure allocated to staff costs while 19 authorities incurred no expenditure (or expenditure of less than £4) under other verification related investment.
2.4.4 The online survey sought to identify what was included in non-staff costs and other verification relation investment. Many of the respondents were unable to answer the question but, of those who did, the most common elements of non-staff verification costs were outsourced specialist services, recharged council services, PPE and IT. Very few survey respondents were able to provide an answer for other verification related investment. Those who did identified IT costs as the most likely cost to be included.
2.4.5 The case study discussions also sought to clarify what is included in the different components of costs. From the case studies the following points emerged:
- Verification staff costs include all costs (e.g. pension contributions, NI, etc.) and this was consistent across all the case study authorities. However, one authority did include travel and PPE costs as staff costs.
- One authority included an allowance for office accommodation[8] in non-staff verification costs while others included travel and the costs of specialist services.
- Training and IT costs were sometimes covered by wider corporate budgets.
- Overheads relating to the building standards share of wider authority services were not included in the KPO return data.
2.4.6 It can be concluded that staff cost is the dominant cost in verification expenditure and the most consistent across authorities in terms of what is covered by the category. There is rarely any allowance for general overheads in the figures and some inconsistency in the way authorities allocate other components of verification costs.
2.5 Verification Income and Expenditure Balance from BSD Returns
Scotland
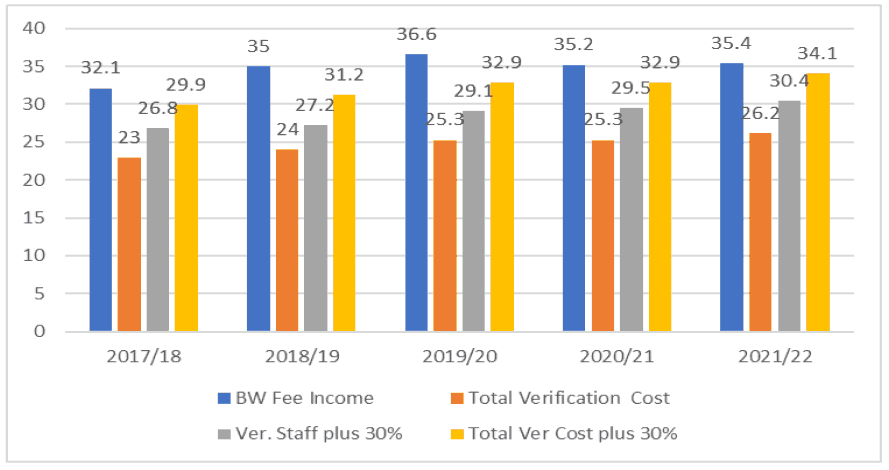
2.5.1 One of the objectives of the study was to determine if the current building standard fees are sufficient to support the delivery of verification services and to meet the operating and performance frameworks throughout Scotland. Combining the data from Figures 2.7 and 2.11 shows that income from building warrant fees exceeds the total cost of providing verification services in Scotland for the period 2017/18 to 2021/22. Although fee income has fluctuated over the years and verification costs have increased, there has been a surplus of building warrant fee income over total verification expenditure (excluding overheads) across Scotland. In 2021/22 the surplus of income was £9.2 million. Details are shown in Figure 2.13.
2.5.2 As discussed above, the verification costs do not include an allowance for general overheads. KPO5 is concerned with maintaining financial governance and the target for the KPO is for building standards fee income to cover indicative verification service costs measured as staff costs plus 30%. The 30% is a broad estimate of typical overheads and 30% of the 2020/21 verification staff costs is £6.8 million. If the LFR gross service expenditure figure for 2020/21 of £35.4 million (Figure 2.5) is compared to total verification costs plus non-verification staff[9] costs (£29 million), this suggests implied central overheads of £6.4 million. This is quite close to the £6.8 million derived from 30% of staff costs and suggests that 30% is a reasonable figure to use for overheads.
2.5.3 The evidence in Section 5 from consultations with building control departments in England suggests that 30% may be a relatively high figure in comparison to what is charged to building control departments in England at present.
2.5.4 If 30% is added to verification staff costs, the cost of verification increases to £30.4 million in 2021/22. Comparing building warrant fee income with verification staff costs plus 30% shows a surplus of income of £5 million in 2021/22. Adding non-staff verification costs to the £30.4 million figure for verification staff costs plus 30% overheads reduces the surplus of income over expenditure to £1.8 million. If the allowance of 30% for overheads is applied to total direct verification costs[10] (£26.2 million), total costs would be £34 million in 2021/22 yielding a surplus of income over expenditure of £1 million.
Local Authorities
2.5.5 There is considerable variation in the extent to which building warrant fee income covers the costs of delivering the verification service. Figure 2.14 provides the net position of verification income and expenditure by local authority for 2021/22. Analysis of the data since 2017/18 shows that the majority of authorities receive more building warrant fee income than they spend, but there have been several authorities per year which have run at a deficit i.e. more has been spent on verification than has been received in building warrant fee income. This includes three authorities where verification expenditure has been higher than building warrant fee income in every year since 2017/18 and one authority where verification expenditure has been higher than income in four of the last five years.
2.5.6 The three authorities where building warrant fee income has never covered the costs of verification are rural authorities which can lead to higher costs of delivering the verification service (e.g. more time required for site visits and higher costs associated with these visits).
2.5.7 Analysis of total verification costs per application (warrants and amendments) shows that two authorities have average verification costs per application which are more than twice the Scottish average. One has relatively high verification costs per application (+40%) but it is understood that this authority has looked to commercialise its activities to generate additional income and help to reduce the excess expenditure over income. All these authorities receive income per application which is close to or just above the Scottish average.
2.5.8 Two authorities have higher costs per application (26% and 37% respectively) but these two authorities also have relatively low income per application (-11% and -16% respectively).
2.5.9 The survey of local authorities asked if current fees are sufficient to support the delivery of verification services. Overall, the majority of respondents (58%) felt that current fees are not sufficient to support the delivery of verification services. There was a clear difference between domestic and non-domestic work with 72%[11] of respondents believing that fees did not cover the cost of verification for domestic work. For non-domestic work, the majority (56%) of respondents felt that fees were sufficient to support the delivery of the verification service. Details are shown in Table 2.1.
| Verification Services | Yes | No | Not Answered |
|---|---|---|---|
| Domestic | 5 | 13 | 1 |
| Non-Domestic | 10 | 8 | 1 |
| Overall | 8 | 11 | 0 |
| Operational & Performance Frameworks | |||
| Domestic | 5 | 11 | 3 |
| Non-Domestic | 8 | 8 | 3 |
| Overall | 7 | 10 | 2 |
2.5.10 Overall, respondents stating that the current fees were not sufficient to support the delivery of verification services felt that fees are insufficient to cover inspections in line with Construction Compliance Notification Plans (CCNP). It was also suggested that more time is required for case officer training and development, detailed plan assessments and additional compliance checks. An increase in fees to support staff recruitment would also allow for a more efficient and effective service. Anticipated areas of improvement and expectations from the work of the Futures Board were felt to add to the pressures currently on the service e.g. increased compliance workload through more CCNP notices.
2.5.11 For domestic work, it was suggested that applications can often be processed at a loss to the authority given the intensive nature of the work. This is particularly the case for small domestic projects with a lower fee resulting in larger non-domestic projects effectively subsidising these smaller domestic projects. Where smaller domestic projects do not provide SER certificates and the authority does not have an in-house structural engineer, the third-party checks can, in some cases, cost more than the building warrant fee.
2.5.12 Respondents were asked if current fees are sufficient to meet requirements in the Operating Framework and Performance Framework. The results are also shown in Table 2.1. Overall, respondents did not think that fees are sufficient to enable them to meet the requirements of both the Operating and Performance Frameworks. Fees for domestic work, in particular, were felt to be insufficient.
2.5.13 Overall, it was suggested that current fee levels are insufficient to develop back-office systems or information management over the longer term and that current fees were only sufficient to meet the operational and performance frameworks because there is no performance target for KPO2 (increase the quality of compliance assessment during the construction process).
2.5.14 Regarding domestic work, one respondent highlighted that customers expect additional advice and service from a local authority that is not built into fees. The respondent felt that the fees did not allow for additional time to offer support and have adequate staff free to answer queries. For non-domestic work, an authority suggested it was unable to fund an adequate number of case officers and ICT systems to provide business-friendly services that are able to deliver quick turnaround times and be able to react at short notice to project changes.
2.6 Building Standards Non-Verification Work
Scotland
2.6.1 Building standards staff are also involved in statutory aspects of building standards delivery (e.g. enforcement activity) and other authority services (e.g. licensing, safety at sports grounds). The extent to which building standards staff are involved in non-verification activities can be measured by comparing total staff costs to verification staff costs. In 2021/22, total staff costs were £26.6 million with verification staff costs (at (£23.4 million) suggesting the staff cost of non-verification work is £3.2 million. Over the last five years, verification staff costs average approximately 87% of total staff costs.
Local Authorities
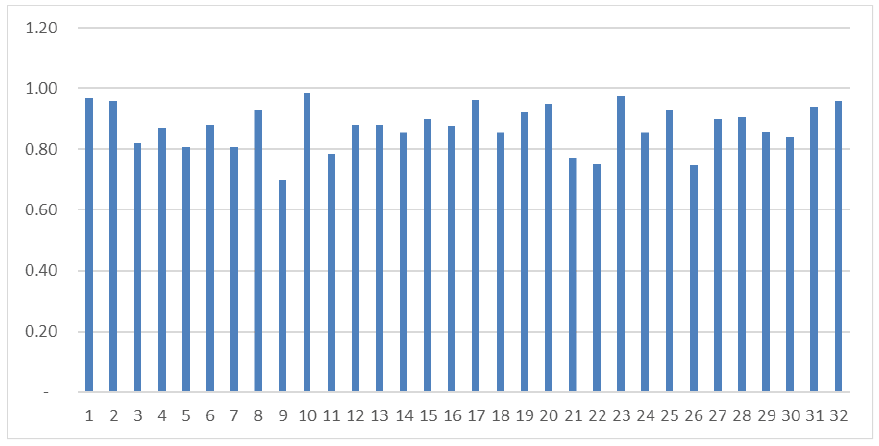
2.6.2 Verification staff costs as a proportion of total staff costs vary by local authority from 70% to 98%. Details of verification staff costs as a proportion of total staff costs are shown in Figure 2.15.
2.7 Summary
2.7.1 The main points to note from this analysis are:
- Using LFR data, the building standards service in Scotland has brought in more income from fees that it has spent on the service since the 2017 fees increase.
- BSD data show that the increase in fees achieved the objective of delivering an additional £3.5 million in income.
- The cost of providing the verification service is dominated by staff costs which is measured on a relatively consistent basis across authorities.
- For Scotland, verification income exceeds verification staff costs plus 30% (for overheads) by £5 million and total verification costs plus 30% by £1 million.
- There is substantial variation in the balance of income and expenditure across authorities with some authorities running at a deficit despite the increase in fees i.e. more has been spent on verification than has been received in building warrant fee income.
Contact
Email: buildingstandards@gov.scot