Out of home businesses - marketing strategies: research
A report on research using ‘mystery shoppers’ to understand price and placement marketing strategies used within premises and online by out of home businesses in Scotland. The research included observation of whether or not calorie information was present at the point of purchase.
6. Other promotions
Upsizing and upselling
The research assessed the level at which shoppers were encouraged to buy more than they intended, either through staff in out-of-home businesses or online prompts asking if they wanted to upsize the product or through upselling (suggesting additional products such as drinks, sides or snacks). As mentioned in Chapter 2, mystery shoppers were instructed which product to purchase at each visit, and also exactly how to ask for these products. These specific instructions were to allow some opportunity for upsizing and upselling. For example, for different visits, shoppers were instructed to ask for 'a latte' (rather than 'a large hot chocolate') and to select a sandwich that was part of the meal deal (but not pick up other items from the meal deal).
Upsizing
Not all products purchased allowed an opportunity for upsizing (e.g., most sandwiches). Business categories where upsizing was possible were coffee shops, QSR and some bakeries (specifically Subway where there is the option of the Footlong sandwich). There was the potential for upsizing to occur at 150 visits (75 Visit 1 and 75 Visit 2).
In order to compare any differences in upsizing by the type of product purchased, shoppers purchased a less healthy product in Visit 1 while in Visit 2 they purchased a healthier product (Appendix B).
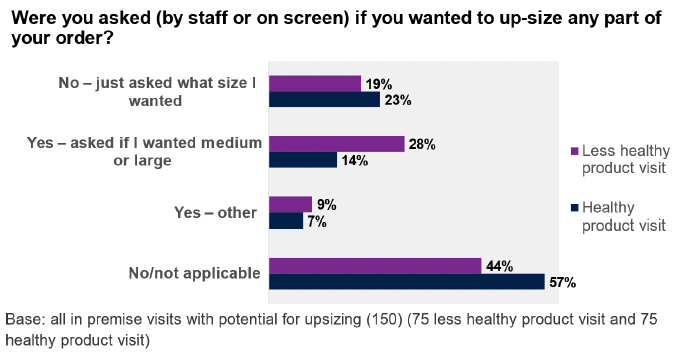
At the 75 outlets where there was the potential for upsizing to occur, it happened at almost twice as many outlets during the less healthy product visit (37%) than the healthier product visit (20%) (Figure 6.1). In 28% (less healthy product visit) and 14% (healthier product visit) of cases, the upsizing took the form of staff asking if shoppers would like medium or large and in 9% (less healthy product visit) and 7% (healthier product visit) of cases shoppers reported that upsizing had occurred in another way. Comments made by shoppers indicated that, in some of these cases where upsizing had occurred in a different way, the default size of item provided was medium or large and shoppers had to specifically ask for a small. In others, shoppers reported that there was only one size available of, for example, hot drinks or that stuffed crust pizzas were only available in large.
In 8% (less healthy product visit) and 21% (healthier product visit) of cases, the member of staff indicated a cost advantage to upsizing.
In 19% (less healthy product visit) and 23% (healthier product visit) of cases shoppers were asked what size they would like but there was no attempt to encourage the purchase of a larger size.
Figure 6.1. Upsizing of orders – healthier versus less healthy purchases
As Table 6.1 shows, shoppers visiting bakeries and coffee shops were more likely to be asked to upsize their order when purchasing a less healthy product than a healthier product (38% versus 0% in bakeries and 45% versus 21% in coffee shops). There was less variation at QSRs (29% versus 23%).
| Product | Bakery (Subway) % | Coffee % | QSR % | Total % |
|---|---|---|---|---|
| Base: all outlets where upsizing is possible (150) (75 Visit 1 and 75 Visit 2) | 16 | 66 | 68 | 148 |
| Mystery shopper asked if they would like to upsize their order – Visit 1 (less healthy) | 38 | 45 | 29 | 37 |
| Mystery shopper asked if they would like to upsize their order – Visit 2 (healthier) | - | 21 | 23 | 20 |
Upsizing was not common in online visits, occurring in only one of the 20 visits. In this instance, the shopper was asked if they would like a larger size of an item.
Upselling
Verbalupselling during visits was more common, and varied less by whether the item purchased was healthier or less healthy. It occurred in 44% of cases where the product was less healthy (Visit 1) and 41% of cases where the product was healthier (Visit 2) (Table 6.2). However, this was based on a very broad definition of upselling which included the 8% (Visit 1 and Visit 2) of visits where the shopper was asked if they wanted anything else (in general). Upselling online occurred in 35% of visits.
| Product | Less healthy product visit % | Healthier product visit % | Online % |
|---|---|---|---|
| Base: all visits | 158 | 158 | 20 |
| No | 56 | 59 | 65 |
| Yes – asked if I "wanted anything else" generally | 18 | 18 | - |
| Yes – told / shown part of a meal deal and I could get crisps/ cake etc. with the items (fruit not mentioned) | 11 | 6 | 5 |
| Yes – told / shown part of a meal deal and I could get other items (fruit mentioned) | 4 | 4 | - |
| Yes – told / shown part of a meal deal and I could get a drink (water /low/ no sugar soft drinks not mentioned) | 1 | 2 | 5 |
| Yes – told / shown part of a meal deal and I could get a drink (water/low/no sugar soft drinks mentioned) | 3 | 3 | 5 |
| Yes – asked / prompted "would you like a drink with that" | 2 | 1 | - |
| Yes – asked / prompted "would you like fries with that" | 1 | 1 | - |
| Yes – asked / prompted to see if I wanted cream/ syrup with my drink | 1 | 1 | - |
| Yes – asked / prompted to see if I wanted cake (or similar) | 1 | 1 | 5 |
| Yes – asked if wanted specific product placed on the till point or checkout screen (e.g. large chocolate bar) | 1 | - | 5 |
| Yes – Other (record) | 1 | 4 | 10 |
Most of the remaining cases of upselling related to meal deals (Table 6.2). As mentioned in Chapter 5, the offering of meal deals within out-of-home businesses was common. Such meal deals are a form of non-verbal upselling – using a price promotion to encourage consumers to purchase items (for example a drink and/or snack) that they may not have originally intended to purchase. Where consumers select items that form part of a meal deal (but have not selected the other items), there is the potential for staff to upsell by pointing out the meal deal offer.
As discussed in Chapter 5, meal deals were most common in supermarkets, convenience stores and QSRs. Among the QSR outlets, verbal promotion of meal deals – asking the shopper if they wanted a meal when they had asked for a burger and fries (at less healthy product visit) or a grilled chicken wrap/salad and fries (at healthier product visit) – varied by brand. At KFC and McDonalds, shoppers were asked if they would like a meal at just over half of the visits (nine of both the 17 visits to KFC and 16 visits to McDonald). Conversely, this only happened at two of the 16 visits to Pizza Hut. Across the brands, there was no variation by whether the product purchased was healthier or less healthy. There were seven instances of water or low/no sugar soft drinks being available as one of the drink options for the meal deal, five of which were at KFC outlets.
Variation across brands also existed within the convenience sector, where shoppers were asked to purchase a sausage roll or equivalent (less healthy product visit) or a chicken/vegetarian salad or sandwich (healthier product visit). Shoppers at Boots outlets were more likely to be told their item was part of a meal deal (seven of 16 visits) than shoppers at Co-op (one of 18 visits) and Spar (one of 20 visits).
There was greater consistency across supermarket brands, with shoppers being told items were part of meal deals in around half of visits and little variation between the less healthy product visit (triple sandwich with processed meat) and healthier product visit (chicken/vegetarian sandwich). The slight exception was M&S Simply Food where shoppers were told about meal deals in four of eight less healthy product visit shops and one of eight healthier product visit shops. Fruit was mentioned at five of the instances of upselling to a meal deal at Tesco Express, compared to one instance at M&S Simply food and none at Sainsbury's.
In 11% of in-premise and 5% of online cases, shoppers visiting outlets were told there was a cost advantage to the upselling.
Product placement
The placement of items near the till point (which may encourage additional consumption) was common, with 69% of outlets using this type of strategy.
Snacks that would be generally classed as less healthy were the most common type of product placed at the till point. This included cakes (including donuts, flapjacks, pancakes, and waffles) (34% of outlets), confectionery (30%), sweet biscuits (29%), crisps and savoury snacks (23%) sweet pastries (22%) (Table 6.3).
Healthier options available at the till point included: fruit or nuts (15%), water (9%), low/no sugar soft drinks (9%) and tea (8%).
| % | |
|---|---|
| Base: All Visit 2 outlets (158) | |
| Cakes | 34 |
| Confectionery | 30 |
| Sweet biscuits | 29 |
| Crisps and savoury snacks (include pretzels, all popcorn) | 23 |
| Sweet pastries e.g., Danish pastries, croissants, pain au chocolat, tarts, flans. | 22 |
| Cereal bars (include protein bars and nature bars etc.) | 18 |
| Fruit or nuts (include dried fruit and dried fruit bars) | 15 |
| Savoury pastries (include sausage rolls, steak or chicken or cheese bakes, pies) | 15 |
| Soft drinks with added sugar | 11 |
| Coffee (All coffee - Americanos, lattes, cappuccinos) | 11 |
| Water (plain – still, sparkling or hint of fruit) | 9 |
| Low/no sugar soft drinks | 9 |
| Tea (all teas and herbal teas) | 8 |
| Sandwiches/filled rolls/wraps etc. (include paninis, subs and toasties but not burgers) | 7 |
| No products | 30 |
Other (non-price) promotion of products
Other types of promotions were recorded at around a quarter (26%) of the in-premise visits. Most commonly, these other strategies were the use of prominent posters (53% of other promotions recorded) and screen displays (14%) to advertise or promote specific products. A further 9% of these promotions were branded items such as coffee cups, 7% were item displays and 7% were adverts on digital screens you can order from.
Finally, 11% were recorded as "other" types of advertising – which included the advertisement of specific products using sandwich boards outside of outlets, shelf labelling and floor stickers.
Shakes/frappes were the most frequently advertised product (17%) using non-price promotions (Table 6.4). These were followed by sandwiches (8%) and coffee, either traditional coffee (8%) or specialist coffee (8%). A further 6% were on pizza and the same proportion on soft drinks with added sugar.
| % | |
|---|---|
| Base: All products advertised in other promotions (52) | |
| Shakes/frappes | 17 |
| Sandwiches/filled rolls/wraps etc. (include paninis, subs and toasties but not burgers) | 8 |
| Coffee (all coffee - Americanos, lattes, cappuccinos) | 8 |
| Specialist coffees (with added syrups/cream) | 8 |
| Pizza (slices, half and whole pizzas) | 6 |
| Soft drinks with added sugar | 6 |
| Confectionery | 4 |
| Low/no sugar soft drinks | 4 |
| Other cold drink | 4 |
| Salad (meal) | 4 |
| Sweet pastries e.g., Danish pastries, croissants, pain au chocolat, tarts, flans | 4 |
| Burgers (include beef, chicken, vegetarian, filet-o-fish) | 2 |
| Fruit or nuts (include dried fruit and dried fruit bars) | 2 |
| Hot chocolate | 2 |
| Ice cream | 2 |
| Salad or vegetable sides | 2 |
| Sweet biscuits | 2 |
| Tea (all teas and herbal teas) | 2 |
| Water (plain – still, sparkling or hint of fruit) | 2 |
| Other | 8 |
Contact
Email: socialresearch@gov.scot