Research Commercialisation Proof of Concept Fund - Equality and Diversity Report
Proof of concept 25/26 equality and data report
1.3 Proof of Concept Fund Applicants Diversity Data Overview
1.3.1 Age
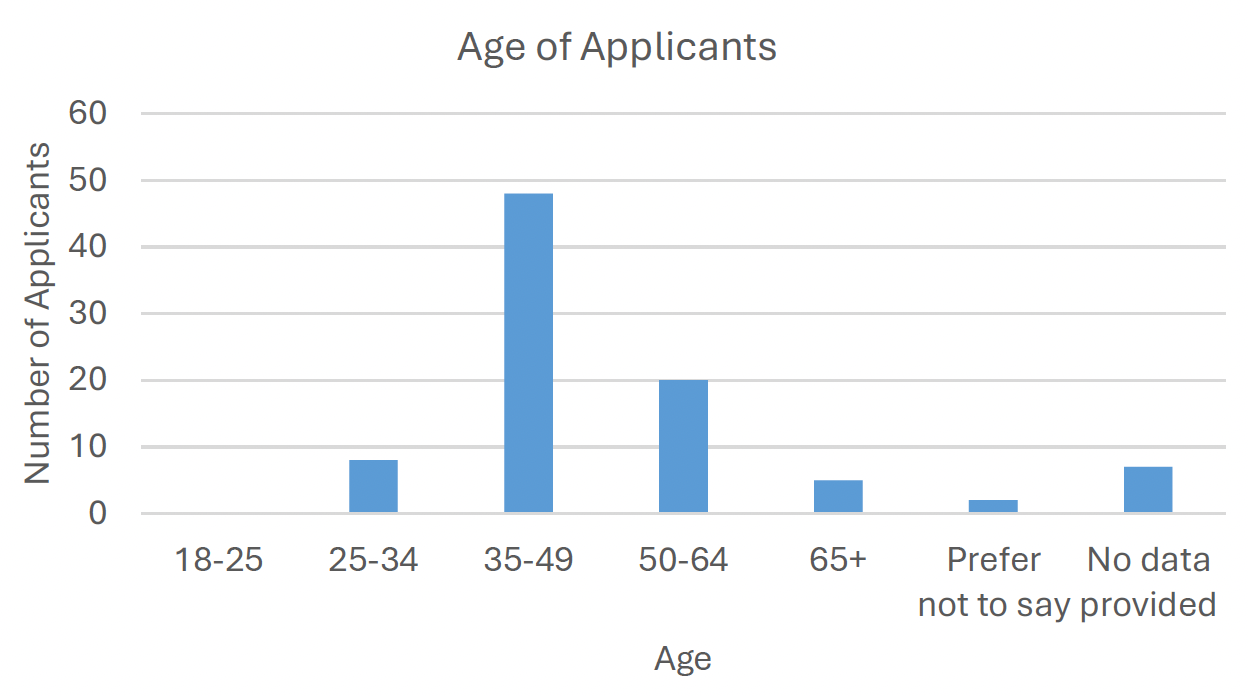
The first question asked applicants, ‘What is the age category of the lead applicant’ (Figure 1).
From the 89 applicants to the fund, the majority of applicants, 53%, were in the age group 35-49. The age category 50-64 was the next highest, with 22% of applicants in this category. The category that had the lowest number of applicants was 18–25, there were no applicants in this age category. Around 8% of applicants provided no diversity data, and 2 % opted for the ‘prefer not to say’ option.
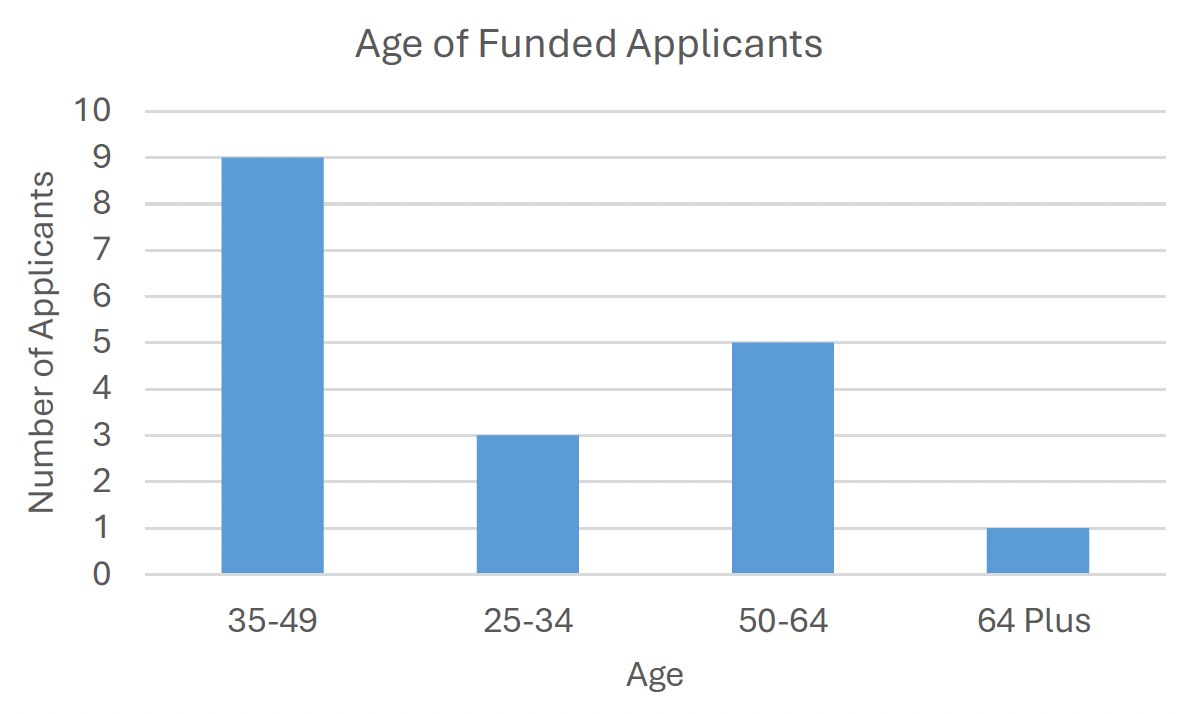
Specifically looking at the age of the 18 funded applicants only (Figure 2), 9 (50%) were in the age category of 35-49, with the next largest age category being 50-64, with the age category of 25-34 having 3 (17%) of the 18 funded applicants. Finally, 1 applicant was from the age category of 64 plus.
1.3.2 Gender
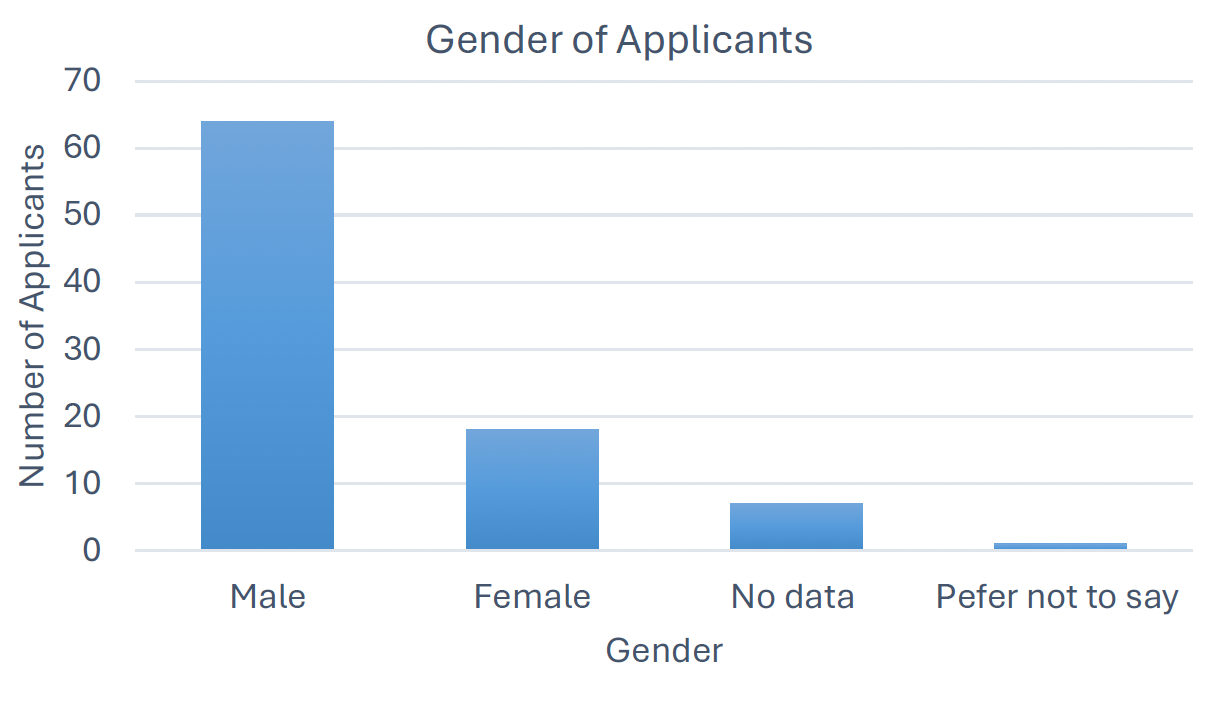
The second question asked applicants ‘What is your gender’ (Figure 3). Recent reports including the Pathways report [1](2023) and the Rose review (2019) [2] showed that women are under-represented in Scotland’s entrepreneurial ecosystem.
The data collected mirrors this with 71% of applicants identifying as male and 20% of applicants identifying as female. The remaining 8% did not provide a response and 1% opted for prefer not to say.
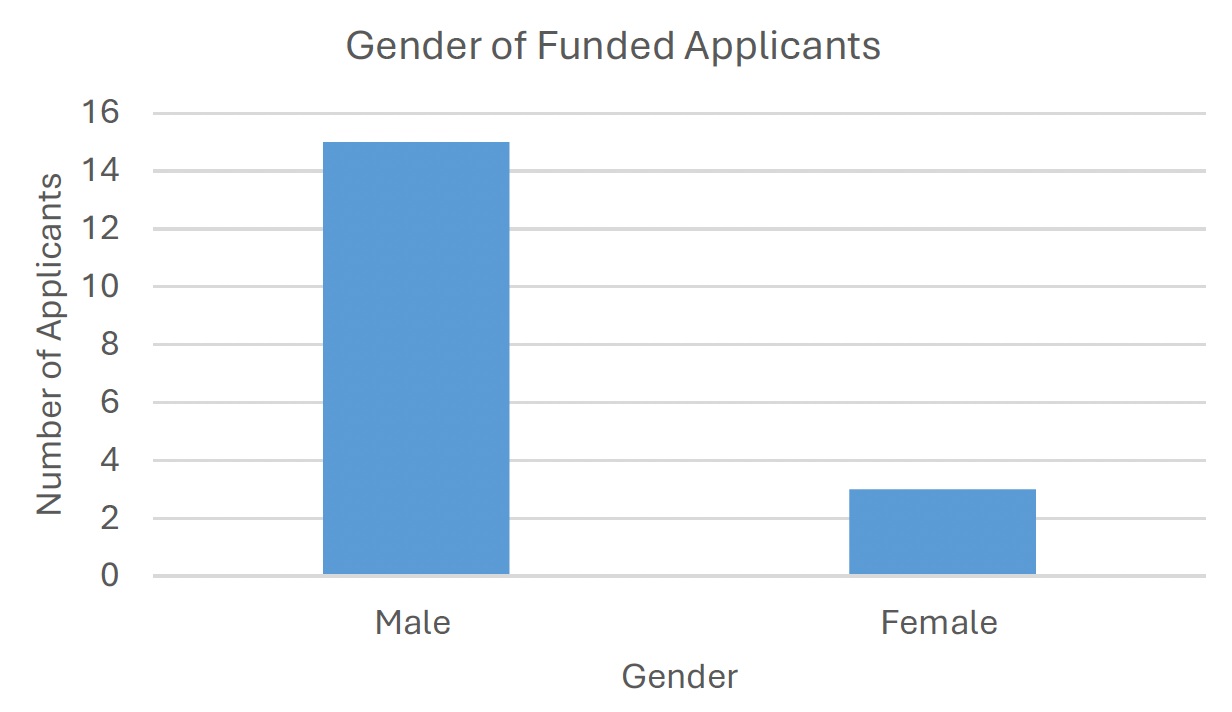
Specifically looking at the 18 funded applicants (Figure 4), 15 identify as male and 3 as female. This number, although low for female led projects, represents 17% of all funded projects in line with the total number of female applicants.
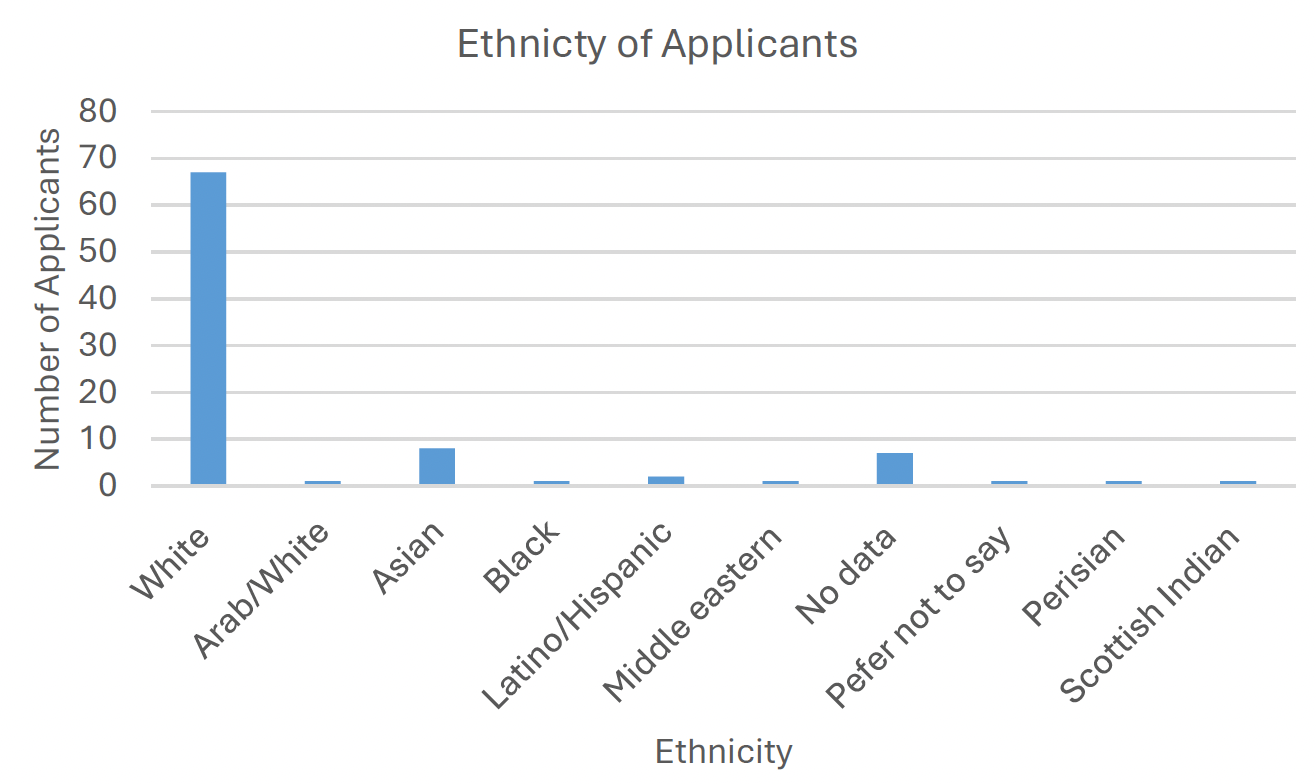
1.3.3 Ethnicity
Applicants were asked what ethnicity they feel best describes them (Figure 5), and were given the option to self-describe.
Data collected found that 67 of 89 (75%) applicants identified as ‘white’, the biggest group after that was Asian, 8 of the applicants (9%). Other ethnicities including Black, Latino/Hispanic, Middle Eastern, Scottish Indian, Persian and Arab were all selected by at least one applicant. Additionally, 7 (8%) applicants did not provide a response.
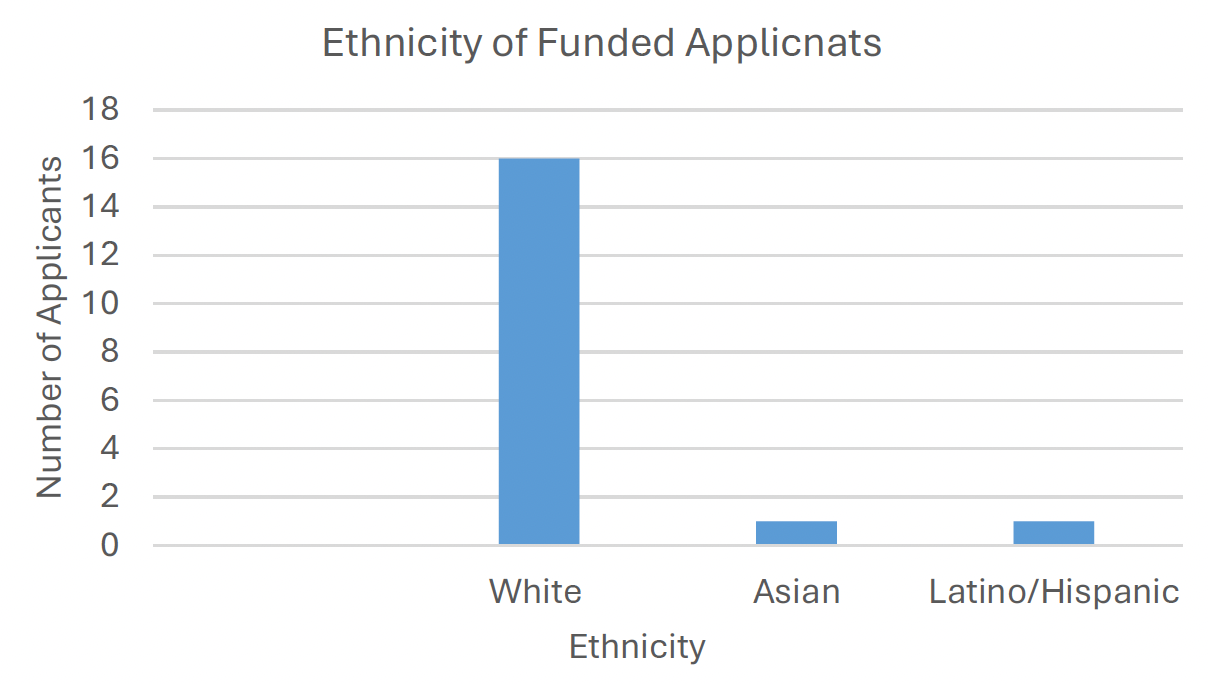
Specifically looking at the funded applicants (Figure 6), 16 of the 18 (89%) applicants identified their ethnicity as ‘white’ with 1 applicant identifying as Asian and another as Latino/Hispanic.
1.3.4 Trans history
Applicants were asked if they describe themselves as ‘trans’ or have a trans history (Figure 7). 90% of all applicants stated they have ‘No’ trans history, with 1% of applicants answering ‘Yes’ to this question, a further 9% did not provide an answer or selected prefer not to say.
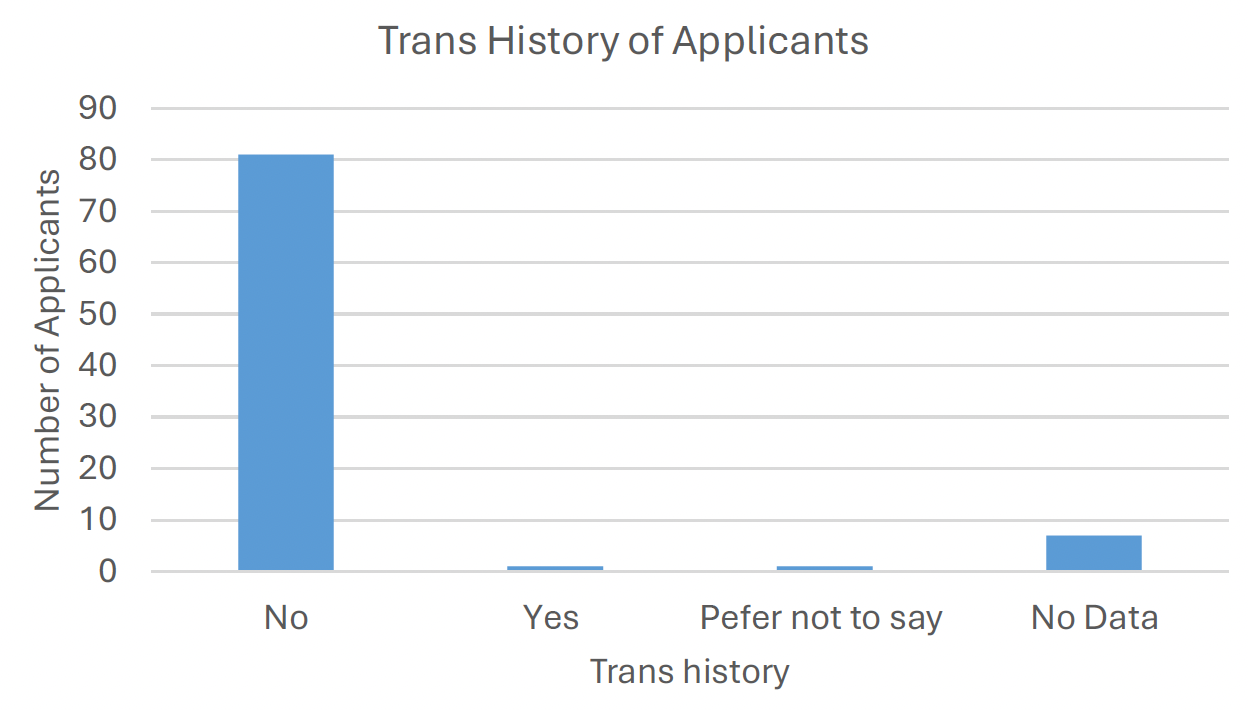
Of the 18 funded applicants, all 18 said ‘No’ to having a trans history.
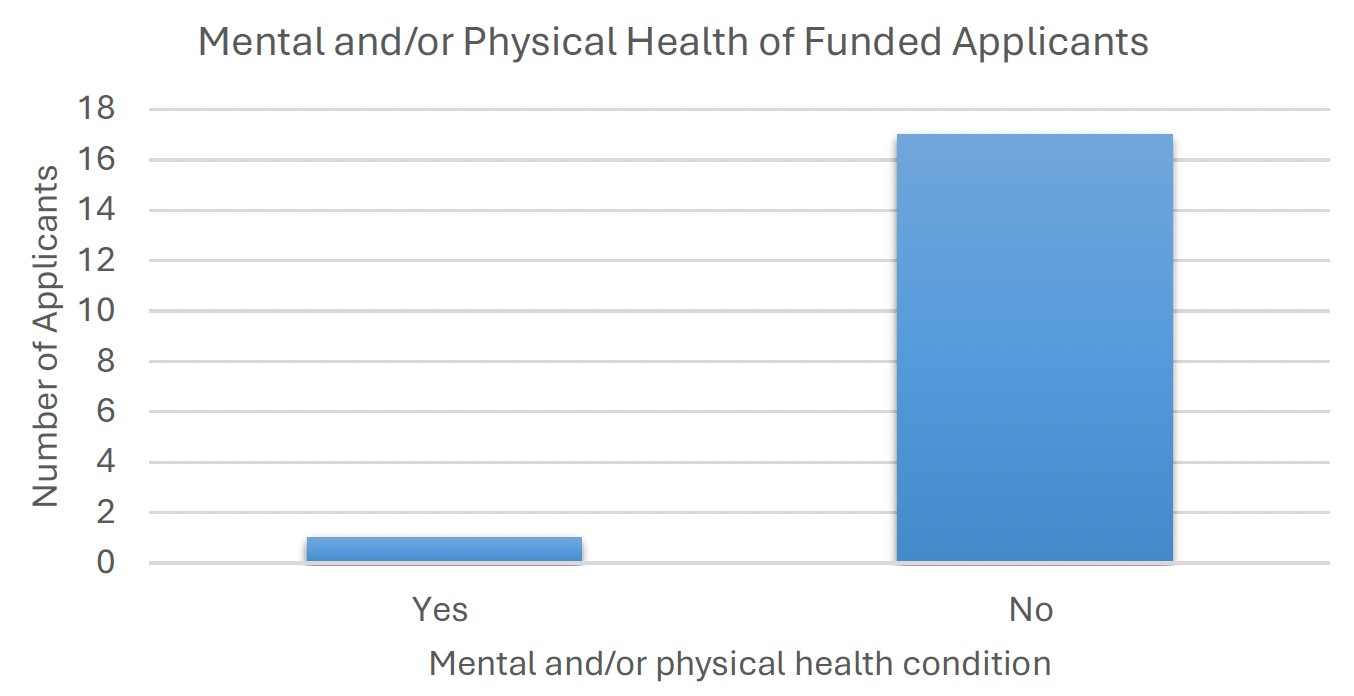
1.3.5 Health Conditions
Applicants were asked if they have any physical and/or mental health condition(s) or illness lasting, or expecting to last, 12 months or more (Figure 8). This is as per the definition in The Equality Act 2010. Of the 89 applicants, 81% answered ‘No’ with 6% of applicants answering ‘Yes’. In response to this question 5% of applicants answered prefer not to say.
There was an optional question for applicants who had answered yes to provide details of any health conditions, those highlighted include visual impairment, autism and motor neuron disease (MND).
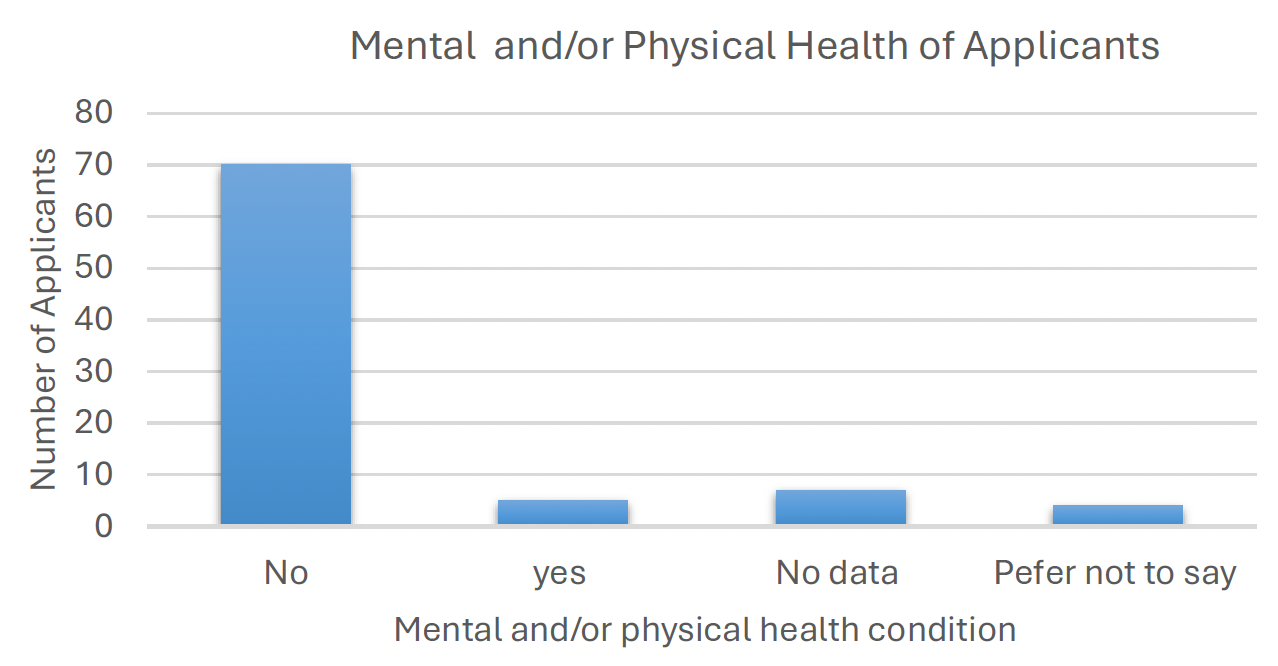
Of the 18 funded applicants, only 1 answered yes to having a physical or mental health condition, with the other 17 applicants answering ‘No’ (Figure 9).
1.3.6 Socio-Economic Background
To achieve an understanding of the applicant’s socio-economic background a range of questions were asked, in line with The Scottish Government guidance on understanding socio-economic background.
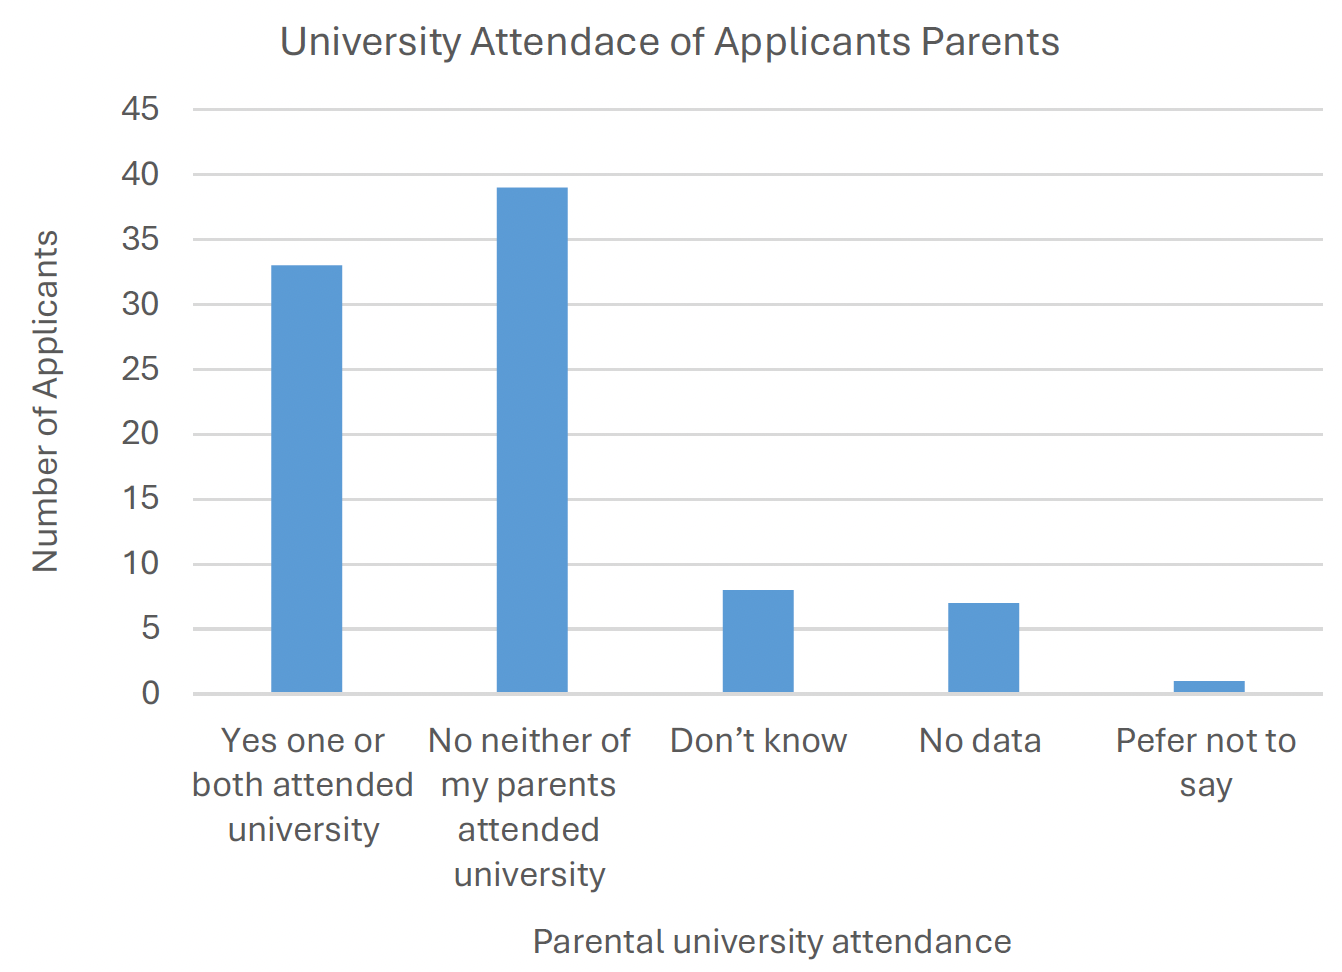
Firstly, applicants were asked ‘Did either of your parents or guardians attend university by the time you were 18?’ (Figure 10). The most common answer was ‘No’ with 39 out of 89 (44%) applicants answering ‘No’ and 33 of the 89 (37%) applicants answering ‘Yes’ with 7 applications providing no data.
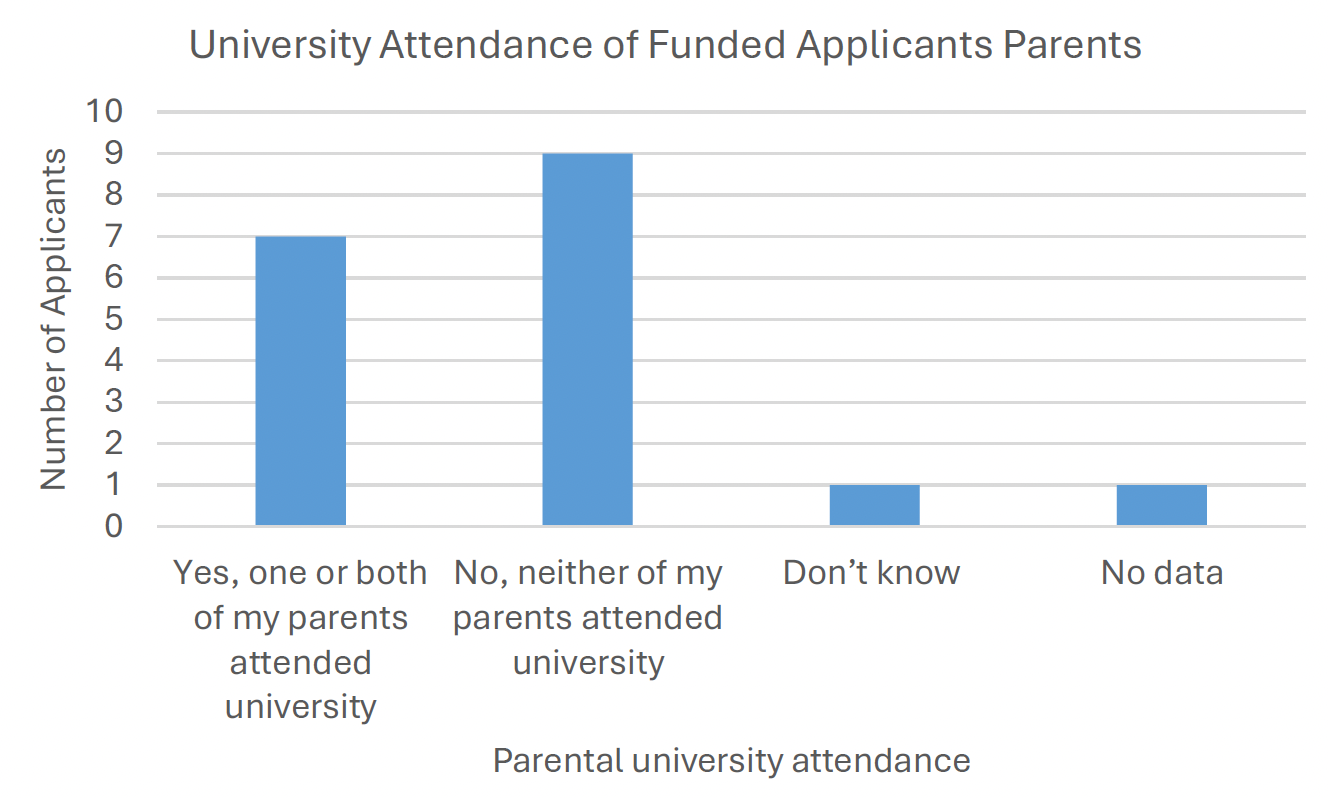
Specifically looking at the 18 funded applicants (Figure 11), the most common answer was ‘No neither parents attended university’ with 9 out of 18 (50%) applicants answering ‘No’ and 7 of the 18 (39%) applicants answering ‘Yes one or both attended university’ with 2 applicants providing no data.
The question that followed was ‘What is the highest level of qualification achieved by either of your parent(s) or guardian(s) by the time you were 18?’ (Figure 12).
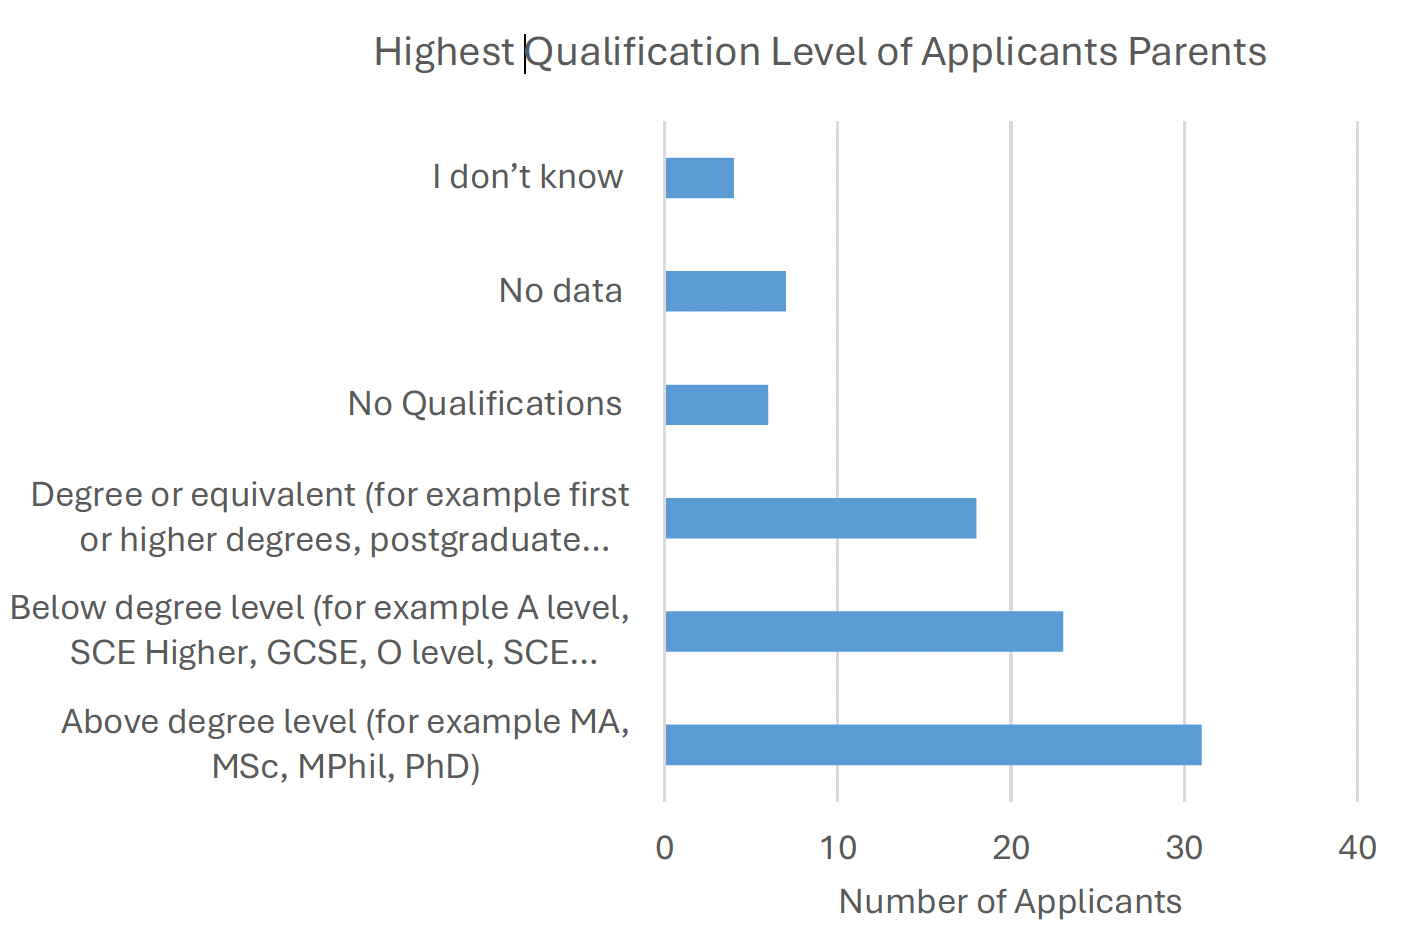
The most common answer was above degree level i.e. MA, PHD, MSc, with 31 of 89 (35%) applicant’s parents or guardian achieving above degree level qualifications by the time they were 18. The next most common answer for this question was ‘below degree level’ with 23 of 89 applicants (26%)’ selecting this response. This indicates that a majority of parents/guardians have some level of formal education, with a particularly strong skew towards higher education.
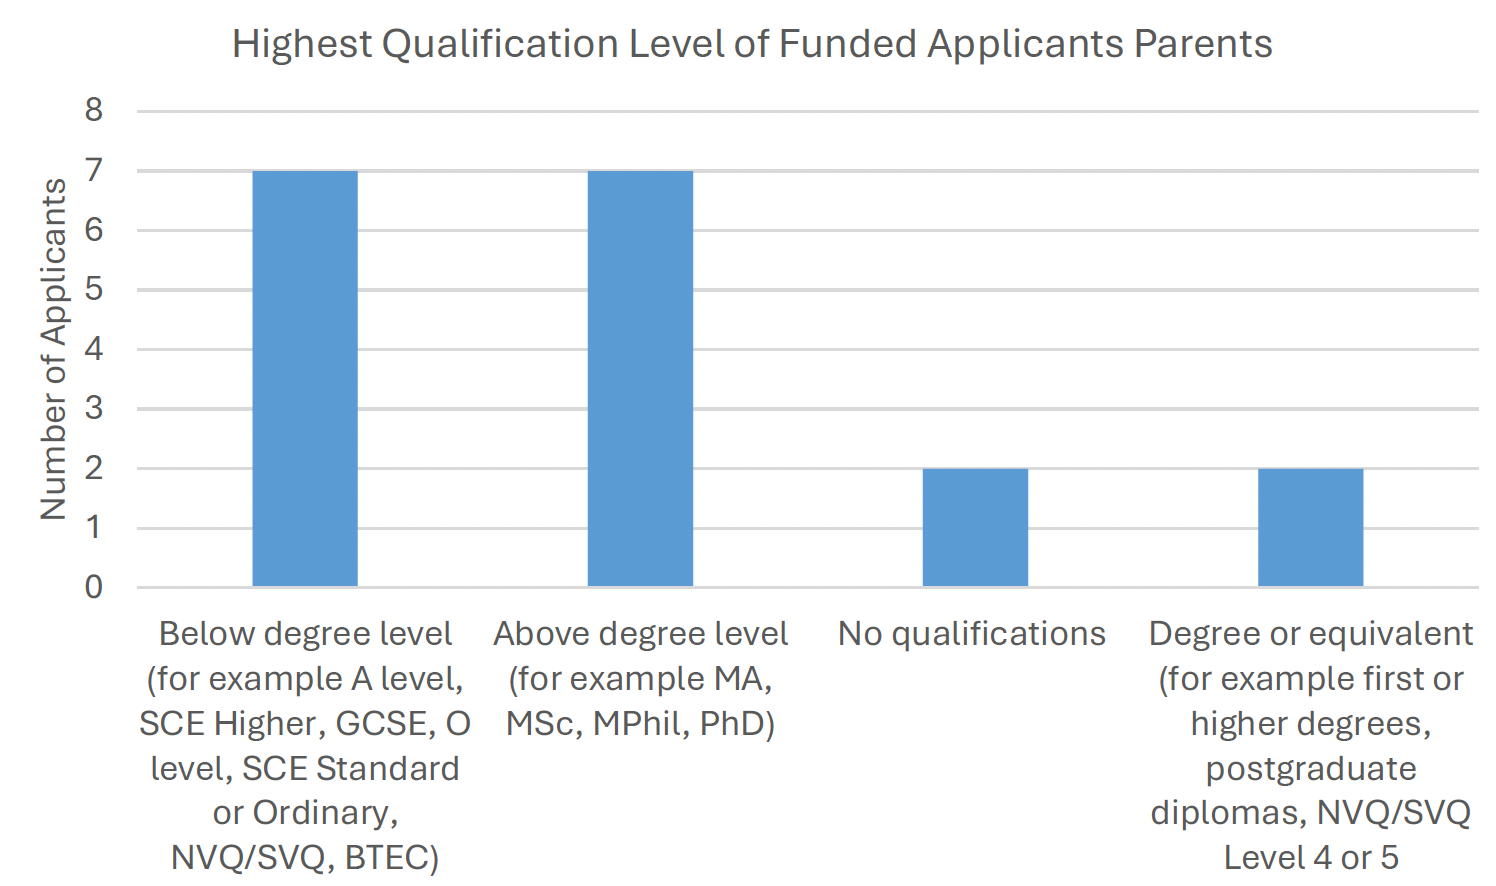
Specifically looking at the 18 funded applicants (Figure 13), 7 (39%) applicants’ parents’ highest qualification was above degree level and another 7 (39%) applicants’ parents or guardian was below degree level. Additionally, 2 (11%) of the applicants’ parents or guardian had no qualifications by the time the lead applicant was 18 and 2 other lead applicants’ parents or guardians had a degree level qualification.
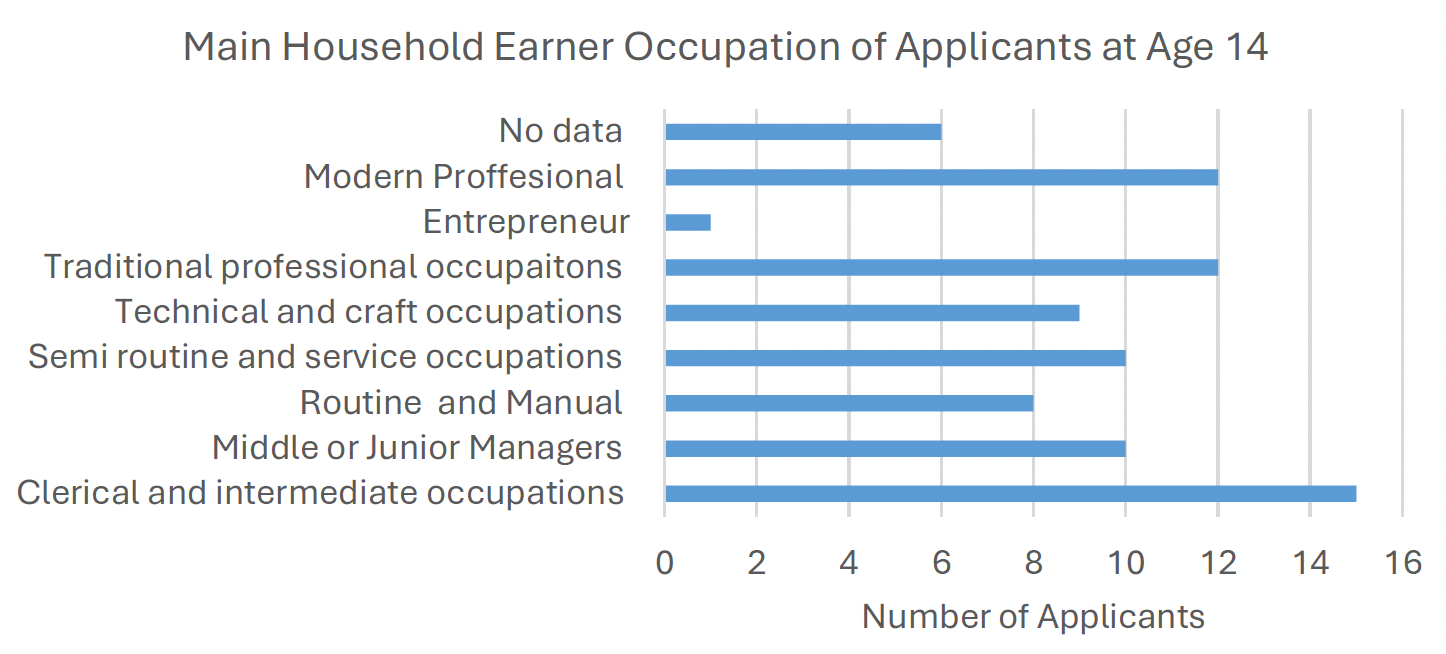
The final set of questions on socio economic background asked, ‘What was the main household earners occupation when the applicant was age 14?’ (Figure 14). In response, 15 of 89 (17%) applicants main household earner was ‘Clerical and intermediate occupations’. One applicant reported that the main household earner was an entrepreneur.
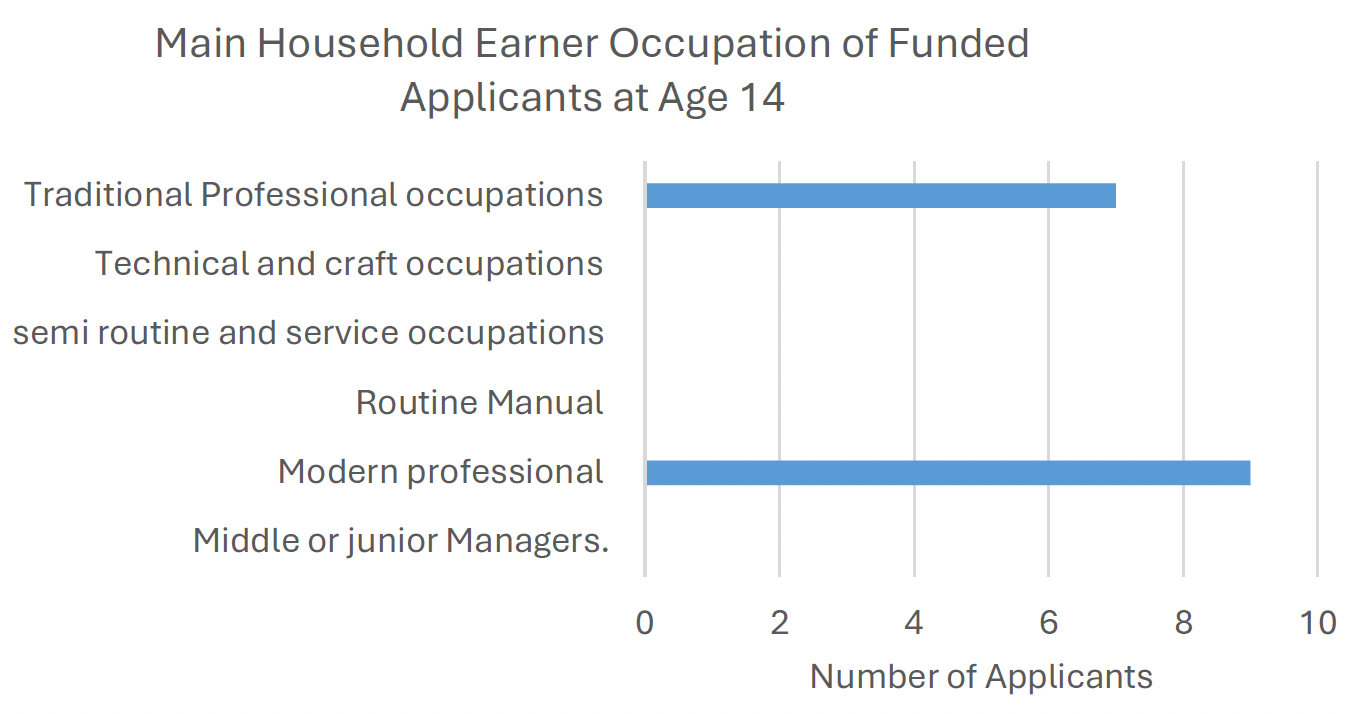
Of the 18 funded applicant’s (Figure 15) ‘Modern professional’ was the highest category with 9 of 18 (50%) applicants main household earner being modern professional, the next largest with 7 (38%) lead applicants’ parent or guardian were traditional professional occupations.
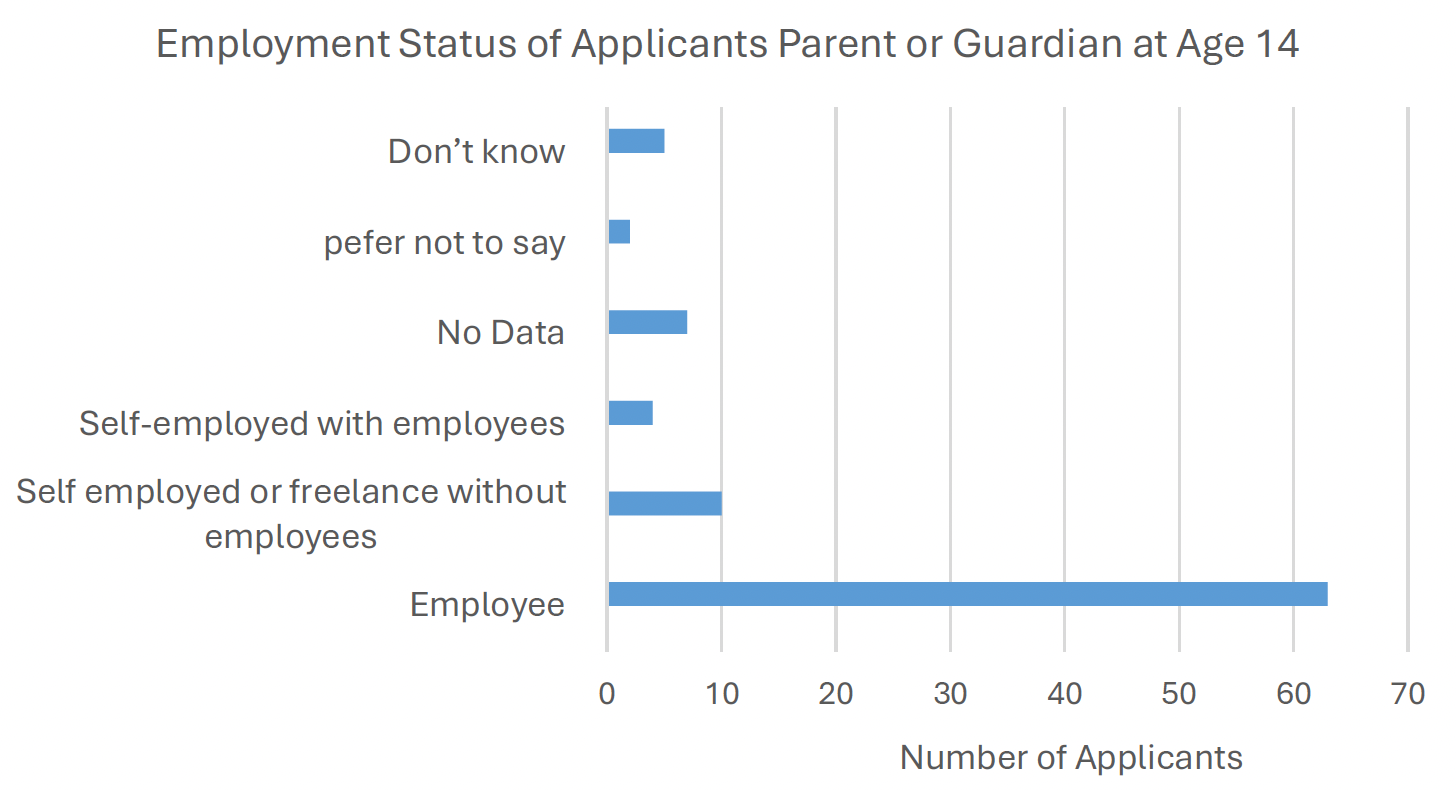
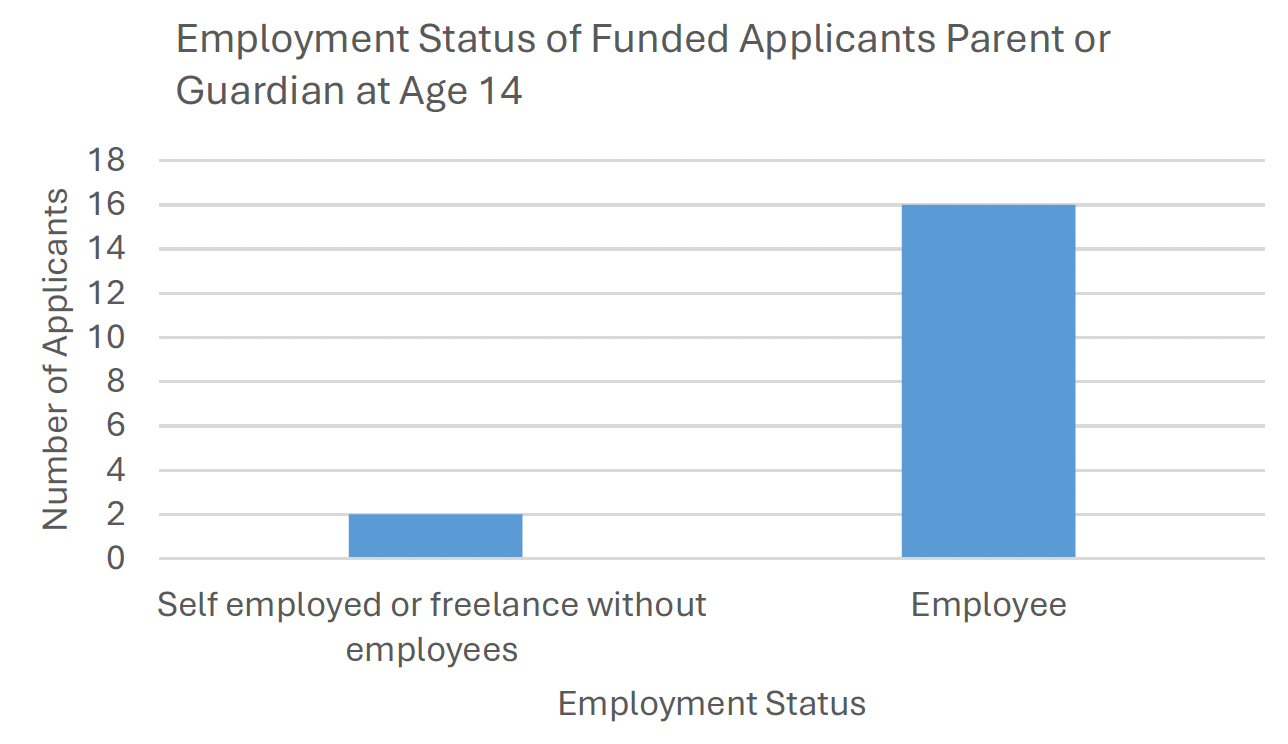
Finally, applicants were asked, ‘Did the main household earner when the applicant was 14, work as an employee or self-employed/ freelance either with employees or without?’ (Figure 16).
Of the applicants, 63 of 89 (71%) main household earner at 14 was an employee, 10 (11%) applicant’s main household earner was self-employed or freelance without employees. With 4 of the 89 being self-employed with employees.
Of the 18 funded applcinats, 16 applicants main household earner worked as an employee with just 2 responding that the main household earner worked as self employed or freelance (Figure 17).
Contact
Email: Spinouts@gov.scot