Report on razor clam surveys on Tarbert Bank
This report describes a survey carried out on Tarbert Bank in 2023 to estimate the densities and sizes of razor clams, Ensis siliqua and Ensis magnus. The survey was conducted as part of the Scottish Government’s electrofishing scientific trial.
Results
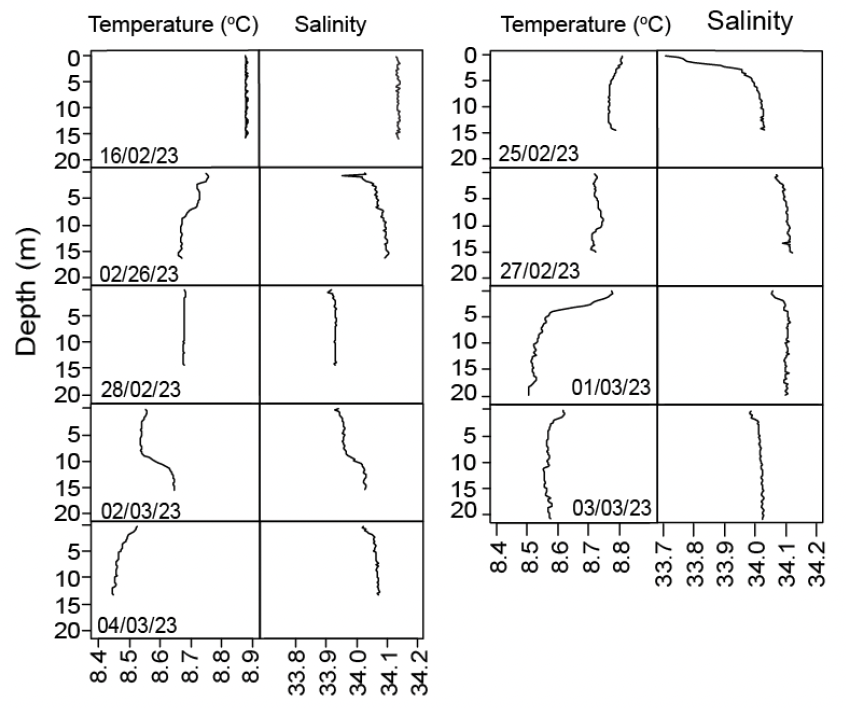
Water column
As expected, based on the strong tides around the bank the water column was largely well mixed although with a slight halocline at around 5 m depth on some days (Figure 7). Water temperatures were between 8.4 and 8.9°C and salinities between 33.7 and 34.2.
Video tows
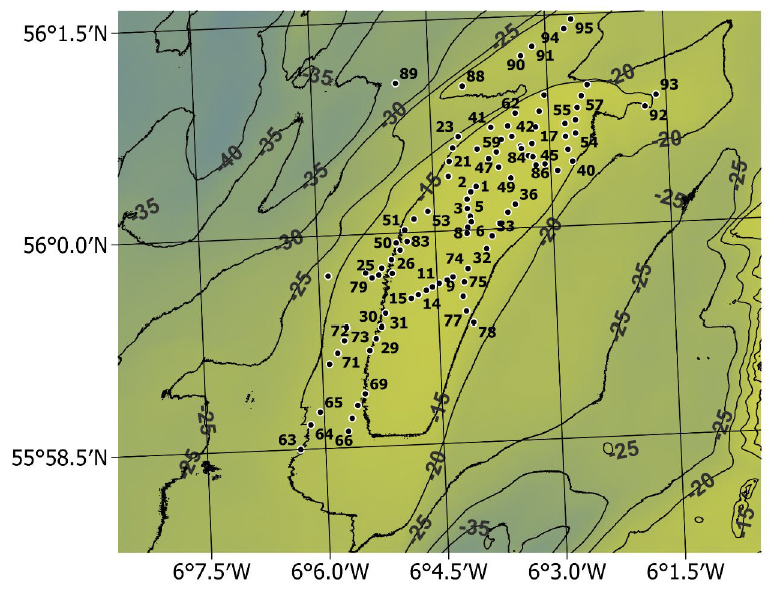
Summaries of the video tows are given in Appendix 1. A total of 95 tows were completed with 55 of these being north of latitude 56ºN and 40 being in the presently unfished area of the bank south of 56ºN (Figure 8).
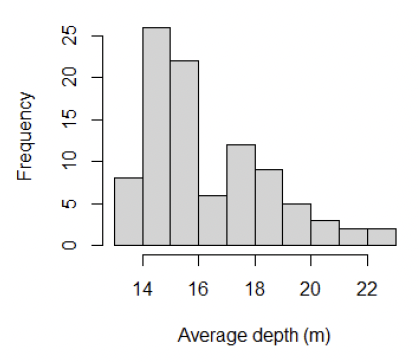
The commercial razor clam diving operations tend to be restricted to relatively shallow depths, typically less than 18 m but 21 tows were conducted in deeper water down to 22.5 m (Figure 9). The aim was to see whether there are repositories of Ensis below the normal diving depths which might act as a reservoir supporting recruitment of young razor clams to the shallower waters.
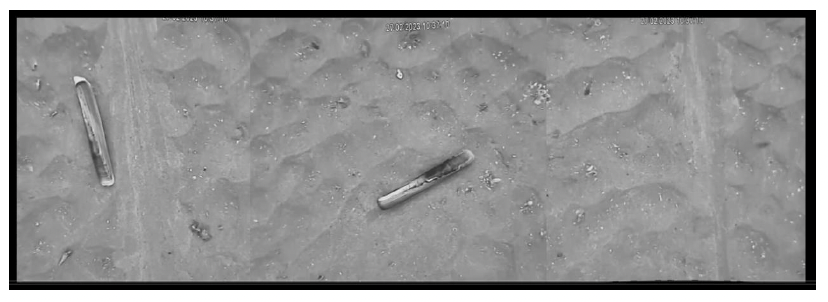
The video equipment worked well with the rig settling into the correct configuration on nearly all the tows at the first deployment. On a few occasions when there was a strong cross-tide the equipment became twisted and had to be re-set, but this did not cause any substantial delays or damage to the cameras or cables. The MacArtney Luxus cameras produced clear images even on the deepest tows allowing easy identification of razor clams resting on the sediment (Figure 10).
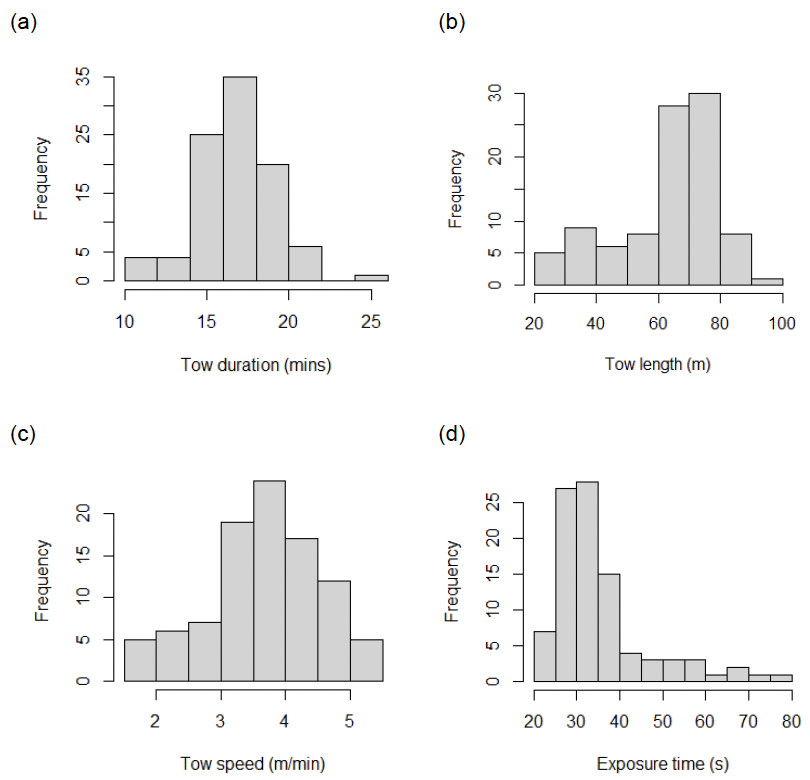
The mean tow duration was 17 minutes (± 2.7 std dev) with only a few tows having to be terminated early due to concerns about changing sea conditions (Figure 11a). The majority of tows were longer than 50 m (Figure 11b) which was the minimum distance recommended in Fox (2019) to produce cost-effective improvements in errors around mean density estimates. However, based on simulations it was also concluded that the expected 95% error of the true mean density should be as low as 10% when 30 or more individual tows are made in an area. In summary, the precision of the mean density estimates are likely to be more strongly influenced by increasing the number of video tows from an area, rather than substantially increasing the lengths of individual tows. However, towing speed is also an important consideration as it influences the length of time any area of the seabed is exposed to the electrical field during the tow (Figure 11c). Towing speeds varied between 1.6 and 5.4 m min-1 (3.7 ± 0.9 mean ± std dev) so that most of the exposure times were longer than 30 seconds (Figure 11d). Although it has always been assumed that the electrofishing technique is efficient, this has never been scientifically tested in the field. The relationship between electrical exposure time and razor clam emergence rates was therefore studied in a depletion experiment conducted on 4th March 2023 and described later in this report.
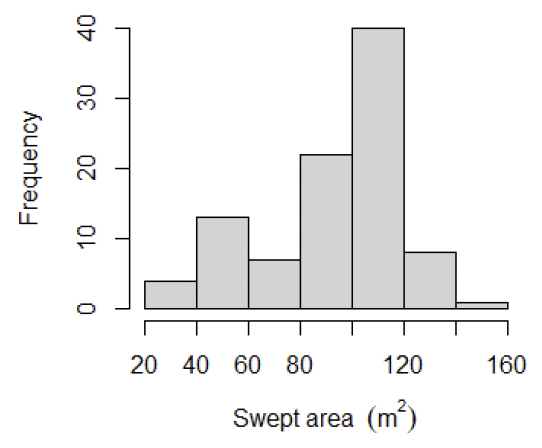
The average swept area on the video tows was 93 ± 27 m2 (mean ± std dev) with most tows being above the minimum 75 m2 recommended by Fox (2019) to produce improvements in errors in mean density estimates (Figure 12).
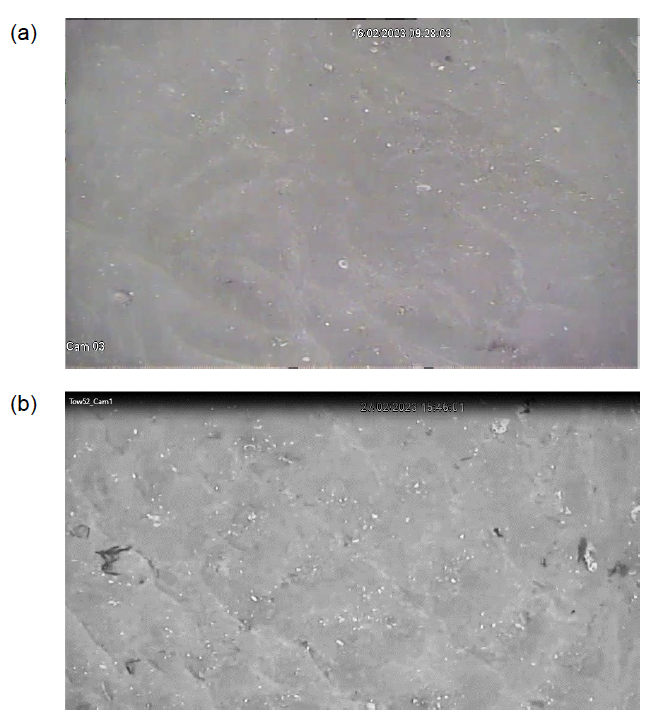
From the video observations, the sediments on the top of Tarbert Bank appear to consist of fine rippled sand mixed with ground shell fragments (Figures 13 a and b).
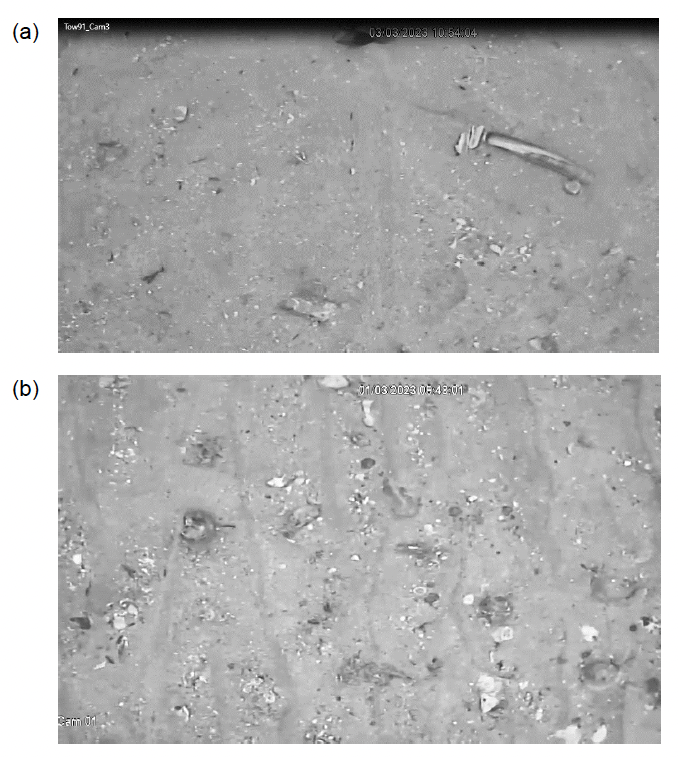
Off the northern end of the bank the sediment appeared to be slightly coarser with more shell fragments (Figure 14a) whilst in the deeper water off the southern end of the bank the sediment again appeared to contain coarser fragments of shell compared with the shallower tows (Figure 14b).
Razor clam emergence and depth
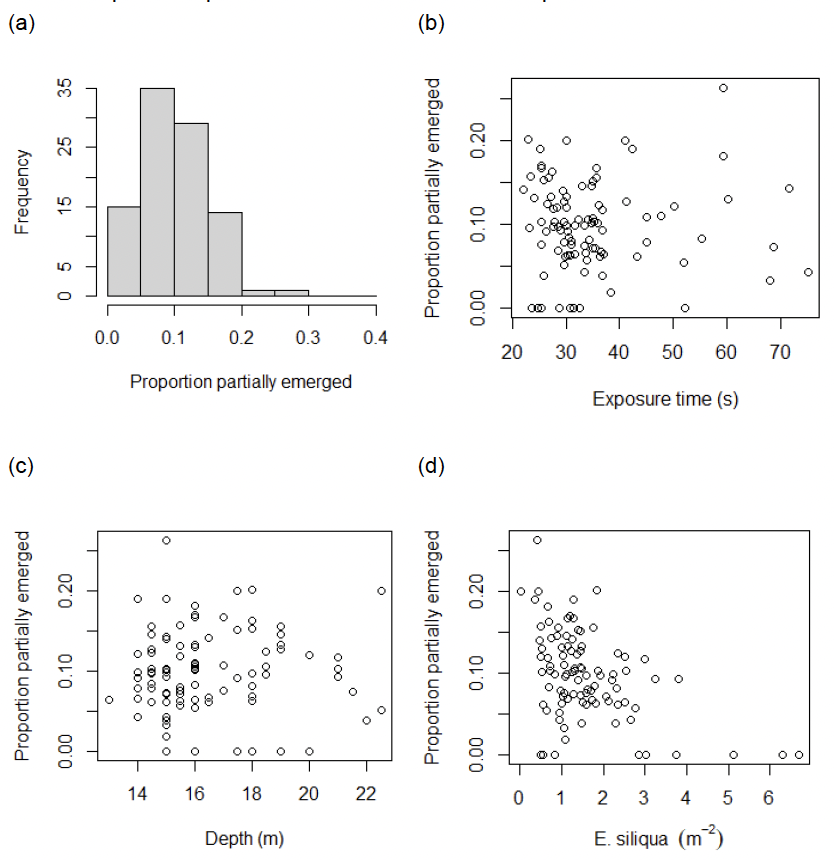
The mean percentage of razor clams which were partially emerged was 9.8 ± 5.4 % (mean ± std. dev.) of the total razors observed on the videos (Figure 15a). There was no obvious relationship between percentage partial emergence and mean exposure time (Figure 15b) or water depth at the time the videos were recorded (Figure 15c). There did appear to be some relationship with mean E. siliqua densities (Figure 15d) but this could be artefactual with the apparent relationship reflecting the low number of tows where the mean densities of razor clams were greater than 2 m-2. Counts of razors which had partially emerged were assigned as E. siliqua or E. magnus based on the species ratio of fully emerged individuals. Since the number of fully emerged razor clams exceeded the partial emerged count by at least three times on every tow, this is not expected to have contributed any substantial error to the final density estimates of each species. The relationship between electrical stimulation exposure and emergence was studied further in a series of depletion experiments described later in this report.
Razor clam size distributions
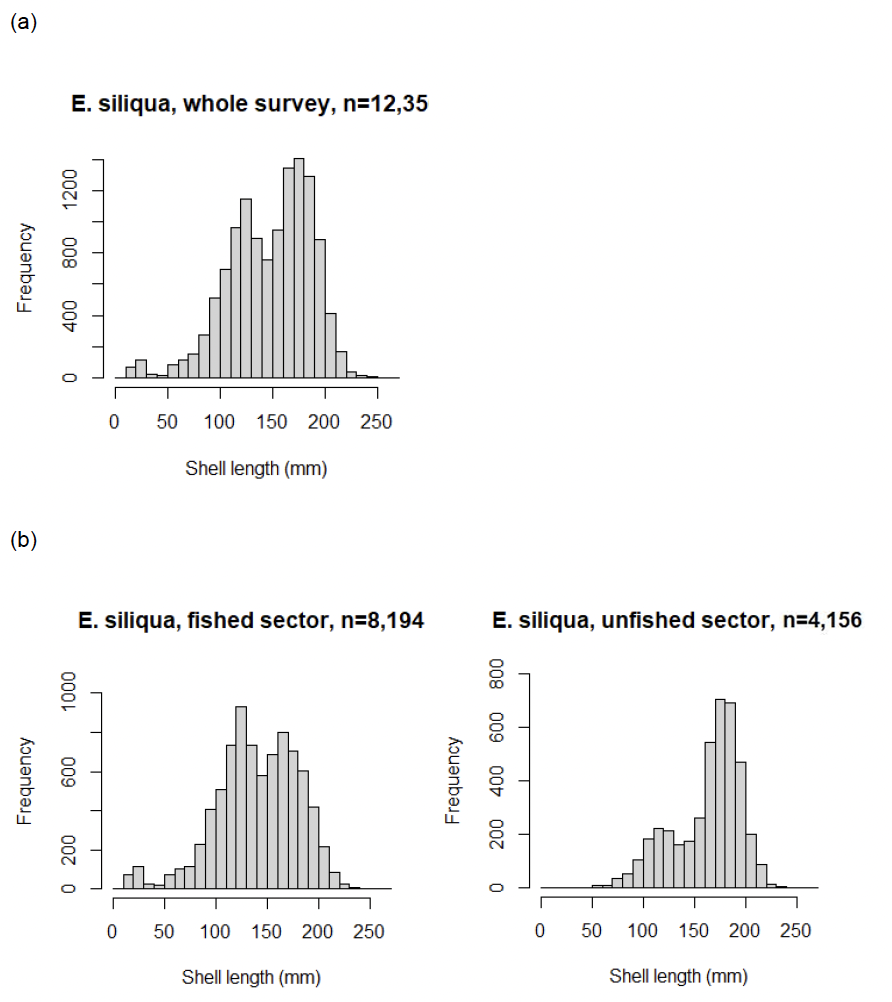
Pooling the E. siliqua length data (class 1 objects) from all the tows suggests there were two main size modes, one at around 120–130 mm and the other around 170–180 mm (Figure 16a). There were also a small number of clams of less than 50 mm shell length which were assumed to be E. siliqua because of the dominance of this species at the locations where these very small razors were recorded. The size distribution of E. siliqua on the fished sector (north of latitude 56ºN) was similar to the overall pattern, but the mode of the larger sizes was slightly smaller at 160–170 mm (Figure 16b). In comparison, the size distribution of E. siliqua in the unfished sector (south of latitude 56ºN) was dominated by larger clams with the mode at 170–180 mm. There were proportionally less medium-sized razors (100 to 150 mm shell length) and no very small razors (< 50 mm).
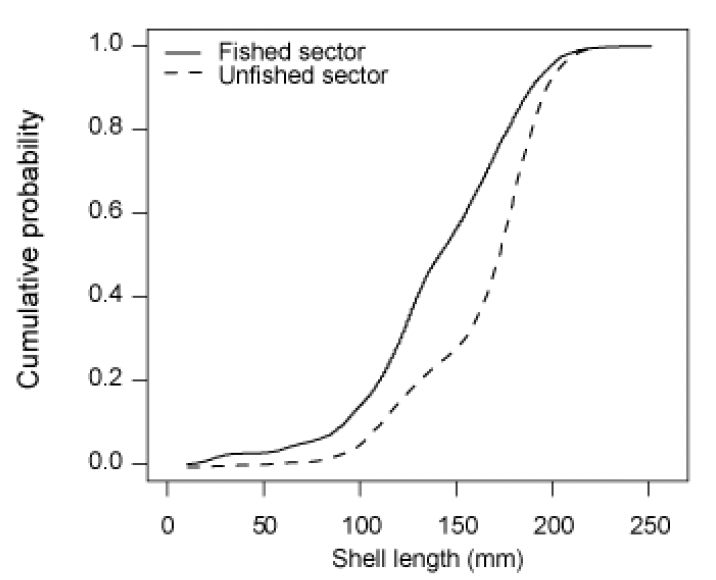
The differences in the shell length distributions between the presently fished and unfished areas of Tarbert Bank can be better seen as empirical cumulative density plots which standardise for the different numbers of Ensis measured in the two areas (Figure 17). The two distributions are different at a high level of significance (Monte Carlo two-sided Kolmogorov-Smirnov test, D = 0.307, p = 0.0005). This shows that there are a greater proportion of small and medium sized Ensis in the fished area and the dominance of larger razor clams in the presently unfished part of Tarbert Bank.
Ensis magnus are not normally collected by this fishery so the data are not plotted for this species. The mean shell length for E. magnus was 118 ± 2.5 mm (mean ± std dev) based on 570 observations.
Razor clam densities
Summary statistics for the razor clam densities are given in Table 1. The maximum density of E. siliqua of 6.68 m-2 was found in the northern fished sector. In the southern sector the maximum density was 2.99 m-2. Mean densities were 1.57 ± 0.11 (mean ± SE) for the whole survey, and 1.87 ± 0.17 and 1.16 ± 0.11 m-2 for the northern and southern sectors respectively.
| Shell size | Area | Tows | Zero counts | Min | Max | Median | Mean | SE | 95% CI | Std Dev |
|---|---|---|---|---|---|---|---|---|---|---|
| Large | All | 95 | 1 | 0.00 | 2.57 | 0.79 | 0.83 | 0.05 | 0.10 | 0.50 |
| North | 55 | 0 | 0.06 | 1.88 | 0.82 | 0.82 | 0.05 | 0.10 | 0.37 | |
| South | 40 | 1 | 0.00 | 2.57 | 0.65 | 0.84 | 0.10 | 0.20 | 0.64 | |
| Medium | All | 95 | 1 | 0.00 | 4.65 | 0.34 | 0.57 | 0.08 | 0.15 | 0.75 |
| North | 55 | 0 | 0.11 | 4.65 | 0.52 | 0.80 | 0.12 | 0.24 | 0.90 | |
| South | 40 | 1 | 0.00 | 1.60 | 0.20 | 0.26 | 0.04 | 0.08 | 0.25 | |
| Small | All | 95 | 5 | 0.00 | 2.39 | 0.06 | 0.17 | 0.03 | 0.07 | 0.34 |
| North | 55 | 2 | 0.00 | 2.39 | 0.10 | 0.26 | 0.06 | 0.11 | 0.42 | |
| South | 40 | 3 | 0.00 | 0.67 | 0.04 | 0.06 | 0.02 | 0.03 | 0.10 | |
| All | All | 95 | 0 | 0.02 | 6.68 | 1.30 | 1.57 | 0.11 | 0.23 | 1.12 |
| North | 55 | 0 | 0.47 | 6.68 | 1.49 | 1.87 | 0.17 | 0.34 | 1.27 | |
| South | 40 | 0 | 0.02 | 2.99 | 1.06 | 1.16 | 0.11 | 0.22 | 0.70 |
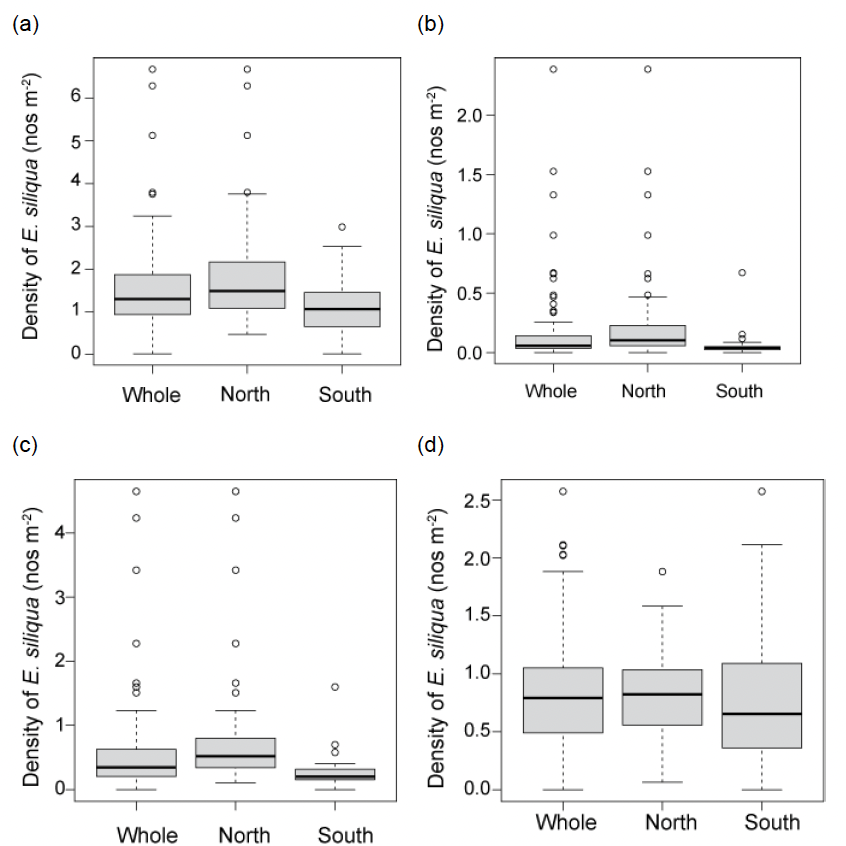
However, the distributions of the densities tended to be right-skewed (Figure 18) so that the median densities were slightly lower at 1.30 m-2, for the whole survey, and 1.49 and 1.06 m-2 for the northern and southern sectors respectively.
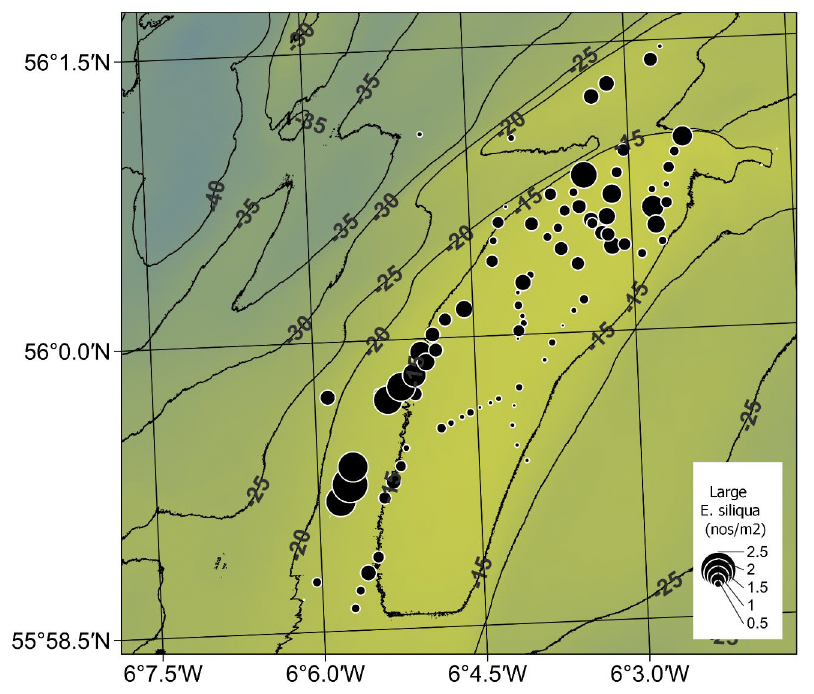
The spatial density distribution of E. siliqua is shown in Figures 19, 21 and 23. It should be noted that the tidal elevation on Tarbert Bank is approximately up to 3.5 m above chart datum on and 0.5 m above chart datum at low water on spring tides, so one needs to add approximately 1.5 m to the charted depths to derive the average water depth over a whole tidal cycle at a tow location. The actual water depths above chart datum will also be influenced by wind conditions and the topography of the bank.
The maximum density of large E. siliqua (≥ 150 mm shell length) was observed in the southern unfished sector at 2.57 m‑2 (Table 1). Here the highest densities of large razors appeared to follow the curve of the bank between the 20-15 m depth contour (Figure 19). Densities were lower moving to the east but it is difficult to determine the westerly extent as tows deeper than 20 m were generally not possible with the electrical cables available. In the presently fished sector (north of 56ºN) larger sized E. siliqua were more broadly distributed with a maximum of 1.88 m-2 (Table1).
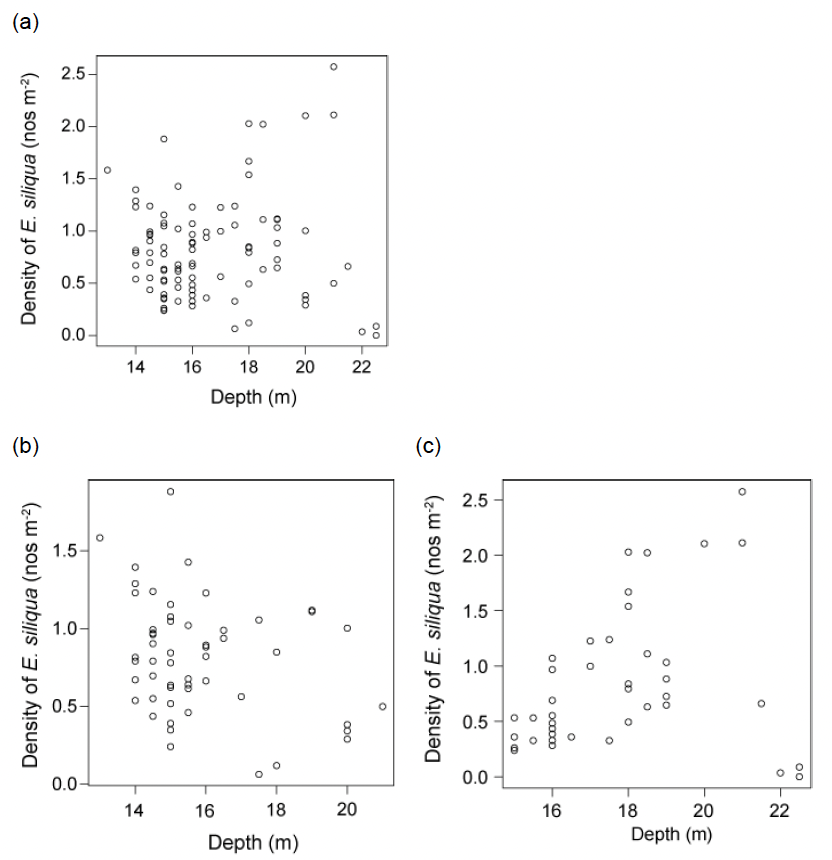
For the large E. siliqua there was no obvious relationship between density and water depth at the time of sampling when considering the whole survey (Figure 20a). However, when considering the northern fished sector on its own, there was a tendency for higher densities of large razor clams to be found at shallower depths (Figure 20b). For the southern unfished sector, the reverse trend was apparent (Figure 20c). However, it must be noted that these patterns are based on relatively low numbers of tows conducted at depths exceeding 18 m.
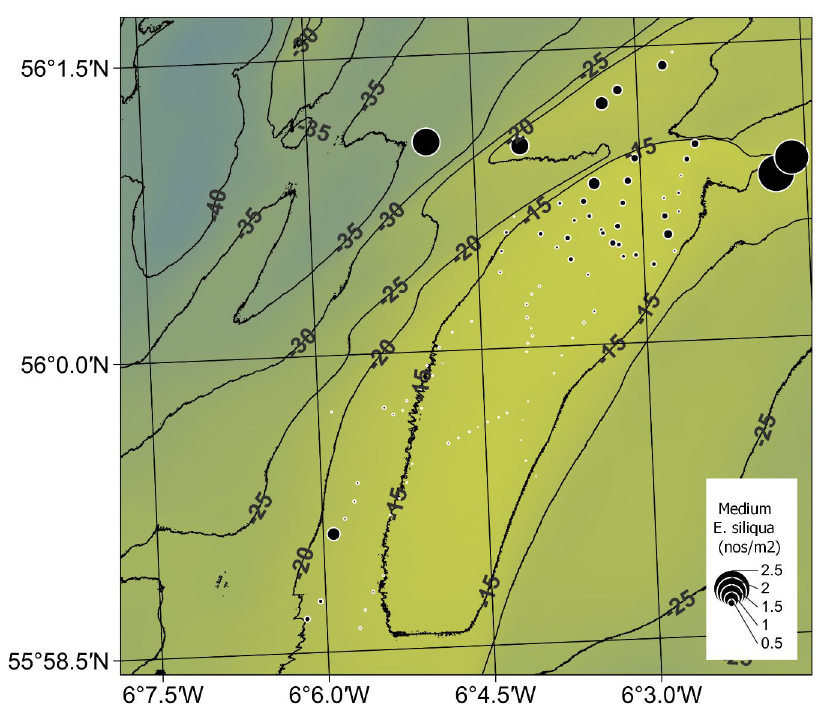
Higher densities of medium sized E. siliqua (≥ 100 mm and < 150 mm shell length) were found almost exclusively in the northern, presently fished sector where the densities were up to 4.65 m‑2 (Table 1, Figure 21). In comparison, the maximum density of medium sized razors in the southern sector was 1.60 m-2.
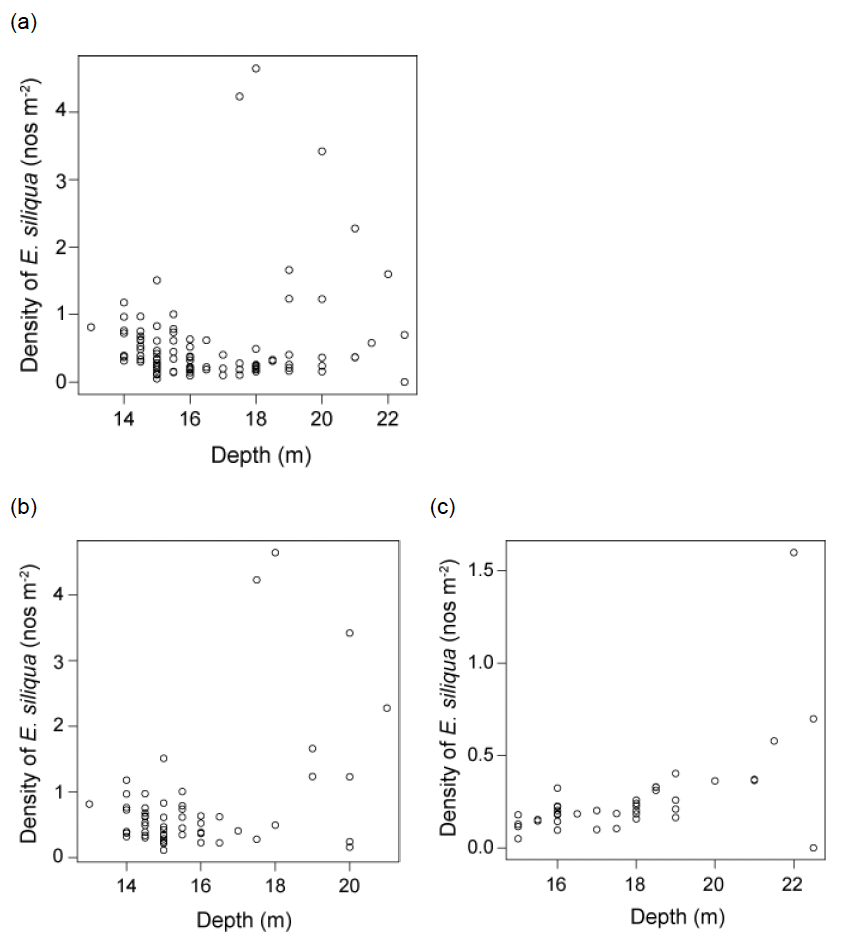
Considering the whole survey or the presently fished (northern) sector, there was a tendency for higher densities of medium sized E. siliqua to be found on deeper tows, however low densities also occurred at depths exceeding 18 m (Figure 22 a and b). For the southern unfished sector, the densities of medium-sized razors were low, although slightly elevated on deeper tows (Figure 22c). It must be noted that these patterns are based on relatively low numbers of tows conducted at depths exceeding 18 m.
The spatial distribution of E. siliqua under the current Minimum Conservation Reference Size of 100 mm shell length appeared similar to that of the medium sized razor clams (comparing Figure 23 with Figure 21), but with a slightly lower maximum density of 2.39 m‑2 (Table 1). Small size razors in the southern unfished sector were largely confined to a patch off south-western edge of the bank with a maximum density of 0.67m-2. The spatial distributions of both the smaller and medium-sized razor clams (comparing Figure 23 with Figure 21) could be linked with water circulation patterns around the bank which could be an important factor in the recruitment dynamics.
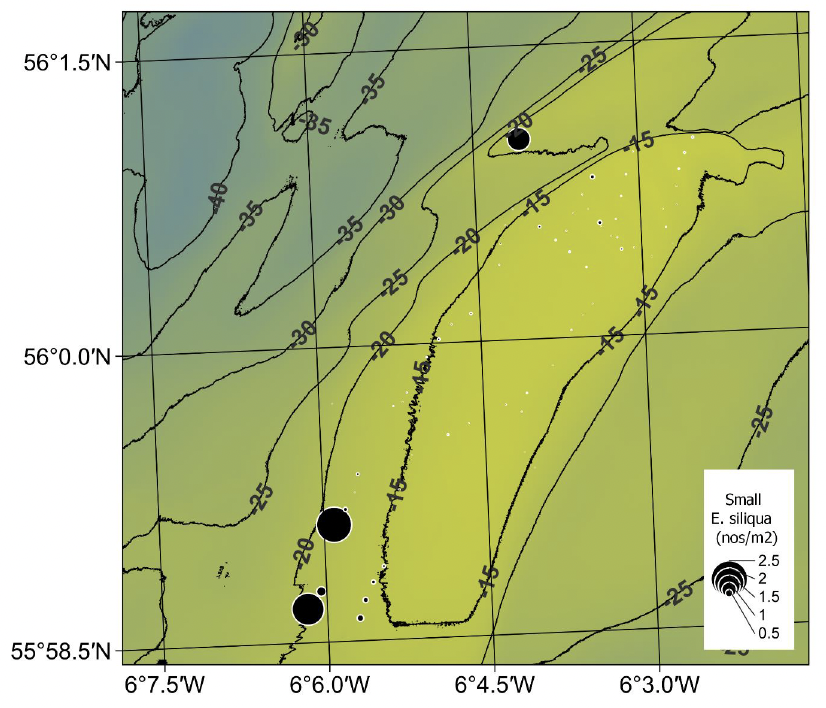
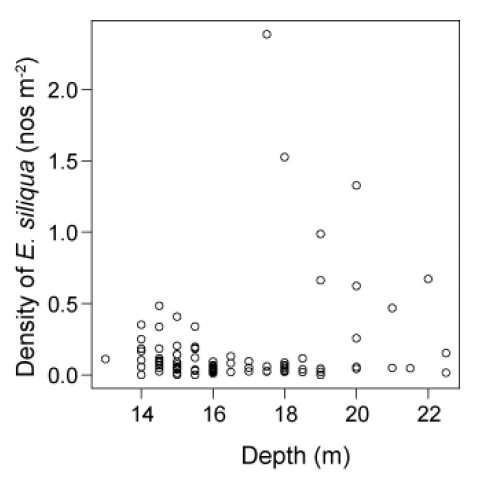
The depth distribution of the small E. siliqua is of interest because of suggestions in the literature that razor clams recruit from stocks of juveniles found either in very shallow or deeper water around the periphery of the main beds (Fahy & Gaffney 2001). If correct, deeper areas would be less accessible to the fishery due to the limitation on dive times when using compressed air SCUBA equipment and may provide a de facto protected source for new recruits. For Tarbert Bank there was some evidence that the highest densities of smaller E. siliqua tended to be associated with deeper tows (Figure 24). However, this conclusion is based on a relatively small number of tows conducted deeper than 18 m. It should also be noted that some of the deeper tows had low densities of small Ensis.
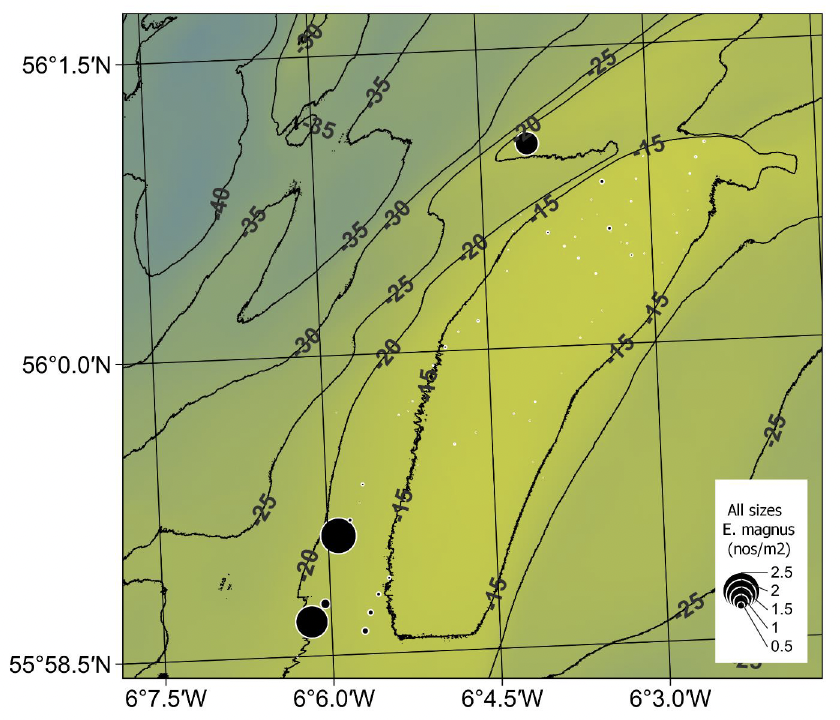
Apart from a single tow off the north-western edge of the bank, E. magnus only occurred in higher densities in the deeper water off the south-western tip of the bank (Figure 25). The maximum density was 1.16 m-2 (mean ± std dev 0.065 ± 0.18 m-2) and was coincident with coarser sediment. The tendency for this species to be found in slightly coarser sediments compared to those favoured by E. siliqua is well known (Fahy et al. 2001).
Incidental observations
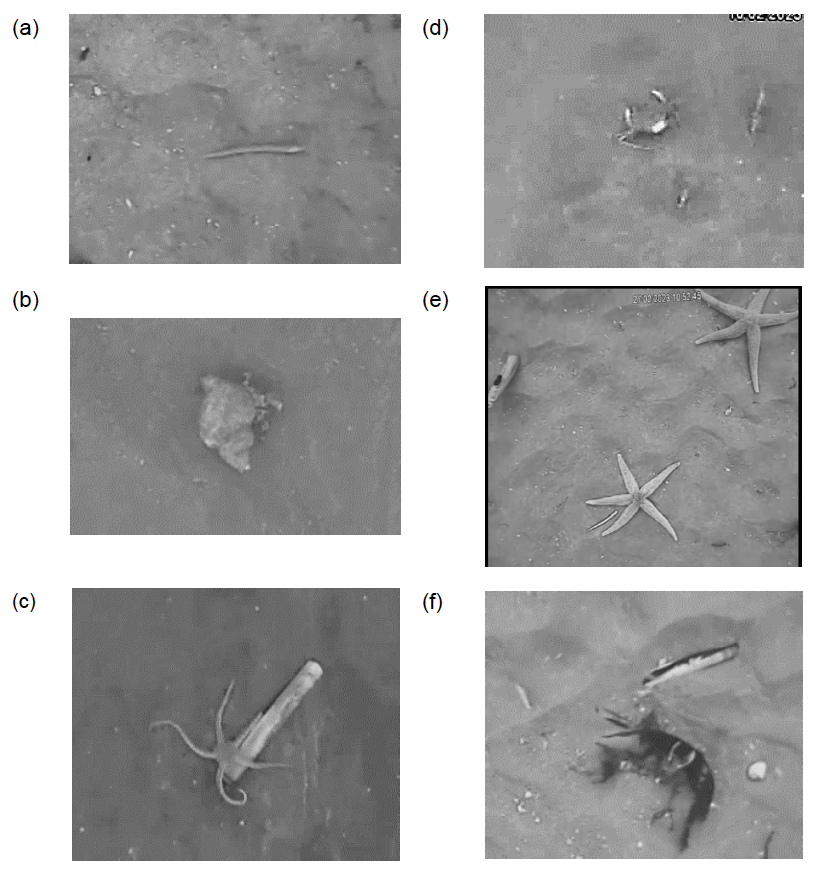
The total numbers of incidental organisms recorded on the videos are summarised in Table 2 and examples of the commoner organisms shown in Figure 26. Sandeels (Ammodytidae) were the most common incidental organism observed on the videos. Most were observed to be stunned by the electric field although some were actively swimming. The next most common incidental organism overall was the common starfish (Asterias rubens). Brittlestars were also abundant and were probably Ophiura ophiura although the features visible on the videos were not detailed enough to confirm this identification. Crabs (probably Carcinus maenas) and hermit crabs (unidentifiable to species) were also present. Relatively low numbers of juvenile flatfish were observed (these being most likely dab Limanda limanda or plaice Pleuronectes platessa) but the timing of the surveys was rather early in the year for large numbers of 0-group juvenile flatfish to be present (Gibson et al. 1993).
| Taxa | 16/02 | 25/02 | 26/02 | 27/02 | 28/02 | 01/03 | 02/03 | 03/03 | Total |
|---|---|---|---|---|---|---|---|---|---|
| Sandeel | 521 | 601 | 1456 | 742 | 609 | 731 | 2,038 | 74 | 6,772 |
| Starfish | 6 | 46 | 14 | 44 | 43 | 28 | 32 | 91 | 304 |
| Brittlestar | 12 | 10 | 9 | 39 | 41 | 83 | 194 | ||
| Crab | 3 | 12 | 10 | 22 | 3 | 50 | 13 | 46 | 159 |
| Hermit crab | 5 | 2 | 6 | 17 | 18 | 10 | 19 | 5 | 82 |
| Flatfish | 3 | 1 | 6 | 5 | 4 | 3 | 1 | 23 | |
| Heart urchin | 2 | 1 | 3 | ||||||
| Gurnard? | 1 | 2 | 3 | ||||||
| Scallop | 1 | 1 | 2 | ||||||
| Surf clam | 1 | 1 | 2 | ||||||
| Sand dollar | 1 | 1 |
Efficiency of electrofishing
Although the efficiency of the electrofishing technique has been assumed to be high (Fox et al. 2019) this was based on limited tank-based data (Murray et al. 2014) and has never been scientifically investigated under field conditions. Furthermore, anecdotal evidence from fishers suggests the emergence speed of razor clams is affected by water temperature, being slower in winter and early spring when the water temperature is colder. It has also been suggested that the depths to which the clams burrow may be affected by other factors such as air pressure and that this can also affect their emergence speeds. Clearly, slow responses could impact survey accuracy using the towed video sled if clams continue to emerge after the towed cameras have passed over an area of seabed.
On the last working day on Tarbert Bank (4th March 2023) a series of depletion experiments were conducted. This was facilitated by neap tides on that date which allowed the electrical gear to be placed stationary on the same ground for around ten minutes. Experiments were conducted in 13.4 to 13.8 m water depth. The electrical stimulation was turned on for 30 s after which a diver collected all the emerged clams within the spread of the electrodes (6 m2) and placed them in a sample bag. This process was repeated twice more. The sample bags were then lifted on board and the razor clams counted and measured. All the razor clams were returned to the sea after being measured. The vessel and electrofishing and video gear were then warped forwards to a fresh area of ground. In total the experiment was repeated 18 times.
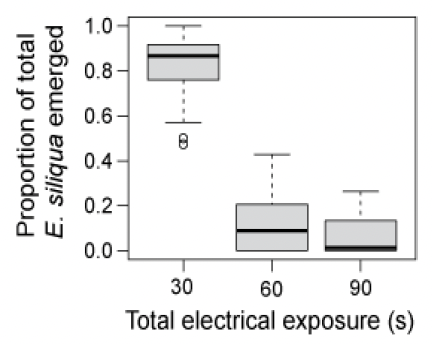
Ten of the 18 replicates reached zero further emergences after the second or third 30 s stimulation (Table 3). For three of the replicates the proportion which emerged following the first stimulation was as low as 0.5 but for the remaining 15 replicates was above 0.75. On average, the proportion of the total clams which had emerged after the first 30 s electrical stimulation was 0.82, following the second stimulation was 0.12 and following the third stimulation was 0.06 (Table 3). The results are slightly skewed so that median emergence proportions were 0.87, 0.09 and 0.00 after 30-, 60- and 90-seconds electrical stimulation (Figure 27).
| Replicate | Lat (deg N) | Lon (deg W) | Counts of emerged E. siliqua after total exposure to electrical field | Proportion of total emerged after each exposure | ||||||
|---|---|---|---|---|---|---|---|---|---|---|
| 30s | 60s | 90s | Total | 30s | 60s | 90s | ||||
| 1 | 56.00465 | 6.06033 | 9 | 5 | 5 | 19 | 0.47 | 0.26 | 0.26 | |
| 17 | 56.00604 | 6.06033 | 8 | 5 | 3 | 16 | 0.50 | 0.31 | 0.19 | |
| 5 | 56.00517 | 6.06019 | 8 | 6 | 0 | 14 | 0.57 | 0.43 | 0.00 | |
| 15 | 56.00592 | 6.06031 | 14 | 2 | 5 | 21 | 0.67 | 0.10 | 0.24 | |
| 8 | 56.00548 | 6.06035 | 19 | 6 | 0 | 25 | 0.76 | 0.24 | 0.00 | |
| 9 | 56.00557 | 6.06038 | 23 | 6 | 0 | 29 | 0.79 | 0.21 | 0.00 | |
| 10 | 56.00567 | 6.06041 | 33 | 6 | 1 | 40 | 0.83 | 0.15 | 0.03 | |
| 6 | 56.00528 | 6.06026 | 11 | 0 | 2 | 13 | 0.85 | 0.00 | 0.15 | |
| 13 | 56.00580 | 6.06038 | 13 | 1 | 1 | 15 | 0.87 | 0.07 | 0.07 | |
| 4 | 56.00505 | 6.06019 | 13 | 0 | 2 | 15 | 0.87 | 0.00 | 0.13 | |
| 16 | 56.00599 | 6.06034 | 13 | 2 | 0 | 15 | 0.87 | 0.13 | 0.00 | |
| 11 | 56.00569 | 6.06038 | 28 | 3 | 1 | 32 | 0.88 | 0.09 | 0.03 | |
| 18 | 56.00612 | 6.06034 | 11 | 1 | 0 | 12 | 0.92 | 0.08 | 0.00 | |
| 12 | 56.00573 | 6.06033 | 26 | 2 | 0 | 28 | 0.93 | 0.07 | 0.00 | |
| 2 | 56.00481 | 6.06017 | 16 | 0 | 0 | 16 | 1.00 | 0.00 | 0.00 | |
| 3 | 56.00491 | 6.06021 | 9 | 0 | 0 | 9 | 1.00 | 0.00 | 0.00 | |
| 7 | 56.00539 | 6.06032 | 5 | 0 | 0 | 5 | 1.00 | 0.00 | 0.00 | |
| 14 | 56.00584 | 6.06035 | 9 | 0 | 0 | 9 | 1.00 | 0.00 | 0.00 | |
| mean | 0.82 | 0.12 | 0.06 | |||||||
| SE | 0.04 | 0.03 | 0.02 | |||||||
| median | 0.87 | 0.09 | 0.00 | |||||||
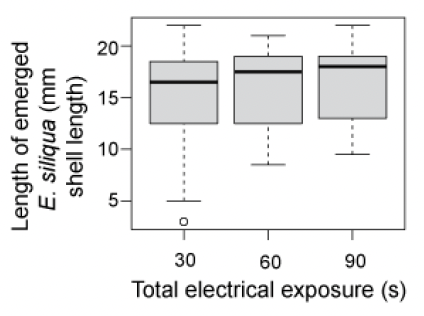
With increasing electrical stimulation, the median length of emerging razors increased from 165 to 180 mm (Figure 28) but the differences were not statistically significant (Kruskall-Wallis chi-squared = 1.82, df = 2, p = 0.40). It should also be noted that because the numbers of E. siliqua emerging declined strongly with each exposure the sample sizes are not equal (268 after Exposure 1, 43 after Exposure 2 and 22 after Exposure 3).
Based on the estimated exposure times during the Tarbert Bank survey tows (Figure 11d), average catchability should be at least 82%, and given that many of the tows had longer exposure times, overall survey efficiency is likely to exceed this value.
In future surveys the gear could be towed at a slightly slower speed since increasing the exposure time to 60 seconds should ensure a catchability close to 100%, even under colder water conditions. This would increase the time required to complete tows of sufficient length so the trade-off between further improving catchability versus increased survey cost, or a reduction in the number of tows would require careful consideration.
Discussion
There are only a limited number of historical estimates of razor clam densities around Scotland with which to compare the present findings. McKay (1992) used a suction dredge to survey a variety of shellfish but with very limited exploration of the waters around Jura and Colonsay. Local density estimates for Ensis (both species combined) made by divers in Loch Nevis, Scotland were reported to be up to 17 clams m-2. More recently several razor clam surveys using the combined electrofishing towed-video approach have been conducted by Fox et al. (2017, 2018, 2021). From these, the maximum densities of E. siliqua recorded to the north of Barra were around 3 m-2 whilst along the Ayrshire coast only a few tows reached as high as 1 m-2. In contrast, the maximum density found in Largo Bay (Firth of Forth) was 11 m-2 and the average density across all the tows was 4 m-2. The densities of E. siliqua on Tarbert Bank were up to 6.68 m‑2 with an average density of 1.57 ± 0.11 m-2 (mean ± SE). The northern part of the bank has been fished throughout the Scottish Government trial whereas the southern sector has not been fished for around 5 years. This recent history seems to be reflected in the razor clam density and length distributions where the maximum and average densities, the relative proportion of larger razors in the population and the modal size of the large-size group (> 150 mm shell length) were higher in the southern sector. However, both the maximum and average density of the medium size-group (≥ 100 and < 150 mm shell length) and small size-group (<100 mm shell length) were lower in the unfished area.
Particularly noticeable was the spatial distribution of the small razors which were found at higher densities around the periphery of the northern fished part of the bank. It is tempting to speculate that reduction in the densities of the largest razors in this area may have promoted recruitment of younger razors by reducing competition for food or space. However, this pattern could also be a result of the water circulation patterns around Tarbert Bank. Very little is known regarding recruitment dynamics of Ensis spp. although it has been hypothesized that young razors may settle around the edges of established beds and migrate into the main beds as they grow (Fahy & Gaffney 2001). It would be worth investigating further out from Tarbert Bank, particularly to the west in the unfished sector to see if small razors are also present in that area, but this will require longer electrical cables than were available for the current survey.
Tow speeds in the present surveys ranged from 1.6 – 5.4 m min-1 which are similar to those when other vessels have been employed to conduct razor clam surveys (Fox 2018, Fox 2021). It has been suggested that the proportion of razors which are partially emerged might provide an index for how efficiently the electrofishing gear is working (Fox 2018). For studies along the Ayrshire coast, this proportion averaged 0.25 but was as high as 0.60 on some stations in Culzean Bay. However, in Largo Bay (Firth of Forth) the proportion of partially emerged Ensis was 0.15 or less (Fox 2021). On Tarbert Bank the median proportion of partial emergence was 0.098 with only a few tows exceeding 0.20 suggesting that the gear was fishing efficiently. Furthermore, there did not appear to be any clear relationship between the proportion of razor clams which were partially emerged and water depth at the time of sampling, or with the estimated length of exposure to the electrical field. The catch efficiency of the electrofishing method was studied further in a series of depletion experiments on Tarbert Bank.
One area of uncertainty in past surveys has been the efficiency of the electrofishing gear. The depletion experiment conducted on Tarbert Bank is the first time this has been scientifically investigated under field conditions. The results suggest that on average the electrofishing gear was 82% efficient based on a single 30 s exposure to the electrical field. The other survey technique where efficiency has been measured is hydraulic dredging which was estimated to have 100% catchability across a width of 0.45 m dropping to 42% across a width of 1.01 m, which represented the extent of disturbed ground (Hauton et al., 2007). These efficiencies contrast to non-hydraulic dredges used for scallops and oysters where efficiency is in the region of 10 –35% (Marine Institute and Bord Iascaigh Mhara, 2021). Hydraulic dredging was used in the surveys conducted by MacKay (1992) and is used for scientific stock assessments in Ireland (Fahy and Carroll, 2007, Marine Institute and Bord Iascaigh Mhara, 2021). Hydraulic dredging creates more physical disturbance compared to electrofishing although Tuck et al. (2000) concluded that the infaunal communities present in sandy sediments were well adapted to physical disturbance and would recover after a few weeks. However, mortality rates of organisms discarded during hydraulic dredging may be significant given recorded levels of damage to the shells of bivalves, including Ensis spp. (Marine Institute and Bord Iascaigh Mhara, 2021). In contrast, non-target organisms are not collected during electrofishing and available scientific evidence suggests high rates of recovery shortly after the electrodes have passed (Murray et al., 2014). In conclusion, electrofishing combined with towed video appears to be an effective survey tool for Ensis whilst also causing minimal collateral damage. Anecdotal evidence also suggests that the rates of razor clam emergence when electrofishing may be even faster under warmer conditions, so it is recommended that the depletion experiments be rerun during summer months to test this hypothesis.
Murray et al. (2014) mentioned that stunned razor clams might be predated on the seabed before they have a chance to rebury. When commercial divers leave undersized clams on the seabed predation could impact the sustainability of the stock if sufficiently high. However, the numbers of benthic predators seen on the videos from Tarbert Bank appeared rather low. On several occasions, brittlestars were seen apparently feeding on stunned razors but it could not be ascertained whether this leads to irrecoverable damage to the clams. In contrast, eider ducks, which may be important predators on razor clams in Largo Bay (Fox 2021), were not present during the survey. Large numbers of small sandeels were seen on the videos. However, Murray et al. (2014) suggested that sandeels recover in a few minutes following exposure to the electrical field, although this conclusion was based on relatively limited testing.
The data collected in this survey provides a baseline with which to compare Ensis densities and sizes from future surveys on Tarbert Bank. Comparison between the presently fished and unfished portions of the bank suggests that the fishery has resulted in a detectable reduction in the proportion of larger razors north of latitude 56°N. However, there may also be differences in growth conditions between the two areas because both the maximum and average densities of E. siliqua seemed to be lower in the unfished area. The finding that higher densities of small and medium size E. siliqua were mainly confined to the northern part of the bank suggests that either local hydrography plays an important role in recruitment dynamics, or that settlement of small razors has been encouraged by a reduction in the densities of larger, older razor clams in the fished area.
Acknowledgements
The present work would not have been possible without the enthusiastic support of the vessel’s owner, skipper and crew. In particular, the skipper’s local knowledge of the area was invaluable in conducting the survey. The author would also like to acknowledge Mr Lars Brunner (SAMS) for assistance with analysis of the video footage and Mr Christian Armstrong (SAMS) for his advice regarding the bathymetry and seabed processes occurring on Tarbert Bank. The survey was conducted under a scientific derogation issued by Marine Directorate and with advice from NatureScot. The work would also not have been possible without the continuing support of Lynda Blackadder and Cara Duncan. Funding was provided by Marine Fund Scotland grant SCOMFF1539.