Atlantic salmon 2021: Scottish Marine and Freshwater Science Vol 14 No 4
A summary report of the spatial extent and severity of pressures acting on Atlantic salmon in Scotland, with a view to informing management and policy at local and national scales.
2. Methods
To ensure that information was collected to common standards in a comparable format throughout Scotland, salmon pressures were classified into 27 individual categories within 12 broadly themed groups (See Appendix 1 for details). Information was captured in an online Geographical Information System (GIS) at two spatial scales which varied by pressure depending on the spatial extent of expected impacts on salmon. Reach scale pressures, which were appropriate to geographically discrete impacts (e.g. point source pollution), were mapped at the river segment scale. Pressures expected to affect salmon across whole river systems (e.g. predation of smolts or adults in mainstem rivers or estuaries) were mapped at catchment scales. The latter pressures were mapped only for catchments that come under The Conservation of Salmon (Scotland) Regulations 2016 ("the Conservation Regulations"), which excludes catchments not supporting salmon fisheries. The data collection process was accompanied by detailed guidance material prepared by Fisheries Management Scotland in consultation with Marine Scotland.
2.1 Severity, status and confidence
For each pressure and river reach (or catchment as appropriate), local fisheries managers, represented by Fisheries Trusts and Board biologists communicating with the Scottish Fisheries Coordination Centre, were asked to provide their assessment of the severities of each pressure (approximate level of impact on salmon), its status and the level of confidence. The juvenile survey data provided evidence of the degree to which each fish population was impacted overall by the combination of pressures. These assessments were recorded in broad categories and defined as follows:
Severity (Low to High):
- Severity A: < 5% of natural salmon production lost due to a pressure
- Severity B1: Between 5% and 26% of production lost
- Severity B2: Between 27 and 49% of production lost
- Severity C: Between 50 and 80% of production lost
- Severity D: >80 % of salmon production lost
- UNKNOWN: Pressure thought to be present, but severity of impact could not be estimated even in broad terms
Status:
- Chronic: A contemporary pressure that is present for more than 50% of the year and not trending
- Episodic: A contemporary pressure that is present for less than 50% of the year and not trending
- Historic: A pressure that is declining over time, or has been removed but has persisting effects
- Emerging: A pressure that is increasing over time
- NA: Recorded only where a pressure is not thought to be having any impact
To reduce the number and complexity of status classes it was only possible to define pressures as chronic or episodic for contemporary pressures.
Confidence:
- High : estimate of severity is supported by robust evidence
- Low: estimate of severity not supported by robust local evidence
Decision making was supported by data on the status of juvenile salmon from NEPS, together with locally collected information and spatial data on environmental status mapped and collated by the Scottish Environment Protection Agency (SEPA) to support waterbody classifications under the Water Framework Directive.[2] A high level review of the data and approach were undertaken by a Technical Working Group including representatives from SEPA, NatureScot, academics and practitioners working on salmon in Scotland (Appendix 2).
2.2 Summarising the impacts of pressures on salmon at regional and national scales
The impacts of pressures were assessed and summarised at catchment, fisheries district, regional and national scales for rivers that are included in the Salmon Conservation Regulations process.[3] Rivers above natural impassable barriers for salmon were excluded from the analysis. The overall impact of a pressure reflects both its severity and its spatial extent, which can be indicated by river length or wetted area. Summary metrics of overall impact were therefore calculated by multiplying the river length or wetted area by a value representative of the mid-point of the severity class definitions (Section 2.1 above), summing the resulting values to the scale of interest and referencing them to the total wetted area or river length. The output is two summary metrics depending on the measure of spatial extent; Production Impact River length and Production Impact Wetted Area. These summary metrics can be thought of as the percentage of salmon production that is believed to be lost due to each pressure. However, given the uncertainties involved in the process they are better considered as broad metrics, indicative of the scale of assessed impacts, where higher values indicate a greater expected impact.
To facilitate presentation of information on status and confidence, these variables were assigned numerical values (Low Confidence 0, High Confidence 1, Historical 1, Chronic/Episodic 2, Emerging 3) and aggregated across regions with a weighting for habitat area (length or wetted area).
Pressures with an "unknown" severity could not be included in the main analysis and were dealt with separately. In these circumstances the spatial extent of the pressure was calculated and referenced to the total available habitat in a region, with high values again indicating a pressure with greater potential impacts.
2.3 Data presentation
The pressure data are available in several different formats reflecting varying levels of spatial resolution. Detailed data on individual pressures and river reaches can be viewed on the Fisheries Management Scotland web site.[4] In addition Marine Scotland have developed an R Shiny Application to present summary data for river catchments, District Salmon Fishery Board (DSFB) boundaries, broad geographic regions and the whole country.[5] This application can map spatial variability in the impacts of individual pressures, and produce tables that rank the importance of each pressure assessed within a defined geographic area. These resources provide additional detail and granularity that is not provided here.
This report aims to provide a readily interpretible high level summary of the detailed spatial data populated by local fisheries managers. Conceptually, the format of the data summaries presented here are broadly consistent with those presented by Forseth et al. (2017) with Status plotted on the x axis (Development in Forseth et al., 2017) and Severity plotted on the y axis (Effects in Forseth et al., 2017). This has the effect of plotting pressures of declining importance to the left, increasing importance to the right, high impact to the top and low impact to the bottom of each plot. Additionally, the size of symbols has been scaled in this report according to levels of confidence to identify those pressures for which local fishery managers consider there to be greater or lesser levels of evidence.
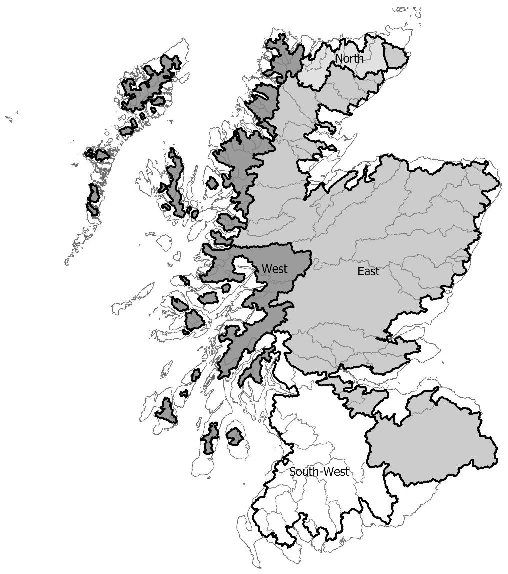
Data have been aggregated at two spatial scales; National, and regional (East, North, West and South West indicated in Figure 1). Note that there is substantial variation among regions in the areas of rivers and salmon stocks. There is also variation in the geographic distribution of potential pressure sources. For example, Scottish planning policy presumes against marine finfish farm developments on the North and East coasts to safeguard migratory fish species.