Recorded Crime in Scotland, 2021-2022
Statistics on crimes and offences recorded and cleared up by the police in Scotland in 2021-22, split by crime or offence group and by local authority.
Part of
Total Recorded Crime
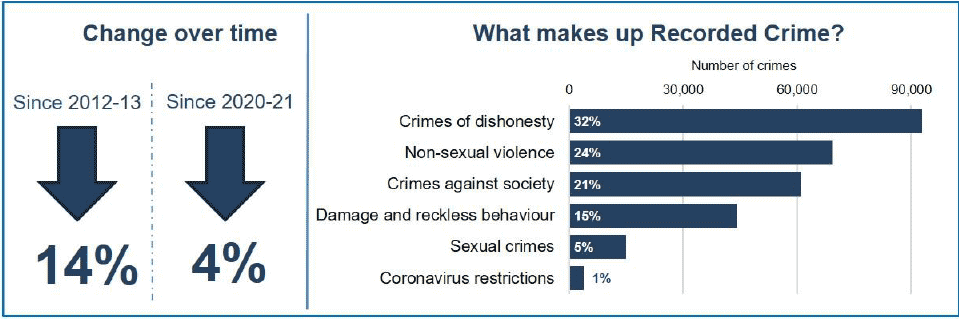
The recording of crime is at the lowest level seen since 1974. The total number of crimes recorded by the police in Scotland in 2021-22 was 286,464. This is 12,988 crimes (or 4%) lower than the level recorded in 2020-21.
Over the past ten years, total recorded crime in Scotland has decreased by 14%. This continues a generally decreasing trend in recorded crime over the longer term, from a peak in 1991 when crime reached a record high of 613,943.
Chart 1 shows the total number of recorded crimes since 1971.
Legislative changes and changes to crime recording practices will have had some effect on the longer term time series for recorded crime. Annex 3 provides information on these changes.
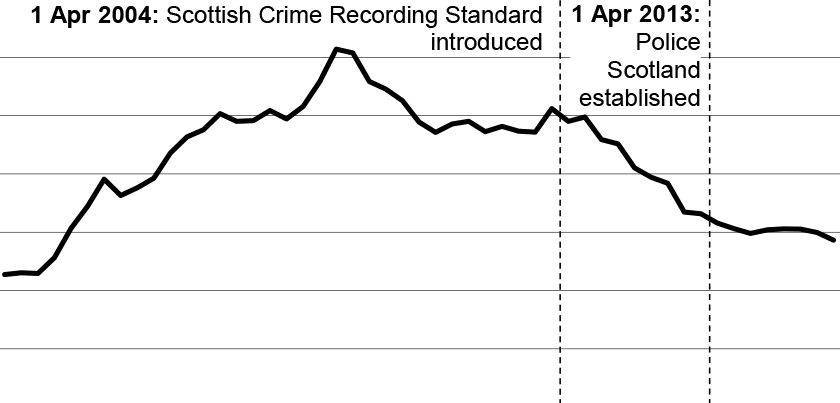
Note: Data are incomplete for 1975 due to local government reorganisation.
Chart 2 shows the number of recorded crimes for each crime group since 1971, and gives an indication of the scale of crimes recorded in each group.
In 2021-22, of all recorded crimes:
- Crimes of dishonesty was the largest group, accounting for 32%
- Non-sexual crimes of violence accounted for 24%
- Crimes against society accounted for 21%
- Damage and reckless behaviour accounted for 15%
- Sexual crimes accounted for 5%
- Crimes relating to Coronavirus restrictions accounted for 1%
These crime groups are discussed in more detail in the following chapters.
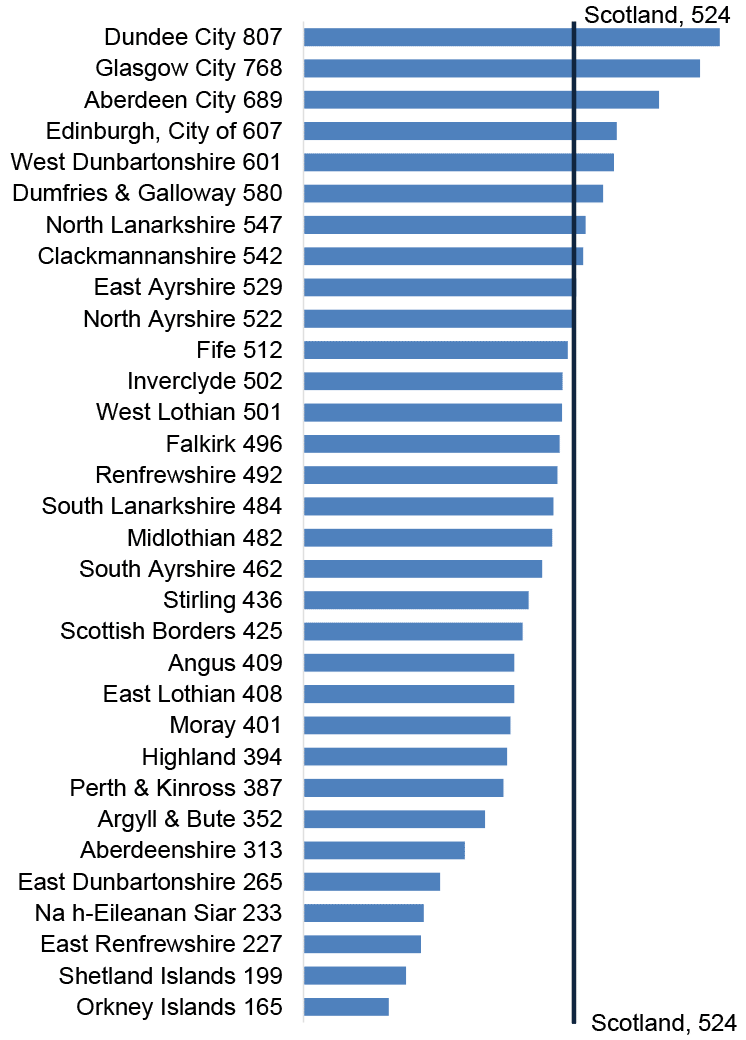
The national rate of total recorded crime was 524 crimes per 10,000 population in 2021-22. This has decreased from 548 in 2020-21.
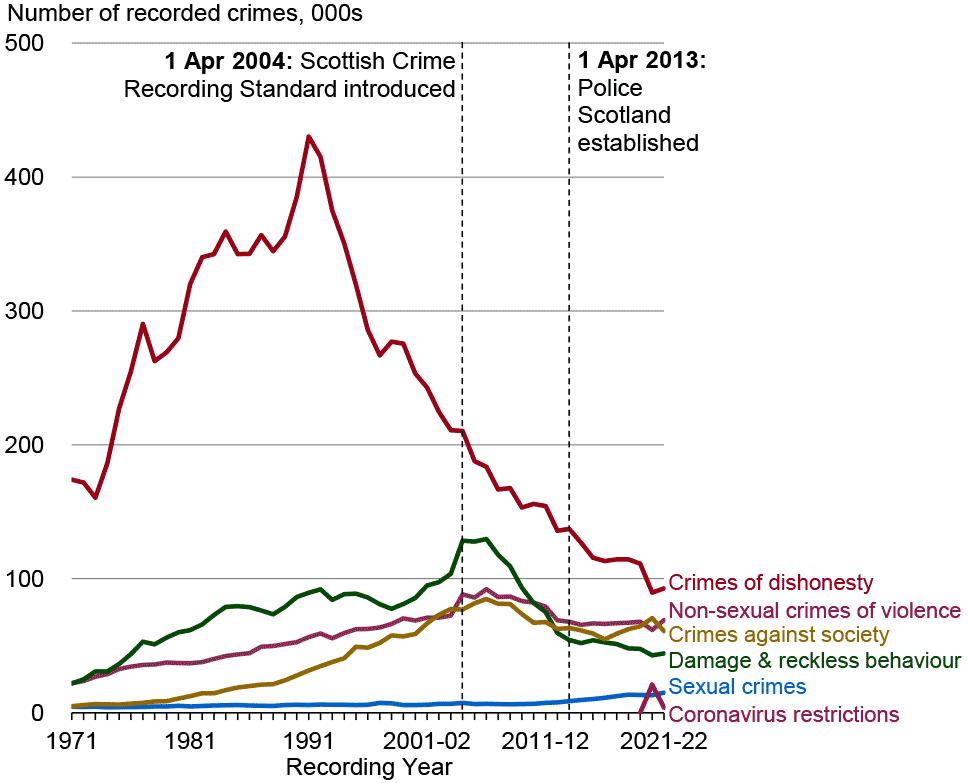
Note: Data are incomplete for 1975 due to local government reorganisation.
Total Recorded Crime by Local Authority
Notwithstanding that year-on-year figures can fluctuate across local authorities, the long term trend of decreasing crime is broadly the same across Scotland.
Since 2012-13, most local authorities have seen a reduction in total recorded crime. Only four (Dumfries and Galloway, Dundee City, East Lothian and Scottish Borders) have seen an increase.
Since 2020-21, twenty-four local authorities have seen a decrease in total recorded crime. Eight have seen an increase.
Table 1 in the 'Supporting documents' Excel workbook provides the number of crimes recorded in each local authority over the past ten years.
In Scotland as a whole, there were 524 recorded crimes per 10,000 population in 2021-22. Dundee City (807 per 10,000 population), Glasgow City (768 per 10,000 population) and Aberdeen City (689 per 10,000 population) recorded the highest rates.
Table 4 in the 'Supporting documents' Excel workbook provides further details on the number of crimes recorded per 10,000 population in each local authority over the past ten years.
1. Due to 2021 mid-year population estimates from the National Records of Scotland being published after the release of the Recorded Crime in Scotland 2021-22 bulletin, the 2020 mid-year population estimates have been used to calculate the 2021 population rates.
Contact
Email: Justice_Analysts@gov.scot