Recorded Crime in Scotland, 2015-16
Statistics on crimes and offences recorded and cleared up by the police in Scotland.
Part of
Group 7 - Motor Vehicle Offences
Number of Motor vehicle offences recorded in 2015-16:
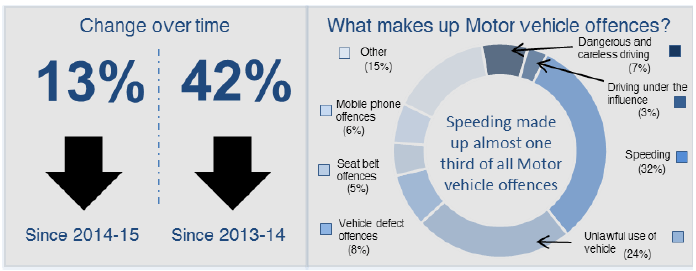
Motor vehicle offences account for half (50%) of all offences recorded in Scotland in 2015-16. Between 2014-15 and 2015-16, the number of Motor vehicle offences recorded by the police decreased by 13% from 195,985 to 170,297. This amounts to an overall decrease of 42% since 2013-14.
Due to a number of anomalies in the data as a result of inconsistencies with legacy data reporting, there is a break in the time series at 2013-14. Further information on the comparability issues can be found in the 'Data Considerations' section below, and detailed information on the comparability of Group 7 are available in Annex 2.
The national rate of recorded Motor vehicle offences decreased from 366 per 10,000 population in 2014-15 to 317 per 10,000 population in 2015-16. This varied by local authority area, with the highest rate in Dumfries & Galloway (739 per 10,000 population), and the lowest in East Lothian (96 per 10,000 population) ( Table 13).
Additional information provided by Police Scotland relating to Motor vehicle offences is available in the 'Data Considerations' section below.
Speeding:
Speeding is the largest category in this group, accounting for almost one third (32%) of Motor vehicle offences. This category decreased by 11% from 60,926 in 2014-15 to 54,419 in 2015-16. This amounts to an overall decrease of 34% since 2013-14. Around half (15) of local authority areas recorded a decrease between 2014-15 and 2015-16.
It should be noted that the Speeding category is not considered comparable for years prior to 2013-14. Further information on quality issues is available in Annex 2.
Unlawful use of vehicle:
The Unlawful use of vehicle category includes offences such as Driving while disqualified, Driving without a licence, Driving without insurance, and Driving without a test certificate. Further detail can be found in Chapter 8.
Unlawful use of vehicle accounted for 24% of Motor vehicle offences. This category increased by 2% from 40,855 in 2014-15 to 41,470 in 2015-16. Despite this rise, these offences remain 28% lower than in 2013-14. Over half (17) of local authority areas recorded an increase between 2014-15 and 2015-16.
It should be noted that the Unlawful use of vehicle category is not considered comparable for years prior to 2013-14. Further information on quality issues is available in Annex 2.
Vehicle defect offences:
Vehicle defect offences account for 8% of Motor vehicle offences. This category decreased by 16% from 15,593 in 2014-15 to 13,070 in 2015-16. This amounts to an overall decrease of 38% since 2013-14. Over half (18) of local authority areas recorded a decrease between 2014-15 and 2015-16.
It should be noted that the Vehicle defect offences category is not considered comparable for years prior to 2013-14. Further information on quality issues is available in Annex 2.
Dangerous and careless driving:
Dangerous and careless driving accounted for 7% of Motor vehicle offences. This category increased by 12% from 10,773 in 2014-15 to 12,057 in 2015-16. Numbers declined for a few years after 2006-07, but generally increased since 2010-11. Despite this, levels remain 11% lower than in 2006-07. Over half (17) of local authority areas recorded a decrease in this category between 2006-07 and 2015-16. Three quarters (24) of local authorities showed an increase between 2014-15 and 2015-16.
Mobile phone offences:
Mobile phone offences account for 6% of Motor vehicle offences. This category decreased by 44% from 17,978 in 2014-15 to 10,085 in 2015-16. Levels of these offences increased each year from 2008-09, peaking in 2013-14, but have seen an overall decrease of 58% since 2008-09 and 72% since 2013-14.All but three (29) local authority areas recorded a decrease in this category between 2008-09 and 2015-16. All but four (28) local authority areas showed a decrease between 2014-15 and 2015-16, with 11 local authorities decreasing by 50% or more.
It should be noted that the Mobile phone offences category is not considered comparable for years prior to 2008-09. Further information on quality issues is available in Annex 2.
Seat belt offences:
Seat belt offences account for 5% of Motor vehicle offences. This category has decreased by 48% from 15,619 in 2014-15 to 8,059 in 2015-16. Levels of these offences had previously been on a generally upward trend between 2008-09 and 2013-14, before decreasing by 79% up to 2015-16. All but one (31) local authority areas recorded a decrease in this category between 2008-09 and 2015-16. All but five (27) local authority areas showed a decrease between 2014-15 and 2015-16, with 10 local authorities decreasing by 50% or more.
It should be noted that the Seat belt offences category is not considered comparable for years prior to 2008-09. Further information on quality issues is available in Annex 2.
Driving under the influence:
Driving under the influence accounted for 3% of Motor vehicle offences. There was a 5% increase in this category from 5,218 in 2014-15 to 5,458 in 2015-16, in contrast to the downward trend seen since 2006-07. Driving under the influence has decreased by 53% as a whole over this period. All local authority areas recorded a decrease in this category between 2006-07 and 2015-16. Around two thirds (20) of local authorities showed an increase between 2014-15 and 2015-16.
Other motor vehicle offences:
The Other motor vehicle offences category includes offences such as Accident offences and Parking offences. Further detail can be found in Chapter 8.
Other motor vehicle offences account for 15% of Motor vehicle offences. This category decreased by 12% from 29,023 in 2014-15 to 25,679 in 2015-16. This amounts to an overall decrease of 39% since 2013-14. Over half (17) of local authority areas recorded a decrease between 2014-15 and 2015-16.
It should be noted that the Other motor vehicle offences category is not considered comparable for years prior to 2013-14. Further information on quality issues is available in Annex 2.
DATA CONSIDERATIONS
As outlined in the overall section on police recorded offences - an extensive data quality exercise was carried out to assess the comparability of data extracted from the Scottish Operational and Management Information System ( ScOMIS) with data collected from legacy police forces and published in previous bulletins. This analysis identified that due to the standardisation of reporting practices following the establishment of Police Scotland, there are significant comparability issues for Group 7 Motor Vehicle Offences. There are no issues for two of the categories in Group 7: Dangerous and careless driving and Driving under the influence. Seat belt offences and Mobile phone offences are only comparable back to 2008-09. The other categories in Group 7, and hence the overall figures for Group 7, are only comparable back to 2013-14.
The Scottish Government produced a Technical Report in 2014 which detailed the quality assurance work it carried out in reaching this conclusion: http://www.gov.scot/Topics/Statistics/Browse/Crime-Justice/PubRecordedCrime/TechnicalReport.
In relation to the overall decrease in Motor vehicle offences, Police Scotland have advised that they have moved towards engagement and education to prevent road crime in addition to enforcement, with raising awareness and high profile media campaigns designed to influence driver behaviour and public attitudes. Further, Police Scotland state that high-risk road traffic offender groups are identified and targeted as part of routine business, and Anti-Social Behaviour legislation is used proactively, through the issue of initial warnings to drivers/vehicles followed by seizure of the vehicle where relevant.