Climate change - public engagement: survey results 2022
Results of a representative survey of the Scottish public, focused on attitudes and engagement with climate change. The results will act as a baseline for the Public Engagement Strategy for Climate Change.
2. Understanding
2.1 Concern about climate change
The Scottish public are most likely to rank the economy (24%) and health and social care (24%) as the policy issues that are most important to them, but climate change ranks third – selected as the top issue by 15% of the population (Figure 1). The mean ranking for climate change was 5.4 – around the midpoint in terms of important policy areas.
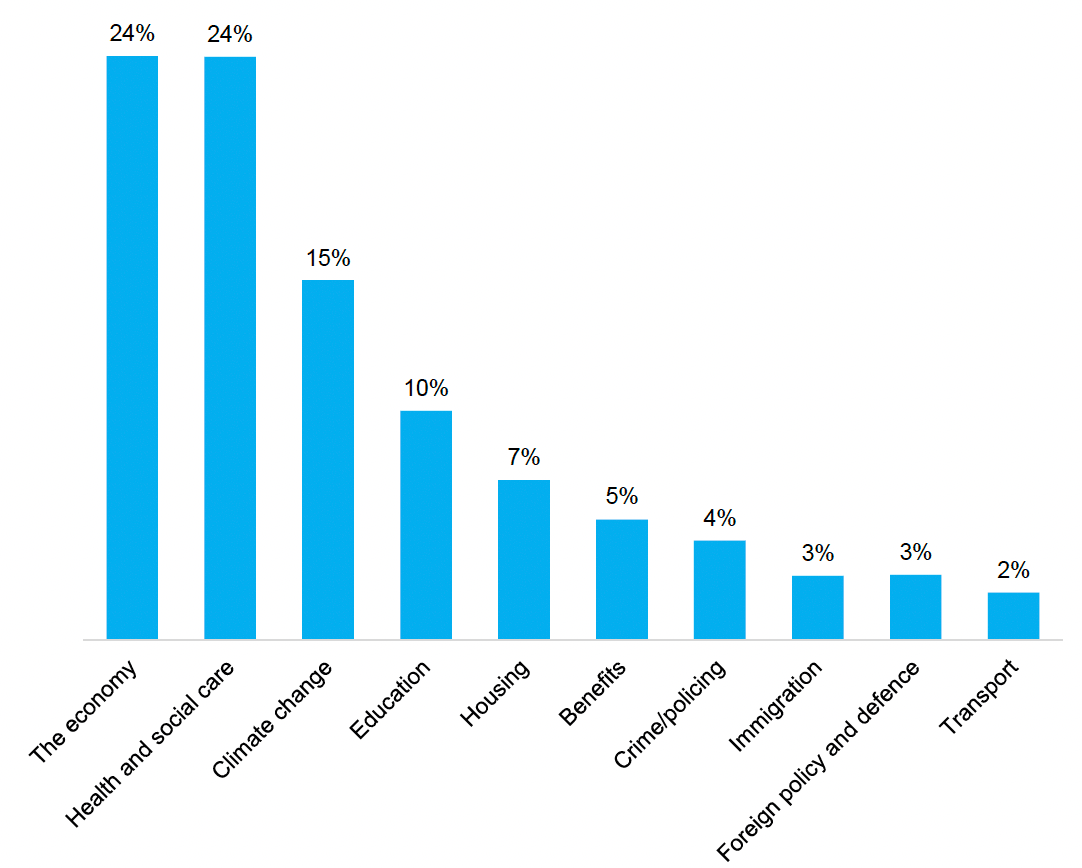
Unweighted bases (1782), ranked response question, 4% of respondents answered 'don't know'
2.2 Knowledge about climate change
Over half (58%) of the Scottish public state that they know at least "a fair amount" about climate change, however only around one in ten (12%) are confident enough to say that they know "a lot" about it. Just 4% say they don't know anything about it. (Figure 2).
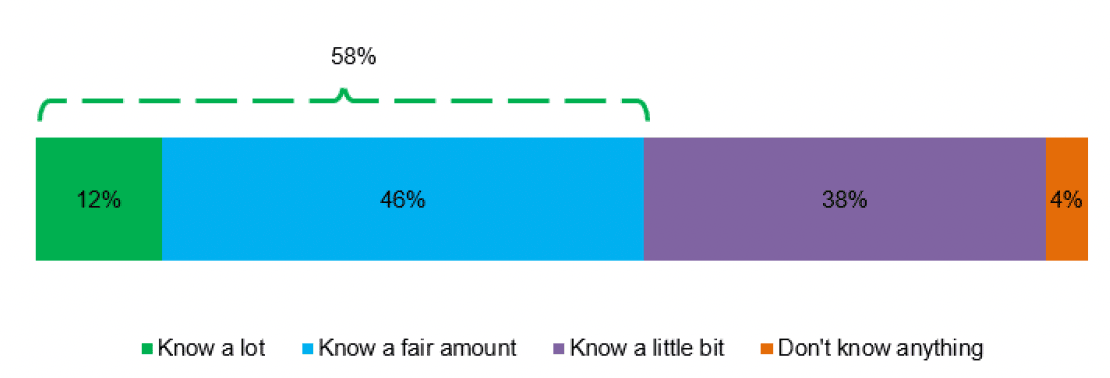
Unweighted bases (1782), single response question
Respondents aged 18-34 are significantly more likely than older respondents to say that they know a lot or a fair amount about climate. Those aged 14-17, however, are more in line with the Scottish average. (Table 1).
| Total | 14-17 | 18-24 | 25-34 | 35-44 | 45-54 | 55-64 | 65+ | |
|---|---|---|---|---|---|---|---|---|
| Know a lot / Know a fair amount | 58% | 59% | 68% | 65% | 58% | 56% | 53% | 53% |
Note: All statistically significant changes from the total are highlighted. Green highlights denote data significantly higher than total. Blue highlights denote data significantly lower than total.
2.3 Exposure to information about climate change
The Scottish public are most likely to recall seeing information about climate change on the television, with over half (56%) doing so at least once a week. A similar proportion say they read about it on news websites (52%), while just under half see something about it on social media (47%) at least once a week (Figure 3).
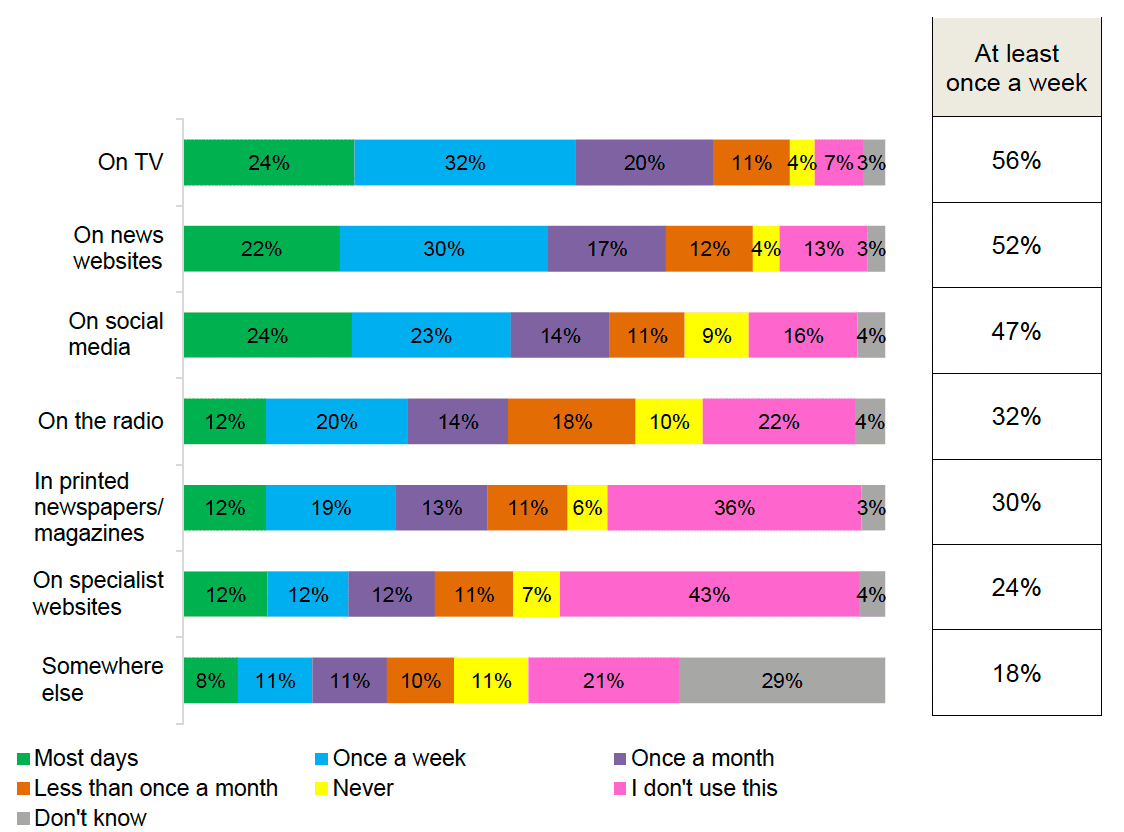
Unweighted bases (1782), single response per source
For those sources where fewer have seen or heard stories about climate change, this is not necessarily a result of coverage of the topic being scarce on these platforms, but because respondents are more likely to say they just do not use this source. For example, respondents are less likely to see something about climate change in newspapers and magazines or on specialist websites mainly because they do not use them (36% and 43% respectively).[5]
Different demographic groups are likely to receive information about climate change from different sources (Table 2). For example, older age groups are more likely to report receiving information on the television on climate change than the general population. Similarly, younger groups are more likely to get this from social media than the total population.
Men are more likely than women to get information through both news and specialist websites, as well as through newspapers.
| Source | Total | 14-17 | 18-24 | 25-34 | 35-44 | 45-54 | 55-64 | 65+ |
|---|---|---|---|---|---|---|---|---|
| TV | 56% | 41% | 41% | 54% | 52% | 57% | 62% | 64% |
| Social media | 47% | 60% | 66% | 64% | 55% | 45% | 40% | 23% |
Note: All statistically significant changes from the total are highlighted. Green highlights denote data significantly higher than total. Blue highlights denote data significantly lower than total.
2.4 Trusted sources of information on climate change
Regardless of where they currently see or hear information, when thinking about who they trust to give them information or advice on climate change, the Scottish public are most likely to say universities or research organisations (58%). Approximately half (48%) say they would trust the Scottish Government to give them information or advice on climate change. The public are least likely to trust celebrities or influencers (4%) and businesses or private companies (7%) to give them information or advice on climate change. (Figure 4).
Almost half (47%) of those who are currently in education say they trust their teachers or lecturers to provide information or advice. Those in employment are unlikely to trust their colleagues, with only 14% saying they do.
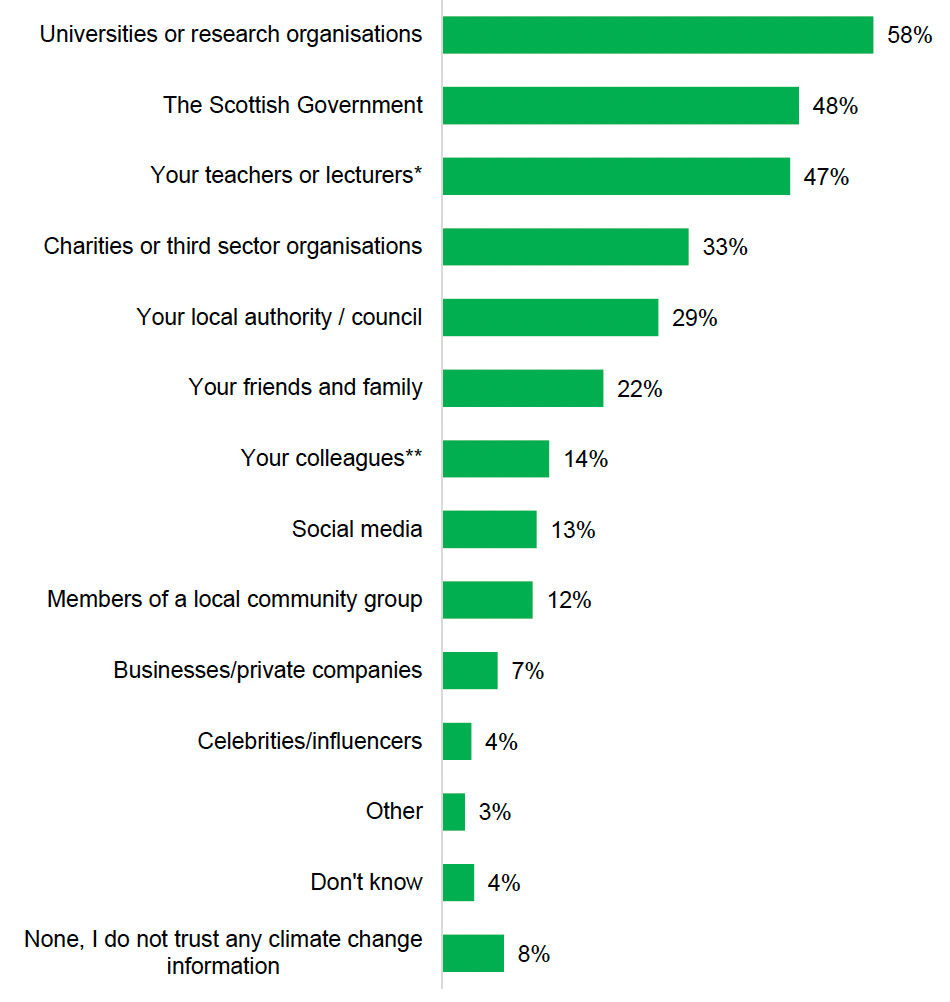
Unweighted bases (1782), multi response question
*only those in education (106), **only those in employment (953)
When looking at which sources are most trusted by different age groups (Table 3), Scottish people aged 18-24 and 25-34 years old are more likely than average to trust information about climate change from friends and family (29%, 27%), social media (28%, 19%), or celebrities or influencers (9%, 7%). 25-34 year olds are also more likely to trust the Scottish Government (56%).
35-44 year-olds are more likely to trust information from their local authority (36%).
Meanwhile, those aged over 65 are significantly more likely than average to say they trust universities and research organisations (65%).
55-64 year-olds and those aged 65 and above are also more likely to say they do not trust any climate change information (12%, 14%) regardless of the source.
| Source | Total | 14-17 | 18-24 | 25-34 | 35-44 | 45-54 | 55-64 | 65+ |
|---|---|---|---|---|---|---|---|---|
| Government | ||||||||
| The Scottish Government | 48% | 53% | 51% | 56% | 51% | 47% | 44% | 43% |
| Your local authority/ council | 29% | 35% | 31% | 34% | 36% | 25% | 27% | 25% |
| Personal network | ||||||||
| Your friends and family | 22% | 48% | 29% | 27% | 24% | 18% | 15% | 15% |
| Media channels | ||||||||
| Social media | 13% | 27% | 28% | 19% | 14% | 10% | 5% | 5% |
| Celebrities/ influencers | 4% | 13% | 9% | 7% | 3% | 2% | 0% | 3% |
| Other organisations | ||||||||
| Universities or research organisations | 58% | 54% | 52% | 55% | 56% | 62% | 56% | 65% |
| Businesses/private companies | 7% | 8% | 11% | 11% | 7% | 8% | 6% | 4% |
| None | ||||||||
| None. I do not trust any climate change information or advice | 8% | 2% | 3% | 4% | 8% | 6% | 12% | 14% |
Note: All statistically significant changes from the total are highlighted. Green highlights denote data significantly higher than total. Blue highlights denote data significantly lower than total.
Further analysis of those who trust the Scottish Government on climate change, shows greater levels of trust amongst minority ethnic groups (58%), those interested in getting involved in activities to combat climate change (58%), those who live in Glasgow (55%), those in employment (52%), and those educated to at least degree level (52%). There are no significant differences between demographic groups with respect to trust in local authorities.
2.5 Knowledge of net zero
When presented with the term "net zero emissions", just under a third (30%) of the Scottish public say that they feel confident that they know what it means (Figure 5). Almost half (48%) say they think they know what it means but are not very confident that they know what it means. Men are more likely than women to say they feel confident that they know what it means (38% vs. 23%). Those educated to at least degree level (35%) are more likely to say they feel confident they know what it means than those with no qualifications/an unspecified qualification (19%).
Only a tiny proportion (3%) of the Scottish public had not heard the term prior to taking the survey.
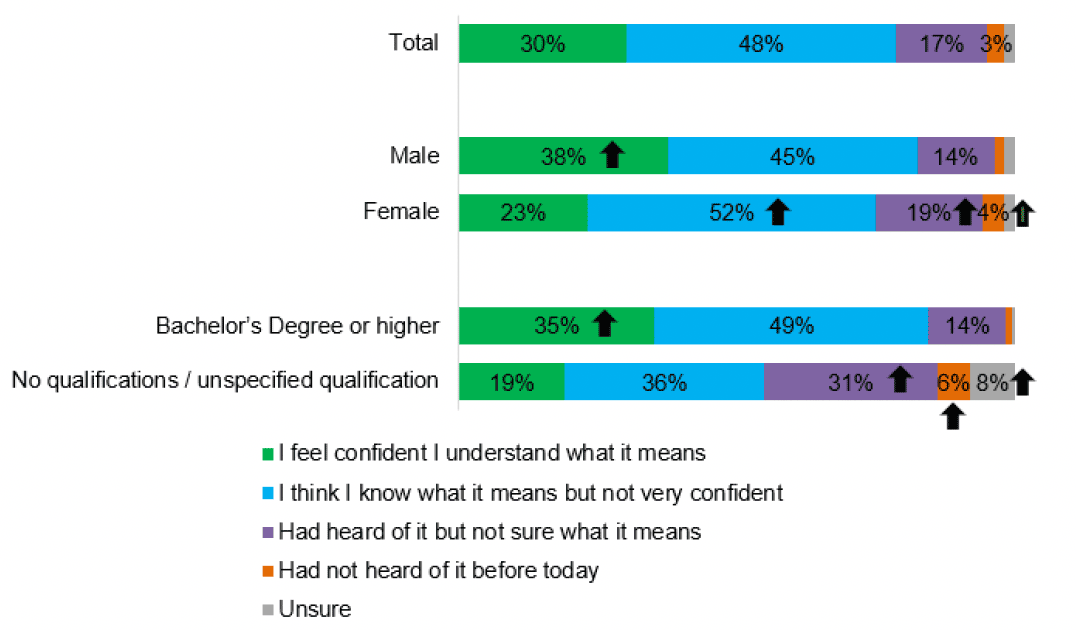
Unweighted bases (1782), single response question
Note: Arrows signify data that is significantly higher than total to a confidence of 95%.
Respondents who said they felt confident they understood what net zero means, or who know what it means but are not very confident, were then asked which year is Scotland's target year for reaching net zero emissions. Only 7% selected the correct year, 2045 (Figure 6), while 79% of the Scottish public think that the target is before 2045 and 9% think it is after. Those aged 25-34 are more likely to believe Scotland's target for reaching net zero emissions is before 2045 (Table 4).
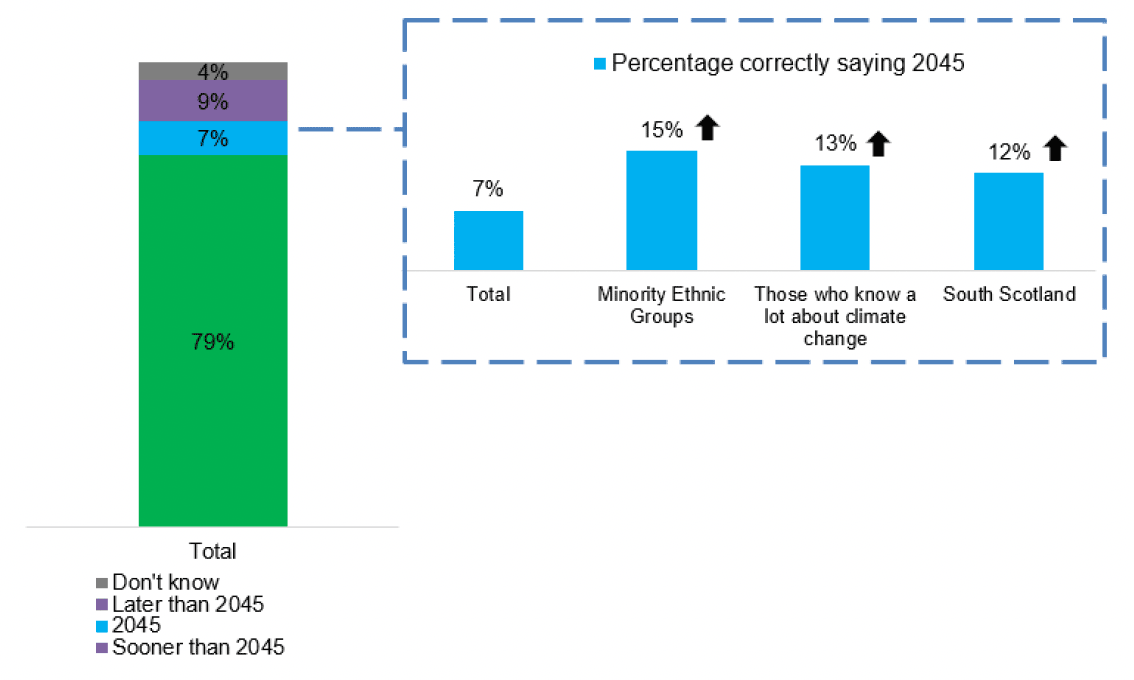
Unweighted bases, those with some prior knowledge of net zero (1361), single response question
Note: Arrows signify data that is significantly higher than total to a confidence of 95%.
| 14-17 | 18-24 | 25-34 | 35-44 | 45-54 | 55-64 | 65+ | |
|---|---|---|---|---|---|---|---|
| Before 2045 | 83% | 76% | 89% | 78% | 81% | 79% | 75% |
Note: All statistically significant changes from the total are highlighted. Green highlights denote data significantly higher than total.
2.6 Awareness of netzeronation.scot
A third (34%) of the Scottish public have at least heard of the website netzeronation.scot, but only 7% say they have used it (Figure 7). 18-24-year-olds are most likely to have heard of the website but not used it (43%), while 25-34-year-olds are most likely to have used the website (16%). In general, younger adults are more likely than older people to have heard of or used the website. However, 14–17-year-olds are less likely to have done so than the two age cohorts immediately above them (18-24, 25-34).
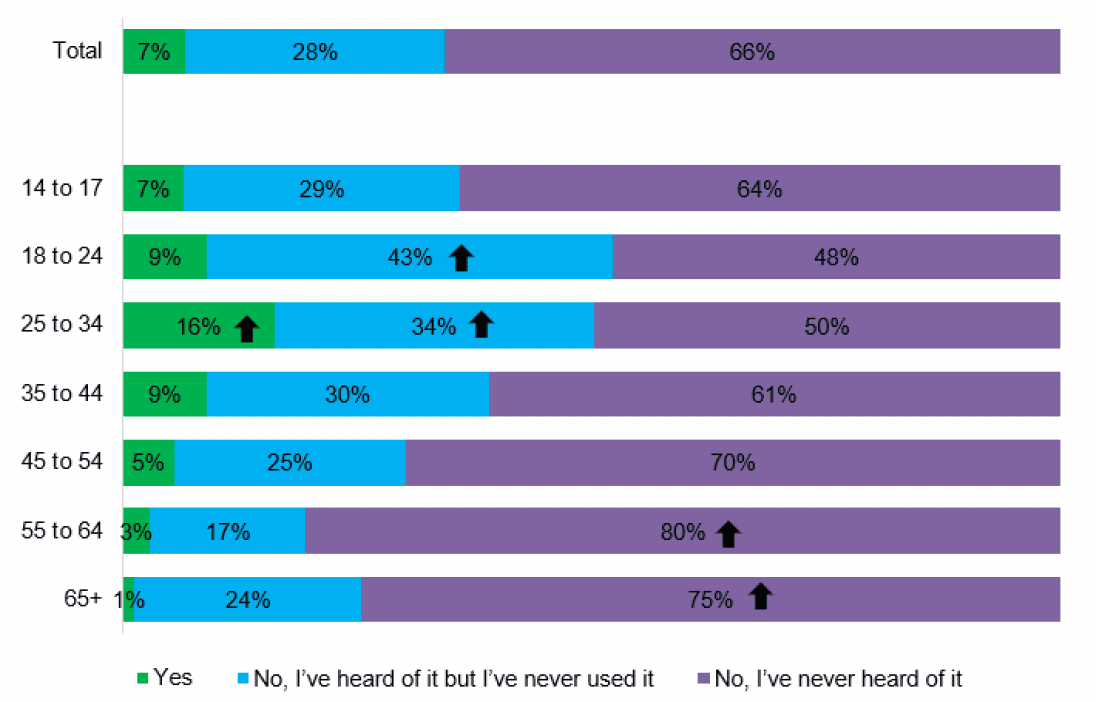
Unweighted bases (1782), single response question
Note: Arrows signify data that is significantly higher than total to a confidence of 95%.
2.7 Knowledge of Scottish Government climate policies
Respondents were presented with a selection of Scottish Government policies and targets designed to help tackle climate change and asked if they had previously heard of them. Awareness of the policies and targets listed varied (Figure 8). The policy with greatest level of awareness was the Scottish Government's target to phase out the need for new petrol and diesel cars by 2030, which more than three-quarters (76%) of the Scottish public say they know at least a little bit about. There is lowest levels of awareness of the policy to reduce car kilometers driven by 20% by 2030 (37% reported knowing at least a little bit about this).
Across all the policies tested, only a small proportion stated that they know a lot about them. Around one in five (21%) say they know a lot about phasing out of the need for new petrol or diesel cars by 2030, but for all other policies, this was around one in 10 or fewer.
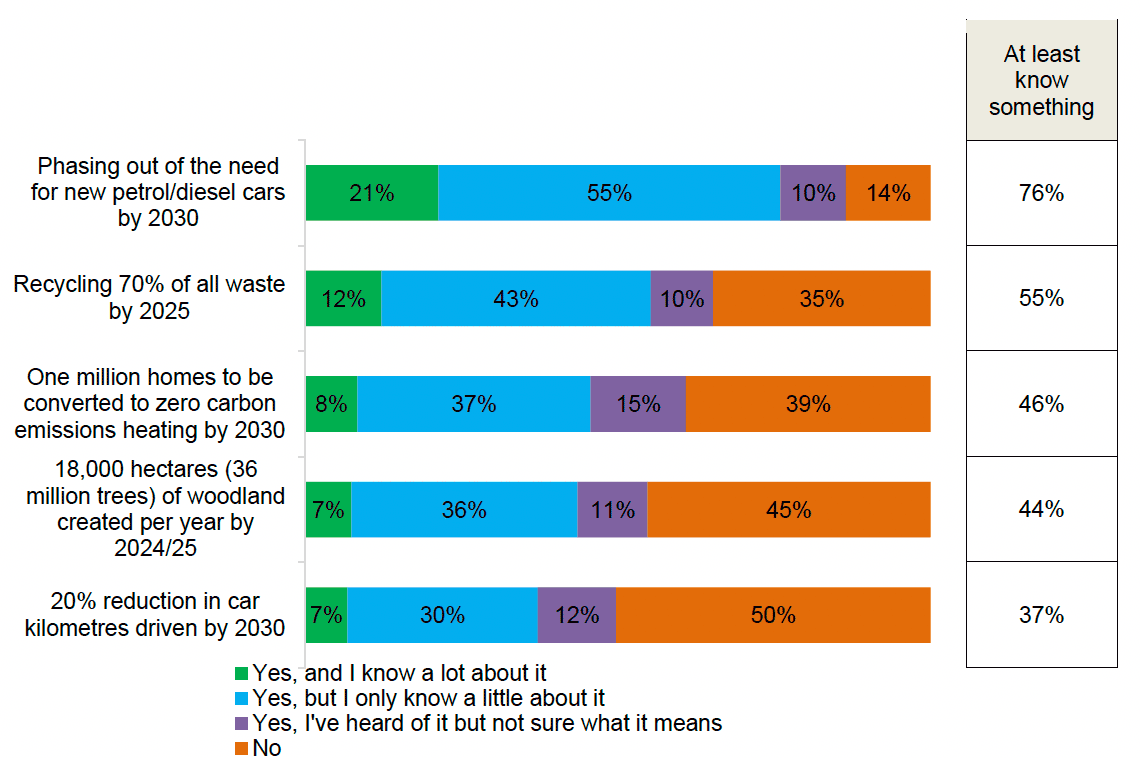
Unweighted bases (1782), single response question
2.8 Knowledge of sources of Scotland's greenhouse gas emissions
When asked what percentage of Scotland's greenhouse gas emissions are produced by a range of different sources, on average, the Scottish public tend to select industry (20%) and transport (18%) as contributing the most and forestry as producing the lowest proportion of emissions (8%) (Figure 9). Those who only know a little about climate change ascribe a slightly higher proportion to transport, closer to its actual value, than those who say they know a lot about it (19% vs. 17%). In contrast, those who know a lot about it ascribe a higher proportion to agriculture, closer to its actual value, than those who know a little (15% vs. 13%).
When compared to the Scottish Government's latest official Greenhouse Gas statistics (2019[6]), on average, respondents substantially overestimated the greenhouse gas emissions emitted by power stations and waste management, and substantially underestimated the emissions contributions of transport and buildings. There is little variation by those who claim to know a lot and those who claim to know a little about climate change, and the actual figure of source emissions.
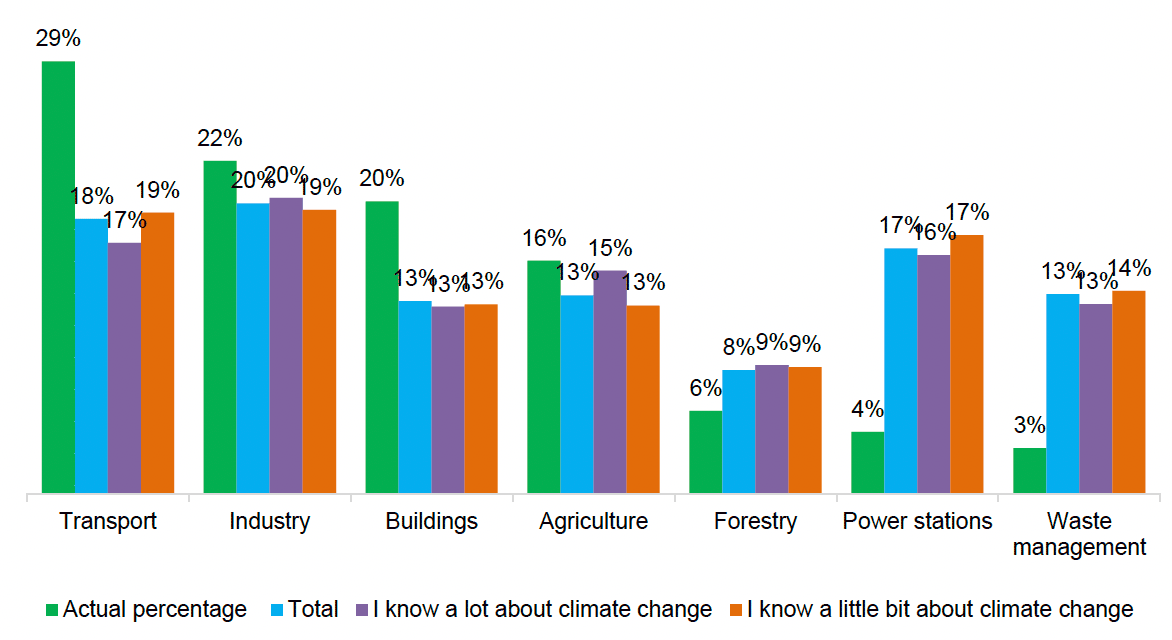
Unweighted bases (1623), single response per row question. Actual percentage sourced from Scottish Government: Scottish Greenhouse Gas Statistics: 1990-2019