Programme for International Student Assessment (PISA 2022): Scotland's results - highlights
Report covering Scotland's performance in the Programme for International Student Assessment (PISA) 2022, covering maths, reading, and science.
Annex 3: How results are displayed in this report
What measures are used
Statistical Significance – This report shows results divided into those countries whose scores are statistically significantly higher than, similar to or lower than Scotland. By "significant" we mean that we are 95 per cent certain that there is a difference (or similarity).
Throughout this report, if one result is described as 'higher' than another, it means it is statistically significantly higher. If there is no statistically significant difference between results they are described as 'similar' and if one result is described as 'lower' than another, it means it is statistically significantly lower.
Link Error – For most of the year on year comparisons in this report, a link error is applied to tests for statistical significance. The OECD provide this to quantify the uncertainty when comparing scores over different waves of data (e.g. 2022 v 2018).
In this report, the link error is important when comparing 2022 reading results with 2012 reading results. From Chart 3.1.1 it appears as though 2012 reading results are statistically significantly higher than 2022 reading results, but due to a large link error between 2012 and 2022, the results are statistically similar.
Mean PISA score – this is the overall PISA score and is the main result used to assess how Scotland's education system is performing. Mean PISA score can be calculated for different characteristics (e.g. gender, immigration background and ESCS group).
Standard Deviation – this is a measure of the spread of the results within a country. A higher standard deviation indicates more variation in the results (i.e. a larger proportion of pupils have a PISA score that is further away from the mean).
Gender – results are generally broken down to show differences between girls and boys and trends of girls and boys over time.
Immigration background– results are broken down by immigration background. The OECD define second generation immigrants as students where one or both parents were born in another country (i.e. not in the UK). First generation immigrants are where the student was born in another country (i.e. not in the UK). Non-immigrants are where the student and both parents were born in the UK.
Proficiency Levels – PISA scores can be grouped into different PISA Levels. It is common to look at the proportion of students performing below PISA Level 2 and at PISA Level 5 or better. PISA defines students attaining below Level 2 as low performers and students attaining above Level 5 as top performers.
ESCS - The OECD analyse social background using the Index of Economic, Social and Cultural Status (ESCS). It is constructed from the responses given by students in their background questionnaire and collects information on parental education and occupation, learning resources in the home and cultural possessions. This index is not comparable to the measure commonly used in Scotland - the Scottish Index of Multiple Deprivation (SIMD). There are two main reasons for this:
1. SIMD is exclusive to Scotland, while ESCS is recorded for all participating countries in PISA. This enables comparative analysis between countries.
2. SIMD is an area based measure, with pupils being allocated to datazones based on their postcode. We talk about pupils living in the '20% most deprived areas' when referring to SIMD. ESCS is generated directly from information provided by the student on their own background, rather than it being based on their home address. This means it avoids issues of more affluent students being resident in areas which are disadvantaged, and vice versa.
The ESCS index is used to derive a number of measures, each of which tell us something different about the impact of social background on performance.
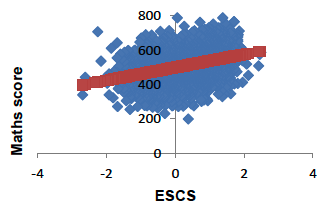
The ESCS gradient, shows simply how much score varies on average with each step (one point) in social background and can be seen by the slope of the line on the graph. Despite many students "bucking the trend", there is still a positive relationship between affluence and performance in PISA overall. For maths in 2012, this was a gradient of 37 score points. A higher score would indicate a steeper gradient, and greater increases in score with background prosperity.
The length of the gradient looks at the students on the 5th and 95th percentiles to ensure that the very extremes of wealth and poverty don't distort the comparison. In Scotland these two notional students were 2.6 points apart by social background measured by ESCS in 2012.
With a gradient of 37 score points, this implies a difference in their maths performance of 96 score points. Although translating this gap into school years of education is not straightforward, the OECD calculate that this could imply as much as three years' difference in learning achievement (with 30 points being equivalent to a year). Note that this measure depends on the size of the gap in society as well as the gap in education ability.
An Official Statistics publication for Scotland
Official and National Statistics are produced to high professional standards set out in the Code of Practice for Official Statistics. Both undergo regular quality assurance reviews to ensure that they meet customer needs and are produced free from any political interference.
Correspondence and enquiries
For enquiries about this publication please contact:
Keith Dryburgh,
Learning Analysis Unit, Scottish Government
e-mail: keith.dryburgh@gov.scot
For general enquiries about Scottish Government statistics please contact:
Office of the Chief Statistician, Telephone: 0131 244 0442,
e-mail: statistics6@gov.scot
How to access background or source data
The data collected for this social research publication:
☐ are available in more detail through Scottish Neighbourhood Statistics
☒ are available via an alternative route on the OECD PISA webpage at www.oecd.org/pisa
☐ may be made available on request, subject to consideration of legal and ethical factors. Please contact <email address> for further information.
☐ cannot be made available by Scottish Government for further analysis as Scottish Government is not the data controller.
Complaints and suggestions
If you are not satisfied with our service or have any comments or suggestions, please write to the Chief Statistician, 3WR, St Andrews House, Edinburgh, EH1 3DG, Telephone: (0131) 244 0302, e-mail statistics6@gov.scot
If you would like to be consulted about statistical collections or receive notification of publications, please register your interest at www.gov.scot/scotstat
Details of forthcoming publications can be found at www.gov.scot/statistics
Crown Copyright
You may use or re-use this information (not including logos) free of charge in any format or medium, under the terms of the Open Government Licence. See: www.nationalarchives.gov.uk/doc/open-government-licence/
Contact
Email: keith.dryburgh@gov.scot
There is a problem
Thanks for your feedback