Housing to 2040 - Present Voices, Future Lives: final report
A final report summarising and describing the responses gathered from children, young people and communities on Housing to 2040 as part of the travelling housing exhibition 'Present Voices, Future Lives' that toured twelve rural, urban and island locations across Scotland in 2019.
5. Results and Discussion
The exhibition was used to frame workshop activities with groups of young people in each location. This gave young people the opportunity to talk about how they live now, what they think are the most important challenges, and how they might live in the future. Some key statistics and interpretations are presented below.
5.1 Exhibition Attendance
The exhibition was attended by 752 people over the twelve locations. These numbers include the participants at the workshops. The overall attendance at the exhibition was constituted by the following demographics:
- 34 young people (aged 1-11)
- 318 young people (aged 11-19)
- 395 people over the age of 20.
- 5 attendees (age not known)
| Location | Overall Attendance | Workshop Participants |
|---|---|---|
| Inverness | 55 | 40 |
| Ullapool | 148 | 27 |
| Kirkwall | 73 | 38 |
| Fort William | 51 | 35 |
| Dundee | 39 | 17 |
| Peterhead | 33 | 19 |
| Irvine | 52 | 41 |
| Glasgow | 57 | 18 |
| Portree | 55 | 30 |
| Rothesay | 73 | 63 |
| Edinburgh | 87 | 52 |
| Galashiels | 29 | 15 |
| Total | 752 | 395 |
Workshop participants were predominantly young people as a result of workshops being arranged with schools. Age groups of workshop attendees are:
- 34 young people (aged 1-11)
- 303 young people (aged 11-19)
- 53 people over the age of 20
- 5 attendees (age not known)
Attendance at the exhibition and workshops exceeded expectations. We anticipated workshop numbers of around 25-30 for each location. More than 30 attended in half the exhibition locations. A total of 395 people participated in the workshops, with an average of 33 participants, and groups ranging from 15 up to 63 individuals.
It was difficult to predict exhibition attendance numbers but the recorded attendance number of 752 people visiting the exhibition is seen as a success, particularly considering that the programme was carried out during November and December often with challenging weather conditions and dark evenings.
5.2 Workshop 1 - How We Live
The first workshop generally ran for 30 minutes. Notes were made by the team of the key points raised in the discussion. The workshop questions were:
1. What type of home do you currently live in?
2. Things you like about your home?
3. Concerns you may have about your home?
4. Circle other ways you would like to live and tell us why (from 'How We Live' cubes presented in the exhibition).
5. Currently what do you think are the most typical ways to live in your local area?
6. Do you think the way you live may change in your local area by 2040? (Yes/ No).
7. If yes – what types of living situations do you think will be more important/ popular by 2040?
An example of a filled out questionnaire can be seen in Appendix 7.3. The questionnaire was completed by the majority of workshop attendees but with diminishing responses for each of the successive questions (see Table 2).
| Location | Q1 | Q2 | Q3 | Q4 | Q5 | Q6 | Q7 |
|---|---|---|---|---|---|---|---|
| Dundee | 17 | 16 | 15 | 13 | 14 | 15 | 11 |
| Edinburgh | 44 | 44 | 39 | 37 | 17 | 16 | 11 |
| Fort William | 31 | 26 | 26 | 26 | 16 | 13 | 12 |
| Galashiels | 14 | 14 | 13 | 11 | 8 | 5 | 4 |
| Glasgow | 17 | 18 | 16 | 12 | 12 | 13 | 12 |
| Inverness | 27 | 27 | 22 | 20 | 24 | 18 | 15 |
| Irvine | 29 | 30 | 24 | 21 | 11 | 7 | 4 |
| Orkney | 33 | 32 | 30 | 22 | 24 | 23 | 25 |
| Peterhead | 19 | 18 | 11 | 18 | 12 | 15 | 4 |
| Portree | 29 | 30 | 28 | 25 | 23 | 24 | 15 |
| Rothesay | 51 | 51 | 43 | 44 | 32 | 27 | 20 |
| Ullapool | 25 | 26 | 23 | 25 | 22 | 17 | 10 |
| Total | 336 | 332 | 290 | 274 | 215 | 193 | 143 |
Each questionnaire was analysed with answers recorded in a place specific spreadsheet (see Appendix 7.5). Responses were compiled for each question to understand how many times an identical or similar answer was given for each question. For example in Inverness with respect to question 2 – 'What do you like about your home?' The most popular answer given was 'spacious' (12), followed by 'big garden' (8), 'close to nature' (6) and 'close to amenities/ town-centre' (5).
The question on ways of living in your local area created differing descriptions by each participant of the principal house types in the local area which it was not possible to quantify or even summarise, for this reason results for this question were not compiled. A survey of house types within a designated area would be better conducted by GIS survey methods. The final question asking about expected changes to your local area by 2040 was less well completed with no real consistency to the answers, making any quantification irrelevant.
Having carried out this procedure for each of the twelve locations an overall spreadsheet was generated which compiled the responses from participants across all exhibition locations (see Appendix 7.5 How We Live Overall Outcomes). This spreadsheet includes the most frequent responses to each question for each area. So for instance in Kirkwall in relation to question 3, 'Concerns you may have' the most popular answer was cold/ heating the home (11), followed by no concerns (5), followed by access to public transport (4).
The most popular responses for all locations can be read in Table 3. This spreadsheet allowed us to collate responses which were common or similar across all twelve locations creating a table of outcomes for 'How We Live' linking home types with the most frequent 'Likes' and 'Concerns', and preferred ways of living.
| Home type | Likes | Concerns | Preferred Home | ||||
|---|---|---|---|---|---|---|---|
| D/SD | 94 (28%) | Garden, access to nature | 45 (14%) | None | 42 (14%) | CSB | 127 (46%) |
| T+T | 43 (13%) | Spacious | 44 (13%) | Maintaining old home | 29 (10%) | NB | 76 (28%) |
| Rural | 33 (10%) | Views | 30 (9%) | Cold, heating home | 15 (5%) | Rural | 40 (15%) |
| Flat | 26 (8%) | Family / neighbours | 24 (7%) | RRR | 25 (9%) | ||
| Suburban | 16 (5%) | Comfort | 22 (6.5%) | TCL | 13 (5%) | ||
| CSB | 14 (4%) | Access to amenities | 15 (5%) | S+NT | 11 (4%) | ||
Acronyms have been used for home types in Table above
D/SD – Detached or semi-detached; T+T – Tenements and terraced; CSB – Custom Self-build; NB – New-Build; RRR – Re-use, re-purpose, re-cycle; TCL – Town Centre-living; S+NT – Suburban and New Town
How We Live - Summary of Responses
Q1. Type of home
The most popular answer from participants who responded to Q1 on 'type of home' described their home as detached or semi-detached (94). This figure constituted 28% of participants who had answered this question. This was followed by 'Tenements and Terraced' with (43/ 13%). After this came Rural with (33/ 10%).
Q2. Things liked about the home
The most popular answer from participants who responded to Q2 on 'things you like about your home' highlighted their garden or access to nature from the home (45). This figure constituted 14% of participants who had answered this question. This was followed by 'spaciousness' (44 / 13%) and then views (30 / 9%). Access to family and good neighbours was also popular with (24 / 7%) followed by comfort (22/6.5%) and access to amenities (15 / 5%).
Q3. Concerns about the home
The most popular answer from participants who responded to Q3 on 'Concerns about your home' stated that they had no concerns (42). This figure constituted 14% of participants who had answered this question. This was followed by 'maintaining an old home' (29 / 10%) and then cold/ heating the home (15 / 5%).
Q4. Other ways you would like to Live
The most popular answer from participants who responded to Q4 on 'Other Ways you would like to Live' stated that they would like to live in a Custom-Self-Build home (127). This figure constituted 46% of participants who had answered this question. This was followed by New-build (76/ 28%) and then living rurally (40 / 15%). Comments received on Custom Self-Build included: "I think it's a great idea, but there need to be more companies who specialize in this" and 'It would give me freedom and happiness and I could make it eco-friendly and sustainable".
Q5. Typical ways to live in your local area.
No results presented as previously stated, the question on ways of living in your local area created differing descriptions by each participant of the principal house types in the local area which it was not possible to quantify or even summarise. For this reason results for this question were not compiled. A survey of house types within a designated area would be better conducted by GIS survey methods.
Q6. Your local area by 2040.
The first part of Question 6 asked participants if they thought that their local area would change by 2040 (yes/ no) and if yes to describe how it would change (see Table 4).
Generally more participants in each area believe that their area would change by 2040. Irvine and Peterhead were the only communities where participants were more likely to think that their local area would not change by 2040. One young person in Peterhead commented: "no-one wants to change here. People are very traditional, they complain a lot but do nothing."
The second part of Question 6 asked participants to highlight in what ways they thought their local area might change by 2040. The answers to this question were extremely varied and not possible to quantify. Themes raised by participants in their answers included: concerns over the growing population; the need for more houses; eco-friendly design; and improved technology.
| Location | Yes | No |
|---|---|---|
| Inverness | 14 | 4 |
| Ullapool | 12 | 5 |
| Kirkwall | 10 | 5 |
| Fort William | 11 | 2 |
| Dundee | 11 | 4 |
| Peterhead | 6 | 9 |
| Irvine | 4 | 4 |
| Glasgow | 12 | 1 |
| Portree | 15 | 9 |
| Rothesay | 22 | 5 |
| Edinburgh | 13 | 5 |
| Galashiels | 4 | 1 |
| Total | 134 | 52 |
How We Live - Discussion
The 'How We Live' workshop appeared to be enjoyed by participants, who took part enthusiastically in the activity. The things that participants most liked about their home were their garden or access to nature from the home. This was followed by 'spaciousness' and then 'views'. 'Access to family' and 'good neighbours was also popular followed by 'comfort' and 'access to amenities'.
The majority of participants had 'no concerns' in relation to the home. This would suggest many participants were largely satisfied with where they live and with their home environment. Other concerns related to heating (especially an old homes) and maintaining older homes, as a result of Scotland's often cold climate and the spiraling cost of heating in the last few years.[5] Much of Scotland's housing stock is old,[6] one example being the Victorian tenement or terrace, (a popular response from participants as to how they lived now). The cost and responsibility of maintaining an old home can place stress on individuals and families both emotionally and financially.
A particularly interesting statistic was recorded in relation to housing preferences in the future. 46% of people who answered the question on how they would like to live by 2040, selected 'Custom Self-Build' as their preferred 'Way of Living' in the future. Whilst our results are not conclusive, it appears many people, particularly young people would like to have some say in the design and creation of their homes and home environments. On the rise both in the UK and Europe is a system of housing delivery which enables purchasers to select the design of the interior home from a series of design options. These options tend to be at the higher end of the market at present however.
The Scottish Government's Housing to 2040 draft vision and principles address this issue in the section on 'Homes that Meet People's Needs' with the clearly defined aspiration:
"land is available to support further housebuilding and the community is engaged and involved with taking forward proposals for housing in new and innovative ways, for example through self-build projects"
5.3 Workshop 2 - Challenges to 2040
The second workshop 'Challenges to 2040' was designed to allow people to rate the twelve challenges identified in the exhibition in relation to their housing and communities, going forward to 2040.
Participants were invited to rate the importance of each challenge for where they lived on a scale from 1 = not important to 7 = very important. Participants were then invited to give a reason for each of their scores. The challenges are:
Live/ Build Settlement (Set), Environment (Env), Getting Around (GA)
Live/ Share Adaptability (Adap), Community (Com), Resources (Res)
Live/ Grow Well-being (WB), Biodiversity (Bio), Healthy-Places (HP)
Live/ Learn Skills, Work, Influence (Infl)
An example of a filled out questionnaire can be seen in Appendix 7.7.
The questionnaire was generally well completed. Some participants selected just to provide a score for each challenge. Others provided reasons for some of the scores and some participants gave a reason for every score.
Each questionnaire was analysed with all answers recorded on a place specific spreadsheet (see Inverness Challenges in Figure 13).
Scores were averaged for each challenge. Blank or indecipherable scores were disregarded. A subsequent average score was generated for each challenge and the order of importance of each challenge was created, i.e. 1st, 2nd, 3rd equal etc. (see Table 5).
Qualitative responses explaining the participants' choice of the challenge were categorized and compiled to give a sense of the 'top 10 comments' for each area. Generally these comments mapped onto the various challenges represented in the exhibition. For example the most frequent comments in Inverness related closely to 'Resources', the importance of a healthy lifestyle and places and concerns over the changing climate, which were the most important challenges in this location. The comments gave us another window into more place specific challenges highlighted by our participants. For instance in inverness in relation to 'Getting Around' many participants raised the issue of expensive and unreliable public transport. One participant commented:
"Public transport is unreliable so more people end up using their own cars to get around."
A summary of more place specific comments relating to each location is as follows;
Inverness Concerns over population growth; flooding; and changing homes for older people.
Ullapool Caring communities; getting to work and school; work opportunities.
Kirkwall Access to resources; public transport; and mental health in isolated locations.
Fort William Public transport; work opportunities; lack of affordable housing.
Dundee Importance of community; public transport; and mental health and well- being.
Peterhead Work opportunities; community spirit; and amenities for younger people.
Irvine Importance of skills; safety; and the post-Brexit economy.
Glasgow Community interaction; brownfield developments; and too much student housing.
Portree Work and skills; community spirit; and access to medical care.
Bute Work opportunities; public transport; and affordable housing.
Edinburgh Community spirit; work opportunities; adaptable homes.
Galashiels Public transport; amenities for younger people; re-using old buildings.
A single data sheet was then created for each location which included a graph illustrating the importance of the twelve challenges (always in the same order). The top three challenges for each area were highlighted along with their relative scores.
The most frequently commented upon issues were also highlighted along with representative comments. Data sheets for all locations are in Appendix 7.8. Inverness data sheet below:
Inverness Challenges Ranking
1st - Environment (6.0)
2nd - Resources (5.7)
3rd - Wellbeing (5.6)
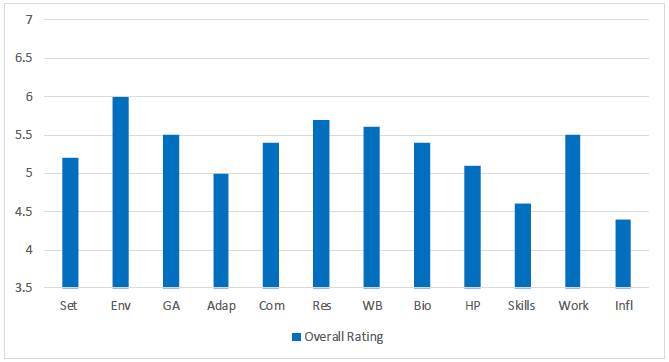
Figure description:
This figure presents a graphic visualisation of ranking of challenges for Inverness workshop. The second workshop ‘Challenges to 2040’ was designed to allow people to rate the twelve challenges identified in the exhibition in relation to their housing and communities, going forward to 2040.
Most Frequent Comments
1. Resources
2. Transport
Representative Comments
1. "Resources are finite, once they are gone they are gone. It is important that we use them efficiently".
2. "Pedestrianise the town centre, cycle paths, unreliable public transport, abundance of traffic".
Challenges to 2040 - Analysis
The top 3 challenges in each area with their relative scores were as follows:
| Location | 1st | Challenge | Score | 2nd | Challenge | Score | 3rd | Challenge | Score |
|---|---|---|---|---|---|---|---|---|---|
| Inverness | 1 | Environment | 6.0 | 2 | Resources | 5.7 | 3 | Well-being | 5.6 |
| Ullapool | 1 | Well-being | 6.6 | 2 | Environment | 6.4 | 3 | Healthy Places | 6.3 |
| Kirkwall | 1E | Environment Well-being | 5.8 | 3 | Work | 5.7 | |||
| Fort William | 1 | Well-being | 6.3 | 2E | Environment Healthy Places Getting Around | 6.2 | |||
| Dundee | 1 | Well-being | 6.8 | 2 | Healthy Places | 6.6 | 3 | Environment | 6.5 |
| Peterhead | 1E | Work Environment Well-being | 6.0 | ||||||
| Irvine | 1 | Resources | 6.5 | 2 | Environment | 6.4 | 3E | Healthy Places Work | 6.1 |
| Glasgow | 1 | Environment | 6.4 | 2 | Well-being | 6.1 | 3 | Resources | 6.0 |
| Portree | 1 | Work | 6.4 | 2E | Environment Skills | 5.8 | |||
| Rothesay | 1 | Well-being | 6.2 | 2 | Environment | 6.1 | 3 | Resources | 6.0 |
| Edinburgh | 1 | Resources | 5.8 | 2 | Healthy Places | 5.7 | 3 | Environment | 5.5 |
| Galashiels | 1E | Environment Healthy Places | 6.8 | 3 | Biodiversity | 6.4 |
Having completed the results for the challenges faced by each individual location we then produced a further set of results which looked at the challenges faced by the following categories of place. These were:
Overall (including all locations)
Cities (Glasgow, Edinburgh, Dundee and Inverness)
Islands (Kirkwall, Portree and Rothesay)
Towns (Peterhead, Irvine, Galashiels)
Rural (Ullapool and Fort William)
This categorisation differs slightly to that displayed on the tour poster which defined Galashiels as Rural and Fort William as a Town. This change was made for two reasons - size of settlement and location proximity to other settlements. The geographical spread where workshop participants lived was also taken into account.
Fort William becomes defined as Rural. With a population around 5,800 it is a small settlement. Workshop participants did not come exclusively from Fort William, with many of the participants living in other smaller settlements such as Ballachulish, Lochyside and the wider Lochaber rural area. This was similar to Ullapool (population 1,500) where only fifteen of our twenty-seven workshop participants told us they lived in Ullapool, the other twelve living remotely. For these reasons our Fort William and Ullapool analysis was categorised as 'Rural'; i.e. a smaller urban settlement in a rural location with a large number of participants from the wider rural area.
In the island locations many of the young people who took part in the workshops did not live in the town, but came from locations across the island/s. For instance in our workshop in Portree on the Isle of Skye only seven of our thirty workshop participants told us that they lived in Portree.
Irvine and Peterhead with approximate populations of 33,000 and 18,500 respectively are larger urban settlements. They both are commuter towns for Glasgow and Aberdeen respectively. Galashiels was initially categorised as 'Rural' due largely to its location in the Scottish Borders. With a population of around 14,000 it is a similar sized urban settlement. It also has close proximity to a network of Border towns such as Hawick and Peebles and is also a commuter town of Edinburgh. In addition to the geography all of our workshop participants in the locations of Irvine, Peterhead and Galashiels told us they lived in the town or in the immediate surrounding area. For these reasons Galashiels was defined for the purpose of analysis as a 'Town' alongside Irvine and Peterhead.
The ranking of Challenges across all locations and in each category of place (City, Island, Town and Rural) are illustrated in the following five charts.
Scotland's Challenges – Importance on a scale of 1-7
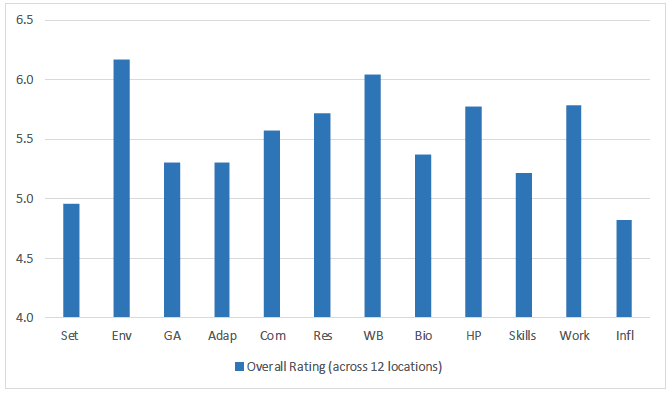
Figure description:
This figure provides a graphic visualisations of the overall ranking of Scotland’s challenges as captured at the workshops across all 12 locations. The top three challenges were: Environment, Well-being and Healthy-Places and Work at the same rating.
Cities Challenges – Importance on a scale of 1-7
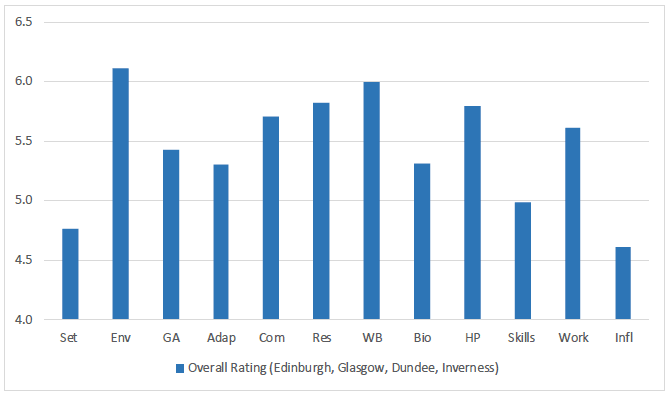
Figure description:
This figure provides a graphic visualisations of the overall ranking of Cities challenges as captured at the workshops across all city locations (Edinburgh, Glasgow, Dundee and Inverness). The top three challenges were: Environment, Well-being and Resources.
Islands Challenges – Importance on a scale of 1-7
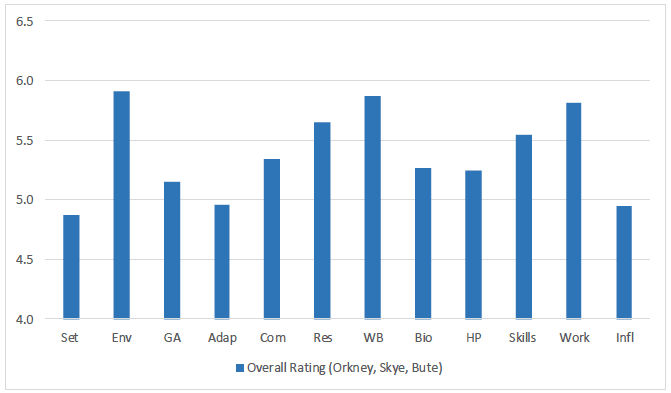
Figure description:
This figure provides a graphic visualisations of the overall ranking of Islands challenges as captured at the workshops across all islands locations (Orkney, Skye, Bute). The top three challenges were: Environment, followed by Well-being and Work.
Towns Challenges – Importance on a scale of 1-7
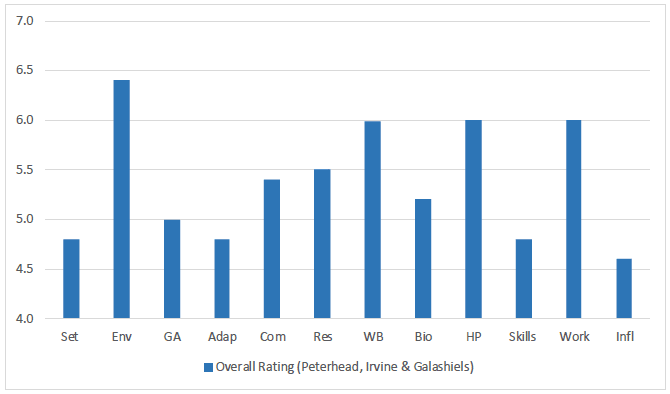
Figure description:
This figure provides a graphic visualisations of the overall ranking of Towns challenges as captured at the workshops across all towns (Peterhead, Irvine and Galashiels). The top three challenges were: Environment, followed by Healthy-Places and Work.
Rural Challenges – Importance on a scale of 1-7
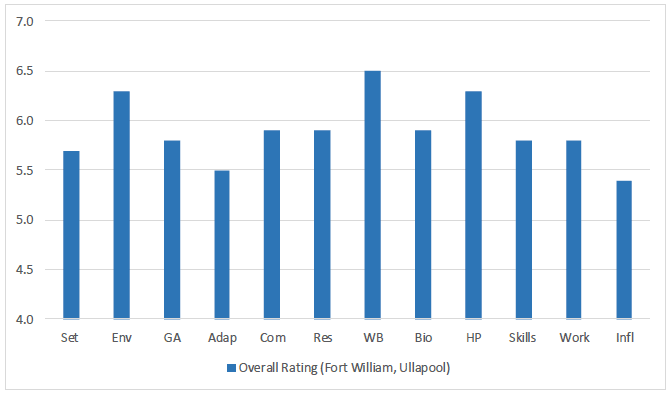
Figure description:
This figure provides a graphic visualisations of the overall ranking of Rural challenges as captured at the workshops across all rural areas (Fort William, Ullapool). The top three challenges were: Well-being, followed by Environment and Healthy-Places.
'Environment' and 'Well-Being' were consistently seen as the key challenges for workshop participants in all locations. 'Healthy Places', 'Work' and 'Resources' are also seen as important.
The most important challenge selected by workshop participants in relation to how we live in the future is the challenge of dealing with the environment and the global climate emergency. 'Environment' presents as the primary challenge overall for all workshop participants and also the three regional categories of Cities, Islands (1st equal) and Towns. In relation to each individual location 'Environment' was consistently considered one of the top three challenges and is rated top challenge in five of the twelve locations. The environment in relation to housing runs across many issues from where we build and why we build there.
Comments made by workshop participants in relation to the 'Environment' include:
"I'm worried about sea-level rise" (Kirkwall)
"We need more electric car charging points" (Inverness)
Over all locations 'Well-Being' is the second top challenge. 'Well-being' as defined by the 'Present Voices Future Lives' exhibition relates primarily to human physical and psychological health. In nine of the twelve 'Present Voices Future Lives' locations 'Well-Being' is ranked in the top three challenges. Interestingly among participants from the Islands 'Well-Being' was first equal alongside the 'Environment' and it was ranked the most important challenge for Rural locations. It was ranked the second most important challenge for people who live in Cities and joint second in Towns (with Healthy Places and Work).
Well-being and Healthy Places was reflected by the following comments:
"Well-being is essential" (Ullapool)
"healthy places make healthy people" (Edinburgh)
The third key concern relates to 'Work' and 'Healthy Places'. Both of these challenges presented themselves equally as the third top challenge overall with a score of 5.8 out of a possible 7.0. 'Work' tended to emerge as more of a concern in Towns and on the Islands. It was the second equal most important challenge in the Towns category (6.0) and third in the Islands category (behind 'Environment' and 'Well-Being' as 1st equal), with a score of 5.8. It is the most important challenge in Portree and the third most important in Kirkwall (Islands). It is the most important challenge in Peterhead and the third equal in Irvine (Towns). The lack of interesting opportunities to work locally was highlighted by participants in Galashiels.
Some areas like Peterhead had particular concerns due to changes in local industry. In Peterhead one young person commented:
"We have lots of people who were in the Oil and Gas sector and when that went down people got paid off and that was that. Lots of our parents' generation left school without grades and went straight into relatively bountiful jobs"
The challenge of 'Resources' regularly scored highly, being the top challenge in Irvine and Edinburgh, second top in Inverness and the third top challenge in Glasgow and Bute.
"We will not always have access to suitable resources". (Irvine)
Challenges to 2040 - Discussion
As previously stated the 'Challenges' workshop was enthusiastically engaged with by all participants who appeared to enjoy the dynamic of using the exhibition information and then rating the challenges presented - refer to the challenges charts (Figures 14 - 18) in the previous section. Discussions held with participants as to their scores helped to yield a second layer of information. Some of the quotes from those discussions are presented here.
The workshops explored how we build sustainable homes and communities and how we manage consumption in our daily lives. The use of sustainable materials and processes of construction, homes designed to produce zero carbon, circular economy initiatives involving the recycling of materials and everyday objects are just some of the ways we can contribute to a healthier environment in the design of our homes and in our daily living. The Scottish Government's Housing to 2040 draft vision and principles state:
"We must ensure our homes are energy efficient and are able to adapt to the effects of climate change".
'Well-Being' and housing can relate to a whole series of issues from home and community food growing, access to garden and nature, home comfort, feelings of belonging and place attachment, access to family and good neighbours, housing being able to meet our physical and psychological needs and many others. These factors should all be carefully considered in the framing of the new Housing to 2040 vision and route map. One Dundee participant stated: "New housing fails to promote connectivity, health and well-being".
Interestingly, in the Cities, 'Work' only presents itself as the sixth most important challenge. It also comes in as 7th equal in our rural category. It is worth noting that Fort William was the one location where we engaged with young people of primary school age, with twenty-six of our thirty-five workshop participants falling into that category. Clearly concerns about work are less prevalent among younger children and this we suspect will have altered the findings in this category.
However, it is worth noting that due to the majority of participants being In the 11-17 age category and potentially being poised on the edge of the world of work that this concern is more elevated than it would be for a more equal population sample. However these young people will be in adulthood by 2040 and some in early middle age and this clearly is a key concern of that age group. Focus group discussions helped to open out this perceived challenge more clearly and articulated the following concerns: access to suitable and attractive jobs in remote areas; living in a remote area and potentially having to travel a long way to work; changing patterns of work due to technological advancement; and loss of jobs for the same reason. "There are not a lot of good job opportunities on Skye" was an opinion voiced in group discussion following the Challenges workshop. Also the constantly changing and evolving world may mean that to be employable in the future the need to continually update and refresh a person's skill base will be required.
Healthy Places achieves a third equal score both overall and in the cities visited, and rises to second equal in both towns and rural areas. In the individual location analysis, Healthy Places comes second on three occasions and also third on three occasions.
Healthy Places is clearly linked to Well-being and relates to urban green space, access to places to exercise and engagement in active travel as well as community food growing. The Scottish Government's Housing to 2040 draft vision and principles addresses the need for well-designed places and health and well-being in the section on 'Sustainable Communities'. "We all benefit from good physical and mental health from a clean environment, inspiring and well-maintained surroundings".
The qualitative responses to the 'Challenges' questionnaire display a more place specific concern and on occasion present challenges out with the categories represented in the exhibition. Generally they express concerns over public transport, work opportunities and the importance of community. Interesting responses which are completely place specific include: mental health in isolated communities (Kirkwall); more amenities for younger people (Peterhead & Galashiels); and affordable housing (Fort William and Bute).
5.4 Workshop 3 - Home of the Future
The Home of the Future exercise was an invitation to participants to draw, diagram or write about their ideal home of the future. This activity generally ran for around 30-45 minutes in each location.
Most of the houses drawn were of a conventional nature with design features which reflected the desires of the author of the drawing and these tended to be quite personal. Some participants engaged in highly imaginative proposals which incorporated ideas from popular culture (see Appendix 7.9).
Many different types of drawing were attempted from plans, elevations and overall three dimensional views. Diagrams which displayed the key elements of the ideal home of the future were also attempted. Some pupils did consider more of the themes of the exhibition and tried to consider how a house in the future might respond to some of the ideas presented in the exhibition.
Drawings produced in each location during daytime workshops were displayed at the evening exhibition. The drawings from the Home of the Future Workshop provided an interesting, visual, qualitative output for the 'Present Voices Future Lives' exhibition. It was not envisaged that this output would be capable of further analysis.
Further examples of Ideal Home of the Future drawings can be seen in Appendix 7.10.
Below is a good example of this with a project drawn by a student from Inverness Royal Academy which displays the following:
- More storeys to take up less ground.
- Solar panels on the roof to help with energy efficiency.
- Home food growing to help with health and well-being.
- Contribution to biodiversity (insect house and animal haven).
- Sustainable drainage through rainwater harvesting.
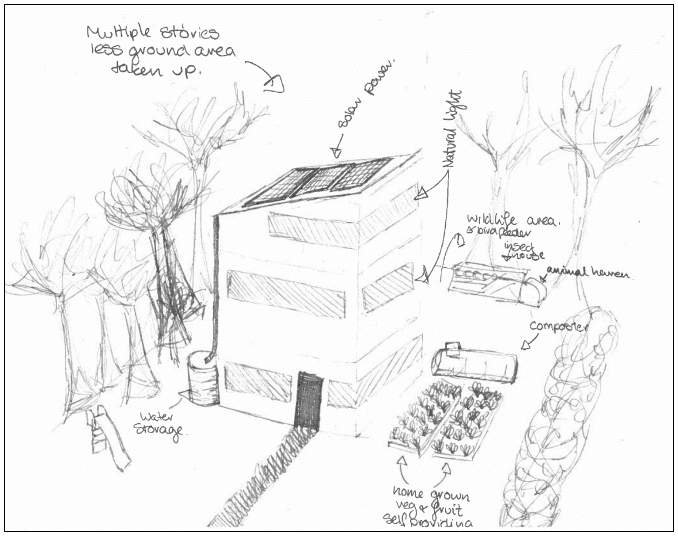
Figure description:
Example of an ideal home of the future as drawn by a pupil at Inverness Royal Academy. The drawing of this ideal home displays the following: More storeys to take up less ground, solar panels on the roof to help with energy efficiency, home food growing to help with health and well-being, contribution to biodiversity (insect house and animal haven), and sustainable drainage through rainwater harvesting.
5.5 Workshop 4 - The Place Standard
The Place Standard Assessment tool was utilised in all locations. An A3 sheet incorporating the scoring chart and all of the key questions asked by the tool was handed out to participants. Participants were then asked to score each of the place standard categories, whist providing a qualitative reason for the score provided. Once the chart had been completed we encouraged pupils to colour in the resultant profile, making a clearer visual representation of the assessment.
Both the standard version and the younger person's version of the assessment tool were used depending on the age of the participant. The format and questions of both versions are the same, but with simpler language used in the young person's version. See blank version of the Young Person's (YP) assessment sheet below.

Figure description:
Graphic of young person’s Place Standard Assessment Sheet, which uses simpler language than the standard version focuses on the following categories: Moving Around, Public Transport, Traffic & parking, Streets & Spaces, Natural Spaces, Play & Recreation, Facilities & Amenities, Work & Local Amenities, Housing & Community, Social Interaction, Identity & Belonging, Feeling Safe, Care & Maintenance and Influence & Sense of Control. A circular diagram in the middle of the sheet is used as a scoring chart to score each of the place standard categories.
Almost all participants engaged enthusiastically with the Place Standard Assessment tool. Most participants filled out their assessment in around 30 minutes. Generally the questionnaires were well completed and participants seemed to enjoy the process. Pupils engaged enthusiastically in discussions with peers and workshop facilitators during the workshop.
An example of a filled out Place Standard Assessment is below.
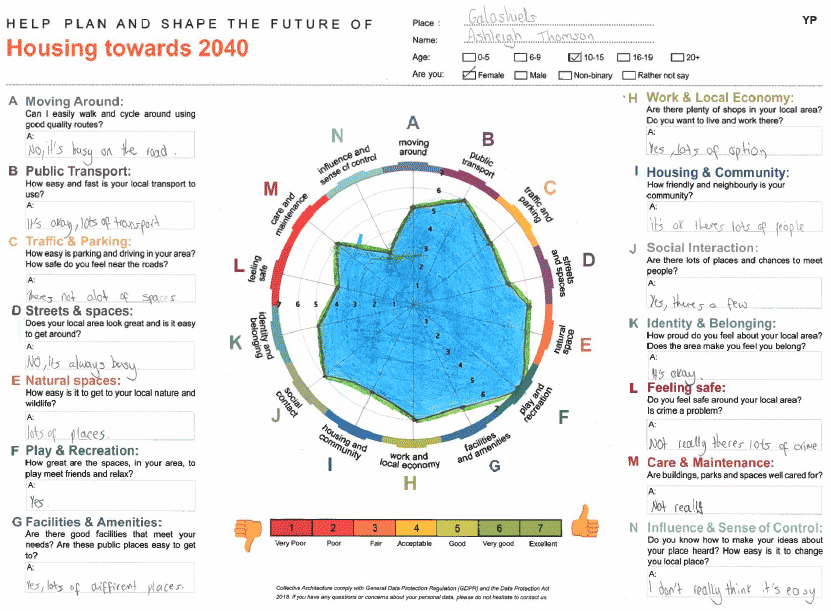
Figure description:
This picture presents a filled out version of a Place Standard Assessment sheet by a young person from the workshop in Galashiels.
The Place Standard - Analysis
Data generated was analysed to calculate Place Standard Assessment outcomes for each location. These included the creation of an average profile for each location taking into account average scores for each of the fourteen categories of assessment. The fourteen assessment categories are:
A. Moving Around,
B. Public Transport,
C. Traffic and Parking,
D. Streets and Spaces,
E. Natural Spaces,
F. Play and Recreation,
G. Facilities and amenities,
H. Work and Local Economy
I. Housing and Community,
J. Social Interaction,
K. Identity and Belonging,
L. Feeling Safe,
M. Care and Maintenance,
N. Influence and Sense of Control
Qualitative data was also collected for each of the fourteen categories with a collection of quotes highlighted for each assessment category. An example of the data from these analyses are shown in Figures 22 a, b & c.
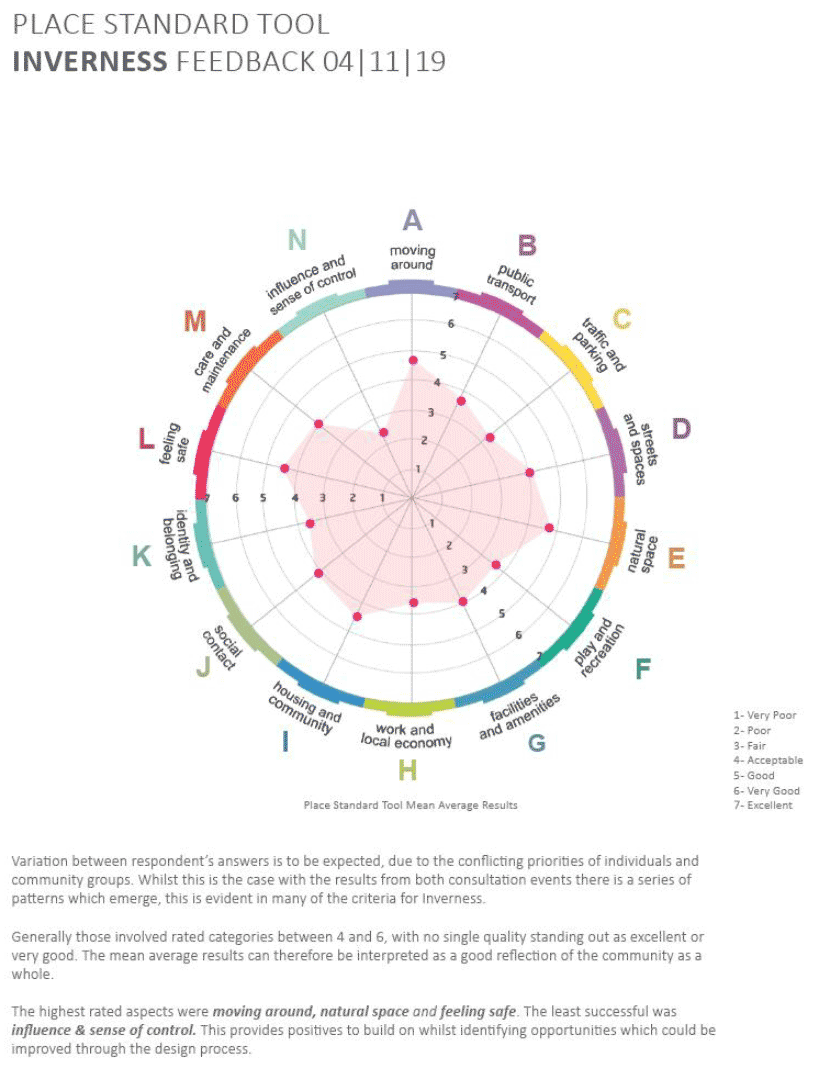
Figure description:
This figure provides an example of a graphic visualisation of the circular diagram which was used as a scoring chart in the Place Standard Analysis from Inverness.
| Respondent | Moving Around | Public Transport | Traffic & Parking | Streets & Spaces | Natural Space | Play & Recreation | Facitilies & Amenities | Work & Economy | Housing & Community | Social Ineraction | Identity & Belonging | Feeling Safe | Care & Maintenance | Influence & Sense of Control |
|---|---|---|---|---|---|---|---|---|---|---|---|---|---|---|
| 1. NS | 5 | 3 | 3 | 6 | 5 | 6 | 6 | 5 | 6 | 6 | 6 | 4 | 4 | 5 |
| 2. LS | 5 | 4 | 3 | 7 | 5 | 6 | 7 | 6 | 7 | 7 | 7 | 6 | 5 | 2 |
| 3. SC | 4 | 3 | 4 | 3 | 7 | 6 | 4 | 5 | 3 | 6 | 5 | 6 | 6 | 6 |
| 4. MDLT | 3 | 2 | 4 | 6 | 7 | 6 | 6 | 4 | 4 | 6 | 7 | 6 | 6 | 4 |
| 5. JF | 4 | 4 | 4 | 4 | 6 | 6 | 6 | 4 | 5 | 6 | 5 | 5 | 5 | 3 |
| 6. JB | 5 | 4 | 3 | 3 | 3 | 2 | 4 | 4 | 6 | 4 | 1 | 4 | 4 | 3 |
| 7. RR | 5 | 3 | 4 | 6 | 6 | 4 | 6 | 3 | 5 | 4 | 3 | 6 | 6 | 6 |
| 8. LM | 6 | 5 | 4 | 6 | 5 | 6 | 6 | 4 | 5 | 4 | 4 | 5 | 5 | 4 |
| 9. NW | 6 | 3 | 2 | 3 | 4 | 2 | 4 | 3 | 5 | 5 | 5 | 6 | 4 | 2 |
| 10. BG | 5 | 4 | 3 | 4 | 6 | 4 | 6 | 5 | 5 | 3 | 5 | 6 | 4 | 3 |
| 11. SI | 3 | 1 | 2 | 3 | 6 | 4 | 4 | 3 | 4 | 3 | 4 | 6 | 2 | 1 |
| 12. CR | 4 | 4 | 1 | 3 | 5 | 2 | 4 | 2 | 6 | 4 | 4 | 5 | 2 | 2 |
| 13. GCF | 6 | 5 | 4 | 3 | 4 | 3 | 3 | 5 | 5 | 5 | 2 | 4 | 3 | 4 |
| 14. CW | 6 | 3 | 5 | 3 | 2 | 2 | 4 | 4 | 6 | 7 | 2 | 2 | 3 | 3 |
| 15. R | 6 | 4 | 3 | 4 | 6 | 4 | 6 | 5 | 4 | 4 | 3 | 4 | 5 | 2 |
| 16. TR | 6 | 6 | 4 | 7 | 7 | 3 | 4 | 4 | 3 | 2 | 5 | 6 | 4 | 1 |
| 17. DW | 6 | 5 | 6 | 2 | 5 | 5 | 5 | 4 | 2 | 5 | 2 | 4 | 3 | 2 |
| 18. RM | 6 | 5 | 5 | 3 | 4 | 2 | 3 | 6 | 5 | 6 | 5 | 7 | 6 | 2 |
| 19. LMI | 7 | 3 | 5 | 4 | 2 | 3 | 5 | 5 | 4 | 2 | 2 | 3 | 4 | 1 |
| 20. EFJ | 5 | 5 | 3 | 4 | 4 | 4 | 3 | 3 | 4 | 6 | 4 | 4 | 4 | 4 |
| 21. CT | 4 | 3 | 2 | 4 | 6 | 4 | 1 | 2 | 5 | 3 | 4 | 4 | 5 | 2 |
| 22. OM | 4 | 3 | 3 | 4 | 5 | 4 | 2 | 3 | 5 | 3 | 3 | 4 | 5 | 1 |
| 23. DL | 6 | 5 | 4 | 6 | 7 | 6 | 6 | 3 | 5 | 5 | 6 | 6 | 6 | 4 |
| 24. LM | 5 | 3 | 2 | 5 | 6 | 4 | 1 | 2 | 5 | 2 | 4 | 4 | 5 | 2 |
| 25. CR | 4 | 6 | 3 | 4 | 2 | 2 | 3 | 4 | 1 | 2 | 1 | 1 | 3 | 1 |
| 26. M | 5 | 5 | 5 | 5 | 5 | 5 | 4 | 5 | 3 | 4 | 6 | 5 | 6 | 3 |
| 27. CWF | 5 | 5 | 3 | 4 | 6 | 3 | 3 | 4 | 6 | 4 | 4 | 6 | 4 | 2 |
| 28. EL | 5 | 5 | 4 | 3 | 6 | 3 | 3 | 3 | 4 | 4 | 4 | 5 | 3 | 2 |
| Cumulative Average | 4.9 | 3.8 | 3.4 | 4 | 4.9 | 3.8 | 4 | 3.8 | 4.4 | 4.1 | 3.8 | 4.6 | 4.2 | 2.6 |
Answer:
1 Very Poor
2 Poor
3 Fair
4 Acceptable
5 Good
6 Very Good
7 Excellent
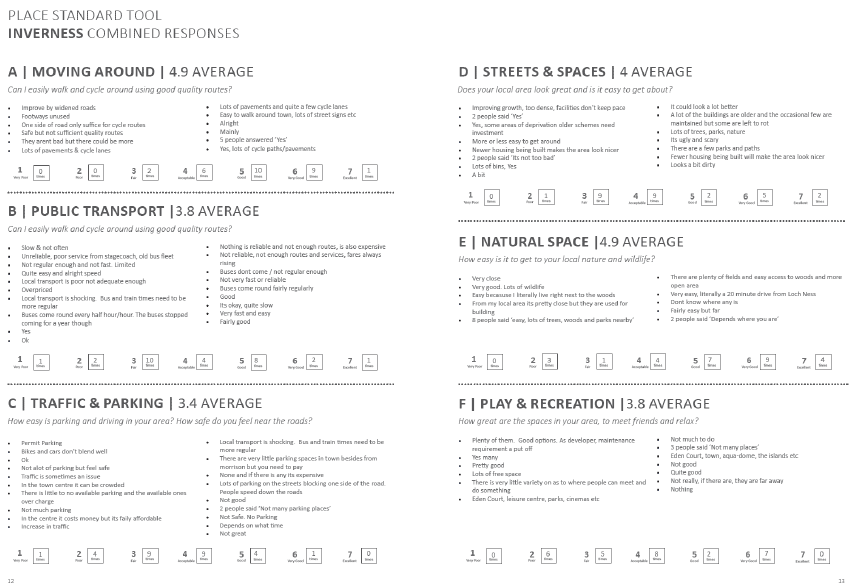
Figure description:
This figure provides an example of Place Standard Analysis from Inverness, summarising quantitative and qualitative responses by participants from Inverness for some of the place standard categories.
The analysis example presented in Figures 22a-c shows the average responses in relation to Inverness. The most liked aspects of Inverness were 'Moving Around' (access for walking and to cycle routes) and 'Natural Space', both achieving an overall score of 4.9 out of 7.0. Participants said things like "there are lots of good pavements and quite a few cycle lanes" and "there are plenty of fields and easy access to woods and more open areas". Influence and sense of control was by far the lowest category in Inverness with 2.6 out of 7.0. One participant said "I don't get much say in anything that happens".
The results of the Place Standard assessment are not capable of generalisation either nationally or within regional categories like the Challenges tool, however the results in each location illustrate very clearly how the issues addressed by the tool are assessed positively or negatively by the local population. It would be too much detail for this report to present results and analysis for each local area in this regard. For this reason an additional addendum to this report has been created by Collective Architecture titled, 'Present Voices Future Lives' - Housing to 2040: Place Standard Report'. All of the individual locations analysis can be found in this document.
By looking at all of the place specific assessments we were able to ascertain if there were any issues which commonly presented as low or high across all locations, the following was observed:
| Location | High Rated Categories | Low Rated Categories |
|---|---|---|
| Inverness | Moving around, Natural space, Feeling Safe | Influence & Sense of Control |
| Ullapool | Natural Space, Feeling Safe | Streets & Spaces, Traffic & Parking |
| Kirkwall | Natural Space, Feeling Safe | Influence & Sense of Control, Public transport |
| Fort William | Feeling safe, Play & Recreation, Identity & Belonging | Work & Economy, Traffic & parking, Streets & spaces |
| Dundee | Feeling safe, Play & Recreation | Moving around, Care & Maintenance |
| Peterhead | Moving around, Traffic and Parking | Influence and Sense of Control |
| Irvine | Moving around | Influence and Sense of Control, Traffic & parking, Care & Maintenance |
| Glasgow | Moving around, Work & Economy | Traffic & Parking |
| Portree | Feeling Safe | Work & Economy, Public Transport |
| Bute | Moving around, Identity & belonging, Natural Space | Work & Economy, Care & Maintenance, Traffic & parking |
| Edinburgh | Moving around, Public transport | Play & recreation |
| Galashiels | Public transport, Natural space, Facilities & amenities | Influence and sense of control |
As the Place Standard is intended to be a place-specific tool it does not make sense to average outcomes across all locations. However, it can be seen from Table 6 above that some categories rate consistently high and some consistently low across all locations. Consistently high categories were 'Moving Around' (6), 'Natural Space' (5) and 'Feeling Safe' (4). Consistently low were 'Influence & Sense of Control' and 'Traffic and Parking' both with 5.
The Place Standard - Discussion
The Place Standard is a tool that is used to assess the quality of a place. It can assess places that are well established, undergoing change, or still being planned. It is used to maximise the potential of the physical and social environment to support health, well-being and a high quality of life.
During the consultation across all 12 locations the Place Standard Tool was used to identify the needs and assets of each place and is used to provide a sense of empowerment to the local community, allowing for everyone's views and opinions to be counted.
300 Place Standard Tools were received and their scores combined to provide an average result for the consultation. The results, an average and the participants' statistics are presented for each individual place in an additional addendum to this report - 'Present Voices Future Lives' - Housing to 2040: Place Standard Report.
As can be seen in Table 6 in some categories rated consistently high across many locations, namely, Moving around (6), Feeling safe (6) and Natural space (5). Categories which scores consistently low across locations were Traffic and Parking (5) and Influence & Sense of control (5). Work and economy was scored low across three locations.
5.6 Workshop 5 – Community Mapping
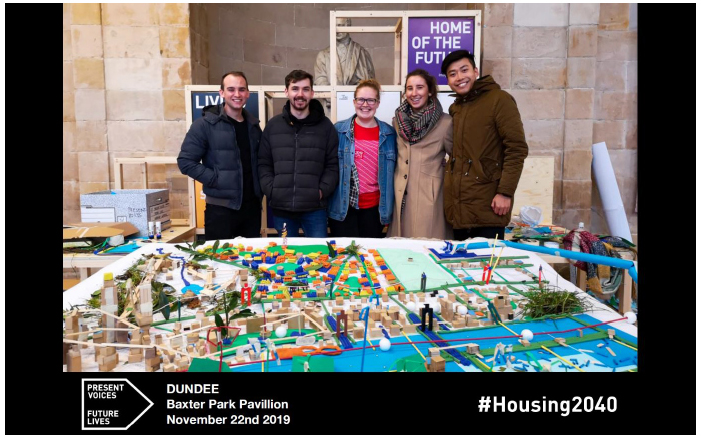
Figure description:
A photo of the Dundee Community Map produced with students from Dundee University. A group of five students is posing of the photograph behind the community map.
The mapping exercise appeared to be enthusiastically carried out by all who took part with some incredibly inventive and creative solutions to local issues proposed.
Maps were specific to each location, however they became a fertile tool for the opportunity to express the concerns framed most particularly in the challenges workshop. So the key concerns of environment, well-being, healthy places and work were all expressed in a place specific way through each models interventions.
There were consistent examples of the following:
- the greening of urban spaces;
- green roof and networks of green roofs in town centres;
- collective housing developments;
- flood management systems both in relation to larger existing bodies of water; and
- new forms of sustainable urban drainage.
We consistently saw the densification of town centre places with more housing and a diversity of different land uses. Mapping also focused on the pedestrianisation of vehicular routes in town centres, green corridors to enhance biodiversity, new innovative ways of getting around, including water taxis and electric trams.
See below for examples of community maps. Examples of all maps produced can be found in the 'Present Voices Future Lives' Photo Presentation pdf (archived in the Project Digital Archive).
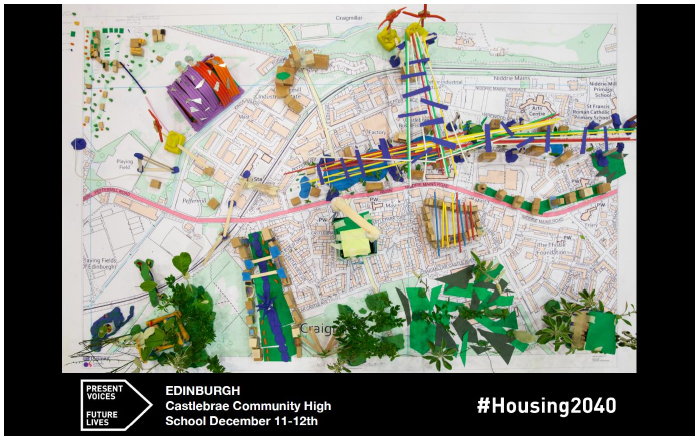
Figure description:
A photo of the Edinburgh Community map which was produced by pupils from Castlebrae High School.
5.7 'Present Voices Future Lives' Films
The films created for 'Present Voices Future Lives' involved people within each community interested in sharing their lived experience and views on housing, communities and homes. The voices captured through the films reflect on the range of issues found in local communities across Scotland.
The interview at each location provided by a carefully selected participant from the community with the opportunity to highlight and discuss housing issues relevant to their local area. Participants were generally selected for having an active involvement in their community or for highlighting or reflecting on key issues within it.
The most common topic of discussion was the need for more community led and affordable forms of housing. This point was highlighted in most locations, including cities, towns, rural and island communities. This was supported by the need for new housing developments to have the required infrastructure and the need for community involvement in taking design decisions. The Housing to 2040 draft vision and principles states:
"The housing system should supply high-quality affordable homes for living in, to shift the balance away from the use of homes as a means to store wealth".
Another clear aspiration in the draft vision and principles is for people to be involved in decisions about their communities:
"My local council and developers listen to me and my community. They pay attention to what we want and what makes my community special. We have the right infrastructure in place for new homes and we are well-connected".
These statements from the Housing to 2040 draft vision and principles are found to be supported by people's experience and aspirations in the interviews.
Sustainability was one issue which came up in more than one location. Island and rural communities, identified problems with the availability of permanent jobs, which leads to depopulation (especially of young people), increased ageing population and the amount of local housing stock held as second homes or short term lets by investors from outside the local community. In our wider discussions with younger participants in Rothesay only 10 out of 42 young people told us they wanted to remain in the community upon leaving school. Rural and island communities are addressed directly in the Housing to 2040 draft vision with a recognition of the need for:
"good housing options for everyone here, from farmers and crofters to young people and those seeking to move to the area to set up home and bring employment and new opportunities to the area."
The draft vision and principles also highlight the need for communities to have a say in how homes are used in their area, including the number of second homes.
Participants in rural places generally highlighted the need for more amenities in rural towns, particularly for young people. The need to be more energy efficient and sustainable in the way we build and maintain our housing stock was another point regularly raised. In some cases the fear of climate change was palpable especially in remote coastal communities such as those on the Orkney islands.
Wealth disparity and its effect on communities and the public realm was highlighted in in more urban locations such as Dundee, Peterhead and Glasgow. Glasgow's participant talked of how uneven the recent growth in the city had been, characterised by the difference between shining, new developments on the Clyde Riverside and the neglect of working class areas in Parkhead and Shettleston.
One particular issue raised in Edinburgh by our participant who was visually impaired, having had full sight in her younger life, was the need for houses which can adapt and change with their occupants over the course of a lifetime. She commented on how housing has been standardised based on non-disabled people and highlights the importance to design with people's changing needs in mind.
A summary of the interview content in each location follows:
Inverness
- Access to natural space a positive feature of living in Inverness.
- The importance of community greenspace initiatives, including household allotments.
- As Inverness continues to grow that it does so with appropriate infrastructure and services not just housing.
- The importance of the Housing to 2040 engagement for giving people a say on the future of their communities.
Ullapool
- The importance of energy efficient and well-designed housing.
- Opportunities for local, community based social enterprise to attract young people to stay in their communities.
Kirkwall
- Orkney has a lack of suitable new housing and existing accommodation to attract skilled people into the community to allow it to grow.
- Concern about climate change and particularly rising sea levels and the potential loss of historic monuments and sites of national significance.
- The power of the sense of community in Orkney and its ability to attract young people to return after spending time away at university or working elsewhere.
Irvine
- Irvine's dual existence as a historic market town originating in the 12th/ 13th centuries and its status as a 20th century Scottish New Town.
- Praise for the bold vision of planners and architects who created Irvine New Town and a recognition of some of the New Town's successes rather than the problems, which are more often highlighted.
Peterhead
- Wealth disparity in Peterhead is quite striking.
- The importance of the care and maintenance of the public realm and scenic areas and the potential for community based initiatives to deal with this.
- The need to build more social and community based housing to attract more young people to the area, including those who have left to study or find a job elsewhere, rather than just commuter housing on the outskirts for people working in Aberdeen.
- The need for more community empowerment.
Dundee:
- The difficulty of achieving sustainability in cities with lots of people.
- The importance of good public transport to stop people using cars. Disparities of wealth in Dundee and the need for more affordable housing.
- A great deal of building stock is lying empty and could be re-purposed. There is too much homelessness.
- Government needs to be more pro-active on the climate crisis, we need to act together now on climate change not just set future targets which will probably not be realised.
Fort William
- The beauty of Fort William's natural surroundings. Ideal place to grow up.
- Need for more entertainment and amenities especially for young people and the importance of attracting new people through job opportunities and good housing.
Galashiels
- More facilities and amenities required especially for younger people.
- Benefit of living in a small town is that there is more community spirit and neighbourliness.
Rothesay
- Historically the island of Bute was a popular Scottish holiday destination.
- Recently it has suffered from continued depopulation and now has an ageing population with a great deal of its population over 60 years of age.
- Many young people and young families have left the island.
- Bute still has a seasonal economy but there is a need for more permanent forms of work on the island.
- A lot of tenements are old and unpopular, there is a need for more affordable family housing to attract younger people.
- A lot of recent investment has been made in Bute and the island has a new community of Syrian refugees.
- Affordable housing for local populations is a big issue across all of the Scottish islands because in these communities so much of the housing, (sometimes as much as 40%) is owned by people as 2nd homes or short term lets and are empty for much of the year.
- Young people cannot find housing and so they leave.
Edinburgh
- The importance of housing to be able to adapt and change with peoples changing lives and circumstances, particularly as they grow older and potentially encounter mobility issues.
- Need for more affordable housing within communities in Edinburgh.
Skye
- Key issues are the amount of housing being used as luxury 2nd homes by affluent people, ageing demographics and the difficulty of retaining young people in the community. 30% of all properties on Skye are short term lets.
- There are not enough people on the island to service the enormous tourist seasonal economy.
- Rural Design (a local architectural practice) are looking at releasing low-cost land for more affordable housing and housing prefabrication. The prefabrication is done locally and creates jobs within the local economy.
Glasgow
- Great wealth disparity in different areas of Glasgow. The poorer areas are characterized by a feeling of neglect of the existing building stock.
- Itinerant forms of living highlighted (show-people living in caravans on brownfield sites in the inner city).
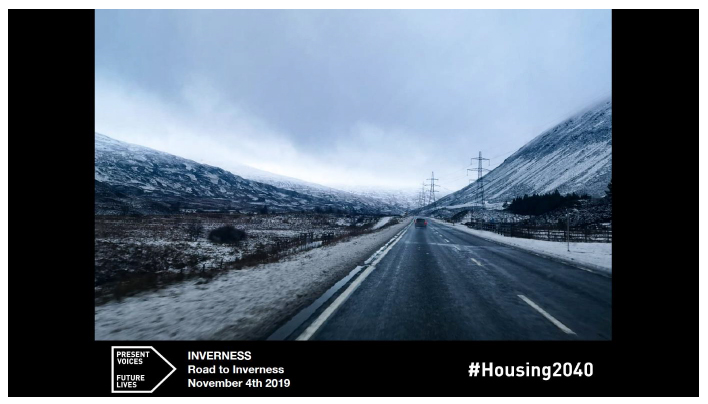
Figure description:
An example of a photograph from the ‘Present Voices, Future Lives’ Photographic Exhibition. The photo captures a road in a hilly rural area in winter.
5.8 Feedback Summary
A feedback form was created by the 'Present Voices Future Lives' team to invite general feedback from participants and attendees of their experience of the exhibition / workshops whilst on tour. This form was available both during the daytime workshops and the evening exhibition. Unfortunately this form was not well engaged with by the public who preferred to complete the How we Live and Challenges questionnaires. Having completed that task most people simply declined the opportunity to complete a further questionnaire. An example of a completed feedback form can be seen in Appendix 7.11.
Verbal feedback on the exhibition and workshops was positive. Everyone who took part appeared to enjoy the events and valued the opportunity to contribute.
'Present Voices Future Lives' has since received offers to exhibit and run workshops from other bodies. Some of the work was presented through an online 'Smart Places' Panel Discussion on 26th June 2020: Smart Places Series. The 'Smart Places' theme is currently being developed in partnership between the Edinburgh Futures Institute (EFI), the Data-Driven Innovation programme (DDI) and Edinburgh Living Lab. 'Smart Places' is a broad theme that generally aligns to the concept of place-making and emphasises active citizen engagement and participation alongside new uses of data and technology to improve places for people. Hopefully similar invitations will follow allowing the project a continued legacy.
Contact
Email: Housing2040@gov.scot