Planning Performance Statistics 2020/21: Quarterly (October 2020 To March 2021)
This report presents summary statistics on planning application decision-making timescales for October 2020 to March 2021, as well as historic data back to 2016/17. It is based on data collected from Local and Planning Authorities as part of the Planning Performance Framework (introduced in 2012).
Part of
Applications for Local Developments (excludes legacy cases)
There were 13,547 decisions on local developments in the final six months of 2020/21, 833 more than the same period in the previous year. The average decision time for the 12,279 of these which were not subject to processing agreements was 10.0 weeks, just under a week slower than the corresponding time of 9.2 weeks for the final six months of 2019/20.
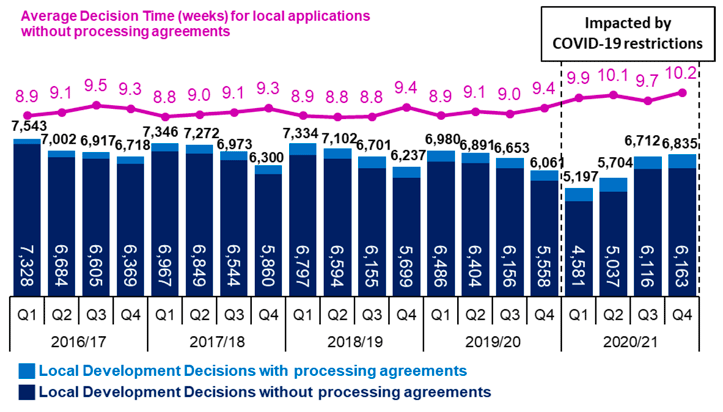
In quarter three of 2020/21 there were 596 local development applications with processing agreements, 74.3% (443) met agreed timescales that had been set between developers and local authorities. In quarter four there were 672, 72.8% (489) meeting the agreed timescales.
Contact
Email: Planning_Stats@gov.scot