Physical intervention in schools guidance: consultation analysis

An analysis report of the responses to the consultation on draft physical intervention in schools guidance.


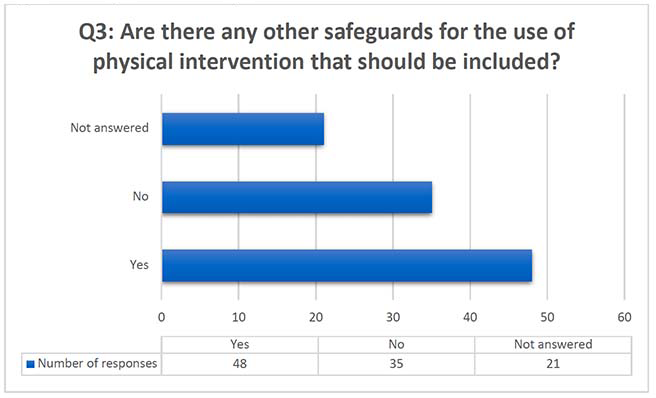
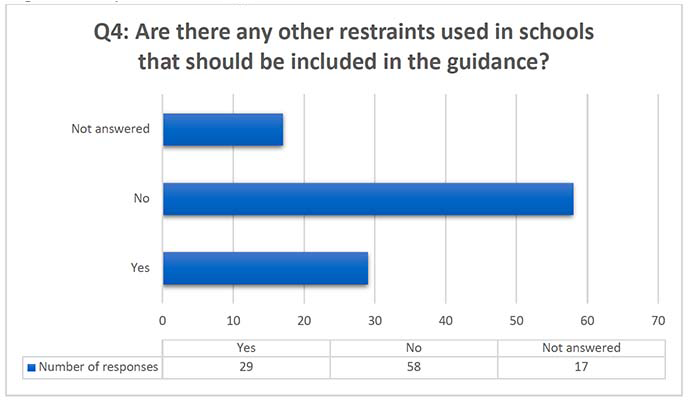
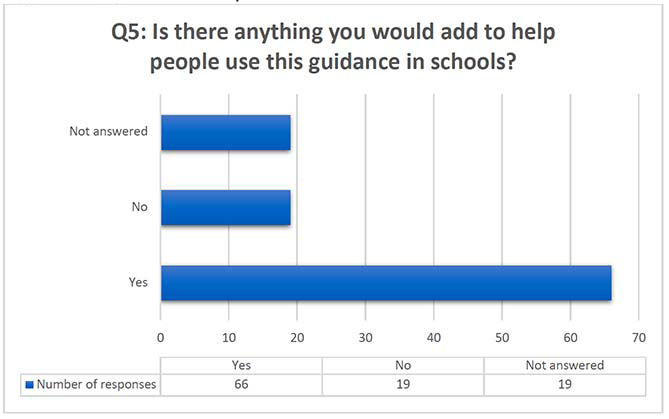
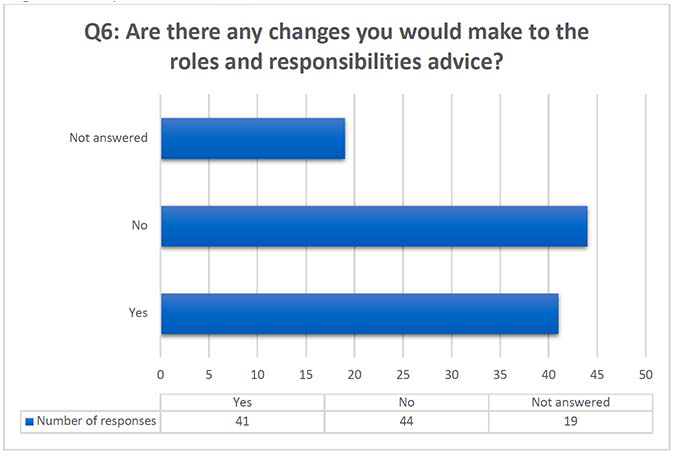
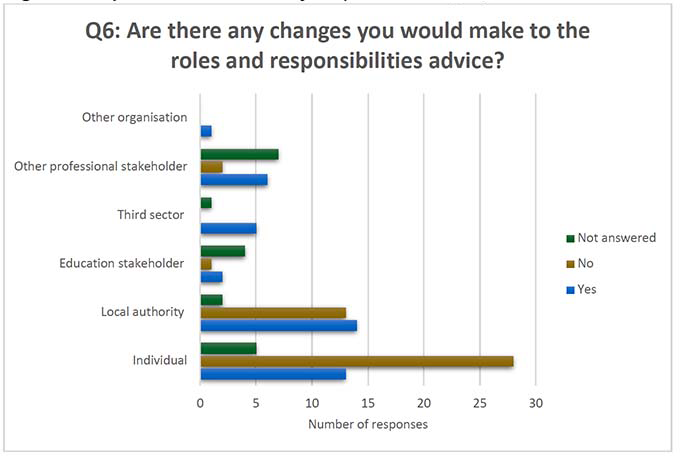
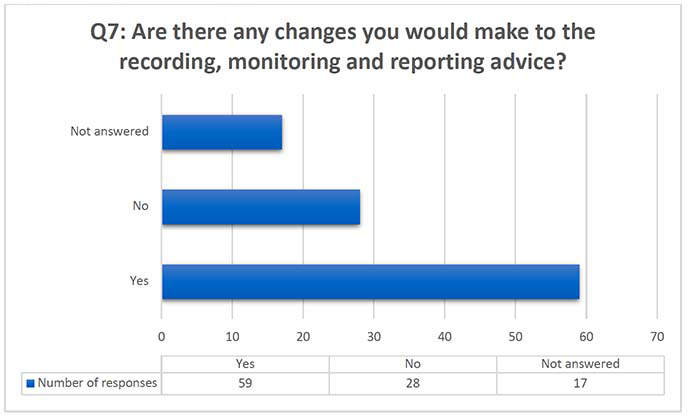
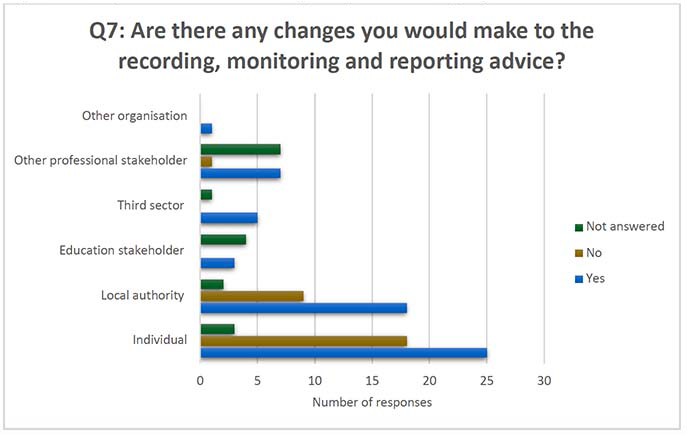
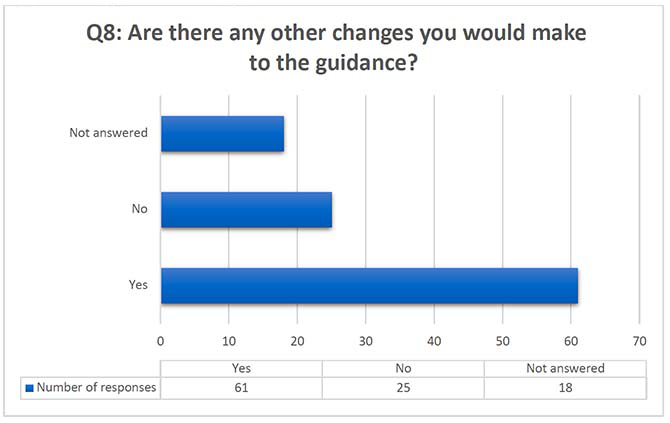
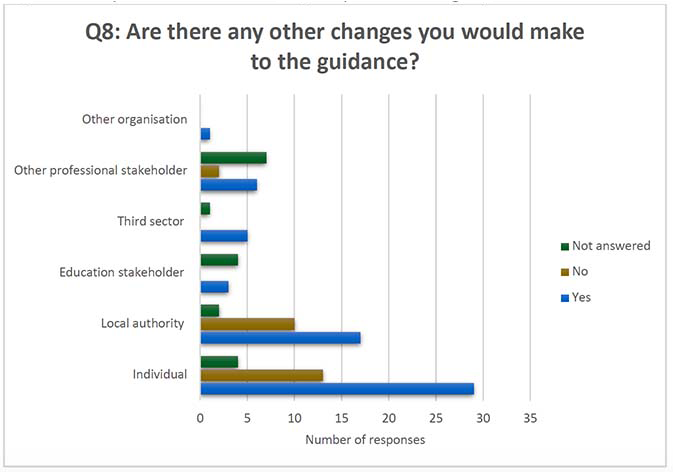
Annex B: Quantitative analysis data charts

This section displays the quantitative analysis of the questions which required a “tick box” only response.

Across the 8 questions, a total of 687 responses (from a potential total of 832) answered the closed questions. This represents a response rate of 83%.

Figure 1.1: Question 1 responses
Figure 1.2: Question 1 answers by responder category
Figure 2.1: Question 2 responses
Figure 2.2: Question 2 answers by responder category
Figure 3.1: Question 3 responses
Figure 3.2: Question 3 answers by responder category
Figure 4.1: Question 4 responses
Figure 4.2: Question 4 answers by responder category
Figure 5.1: Question 5 responses
Figure 5.2: Question 5 answers by responder category
Figure 6.1: Question 6 responses
Figure 6.2: Question 6 answers by responder category
Figure 7.1: Question 7 responses
Figure 7.2: Question 7 answers by responder category
Figure 8.1: Question 8 responses
Figure 8.2: Question 8 answers by responder category

Contact

Email: supportinglearners@gov.scot

Back to top