Pesticide Usage in Scotland: Rodenticides on Grassland and Fodder Farms 2021
This report presents the results of a survey of rodenticide use on grassland and fodder farms in Scotland in 2021.
Part of
Appendix 4: Survey methodology
Sampling and data collection
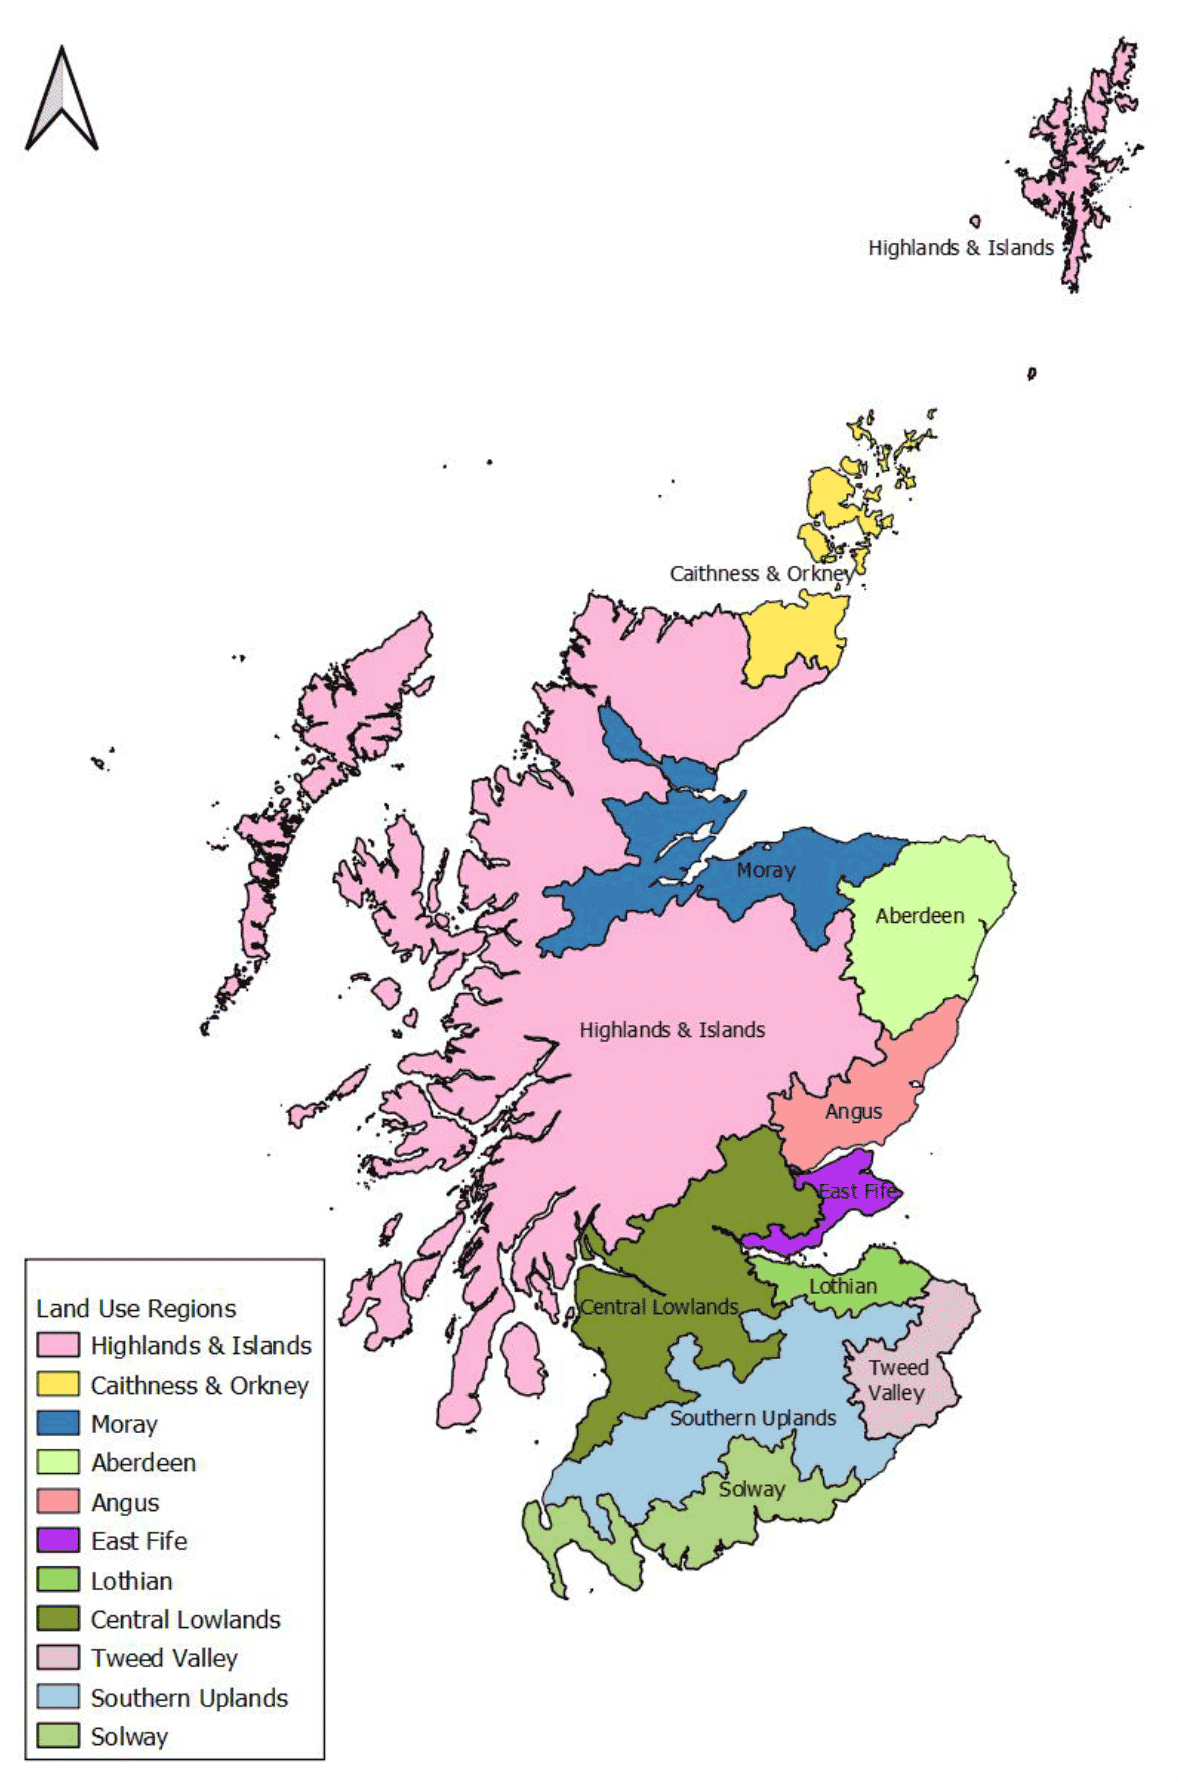
Using the June 2021 Agricultural Census(11) two samples were selected, one taken from holdings with grassland, the second from holdings growing fodder crops. For the purpose of sampling, the country was divided into 11 land-use regions(12) (Figure 11) and five size groups. The size groups were different for grassland and fodder crops (Table 7 & 9 respectively) and were based on the total areas of crops grown on the holding. Holdings were chosen at random within each of these strata, with the number of holdings selected being proportional to the total area of crops grown. Sample size groups were based on crop area rather than number of holdings, so that smaller holdings did not dominate. This stratification was designed to take into account differences in rodenticide use in relation to geography and farm size when making estimates of national use.
The survey covered rodenticide use during the 12 month period January to December 2021. Following an introductory letter, data was gathered from farms growing fodder crops by telephone interview or email. For the grassland survey a postal questionnaire was sent out which farmers completed and returned, followed up with a phone call where necessary. When rodenticides were applied by a pest control professional (PCP) and data were not available from the farmer the information was obtained directly from the contractor. If it was recorded that rodenticides were used but product data were not obtainable from either the farmer or PCP this was recorded as unspecified rodenticide use.
In total, information was collected from 601 holdings (Table 12 & 13). These holdings represent seven per cent of the 2021 Scottish fodder crop holdings (Table 8) and one per cent of the grassland holdings (Table 6). The data collected were; rodenticide user, product(s) used, bait type, weight applied, target and season of use. Information about use of non-chemical rodent control methods was also recorded.
All farmers and PCPs encountered in the survey were also asked to respond to a simple questionnaire containing questions relating to whether they had received training in use of rodenticides, their self-reported compliance with best use practice for rodenticides and their knowledge of rodenticide stewardship. Farmers were also asked to provide operation details about their farm, such as whether they kept livestock or had a grain store, to allow comparison in farm operation in relation to whether they used rodenticides.
It should be noted that, in relation to all data collected, responses are as reported by the rodenticide users and no attempt has been made to check their accuracy.
Estimation of national rodenticide use
The figures presented in this report are produced by surveying a sample of holdings rather than conducting a census of all the holdings in Scotland. Therefore, the figures are estimates of total rodenticide use for Scotland and should not be interpreted as exact.
National rodenticide use (holdings using rodenticides, rodenticide occurrence and weight) was estimated from the sample data by ratio raising. This is a standard statistical technique for producing estimates from a sample. This method involves multiplying the sample data by a factor dependent on the number of farms within each region and size group to match the data recorded in the relevant June Agricultural Census for grassland and fodder crops. Due to small sample sizes the data from some regions were merged and a secondary adjustment factor was applied to the raising factors to account for region and size groups for which no holdings were sampled. Details of regions, size groups, raising and adjustment factors are presented in Tables 10 and 11.
The remainder of the data (use of non-chemical control methods, details of farm operation, compliance with best practice and knowledge of rodenticide stewardship) are unraised and represent the information collected from the sample.
Changes from previous years
For the first time in this series of surveys, both farmers and PCPs were asked about the use of non-toxic indicator baits to monitor rodent activity. Use of these confirms rodent activity before baiting regimes are implemented and is good practice when using rodenticides. In addition, PCPs were asked if they had ever encountered or suspected resistance to rodenticides on farm and if they changed their method/type of control in response. PCPs were also asked about the types of traps they use. It is intended to also ask farmers these questions in future surveys.
Like the previous survey, some of the rodenticide data was collected via a postal questionnaire (grassland survey). Unfortunately, due to limited resource, it was not possible to follow-up with farmers if certain questions had been missed, this led to some partial data for the responses to some of the training and compliance questions. To take these unanswered questions into account, the percentage yes response was calculated on the number of respondents for each question rather than the overall number of survey respondents. This is why n (number of respondents) is variable in tables 3 and 5. Previously the yes response was calculated on the total sample number less the total blanks i.e. respondents who did not answer any question, partial blanks (which were minimal) were ignored. This should have minimal impact when making comparisons with the previous surveys.
In previous reports in this series (pre-2017), data about the type of rodenticide user (i.e. farmer or PCP) were based on the proportions encountered in the sample surveyed. Whilst this was made clear in the reports, it was in contrast to the weight and occurrence data presented, which were estimates of use in the total population of grassland and fodder farms. Due to database improvements, population estimates of user type were published in the 2017 report for both the 2017 and 2013 data sets. This has resulted in differences in 2013 user data presented in 2017 and 2021 and in the original 2013 report.
Statistical analyses
As estimates are based on a random stratified sample of farms in each survey year and individual farms may be sampled more than once in the time series, there is no simple method of statistical comparison for estimated rodenticide use on grass and fodder farms over time. However, the percentage of farms using rodenticides, the percentage of farms on which baiting was conducted by PCPs and the percentage occurrence of first and second generation compounds have been analysed using Pearson's chi-squared test. The percentage occurrence of first and second generation compounds was analysed using the number of holdings as a base. These conservative analyses do not take into account the stratification, finite population sampling or common farms between years and are therefore less likely to find significant differences. All significant differences are highlighted in the text and tables of this report.
Data quality assurance
The dataset undergoes several validation processes as follows; (i) checking for any obvious errors upon data receipt (ii) checking and identifying inconsistencies with use and pesticide approval conditions once entered into the database (iii) 100 per cent checking of data held in the database against the raw data. Where inconsistencies are found these are checked against the records and with the farmer if necessary. Additional quality assurance is provided by sending reports for independent review. In addition, the Scottish pesticide survey unit is accredited to ISO 9001:2015. All survey related processes are documented in Standard Operating Procedures (SOPs) and output is audited against these SOPs by internal auditors annually and by external auditors every three years.
Main sources of bias
These surveys may be subject to measurement bias as they are reliant on respondents recording data accurately. As surveys are not compulsory they may also be subject to non-response bias, as some farmers and PCPs may be more likely to respond than others. However, the use of a random stratified sample is an appropriate survey methodology and reserve lists of farms are held for each stratum to allow non-responding farms to be replaced with similar holdings.
Experience indicates that stratified random sampling, including reserves, coupled with personal interview technique, delivers the highest quality data and minimises non-response bias.
Contact
Email: psu@sasa.gov.scot