Pathways: A new approach for women in entrepreneurship
An independent review into women in entrepreneurship in Scotland, authored by Ana Stewart and Mark Logan. Based on thorough data analysis and stakeholder engagement the report's recommendations seek to address the root causes of female under-participation in entrepreneurship.
Appendix A: Summary of research into under-participation
In this appendix, we summarise the research approach taken in producing the report. We also provide key statistics, including those referenced elsewhere in the report.
Research Approach
This report was informed by a combination of research sources and approaches, which we can summarise as anecdotal and systematic.
Anecdotal Sources
We directly consulted with over 200 stakeholders from multiple areas of the entrepreneurial ecosystem, including the Scottish Government and its agencies, multiple action groups, investment firms, accelerator and incubator programmes, schools, colleges and universities.
We systematically surveyed female entrepreneurs (see Appendix E) and we further conducted focus groups with many female entrepreneurs, from all stages of the entrepreneurial journey. We also sought the views and perceptions of male entrepreneurs toward the focal areas of this report.
In preparing this report, we took into account the findings of prior notable reports into under-participation in entrepreneurship, including the Mastercard Index for Women in Enterprise[103], and the Alison Rose Review[104] as well as a range of academic papers, including those by Norin Arshed[105] and Sara Carter[106].
A full list of references are provided in Appendix F.
Summary of Statistics Relevant to the Report
Disaggregated data analysis for Scottish companies.
As was noted in Chapter 9, investigation into under-participation in entrepreneurship is hampered by a lack of systematic, comprehensive and reliable company data, disaggregated by gender and ethnicity. To address this deficiency, we engaged with the organisation, mnAi, with support from Prof. Eleanor Shaw, University of Strathclyde has constructed a detailed and dynamic directory of entrepreneurial activity across the Scotland, utilising over 10 billion datapoints. This model has been used as the basis for the analysis in this report. The data is current up to to 21st December 2022.
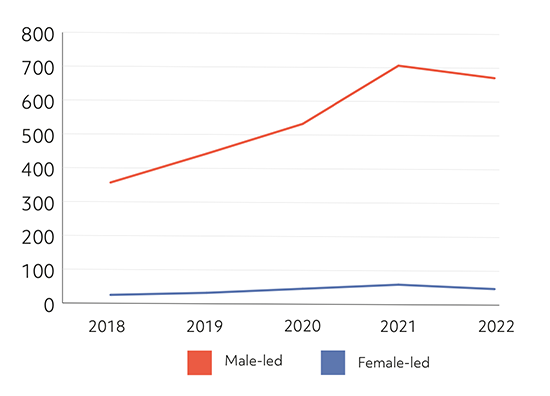
Company incorporations
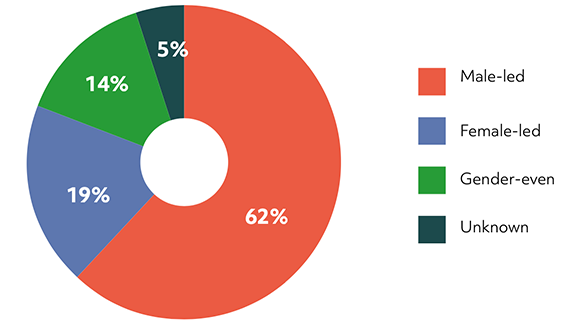
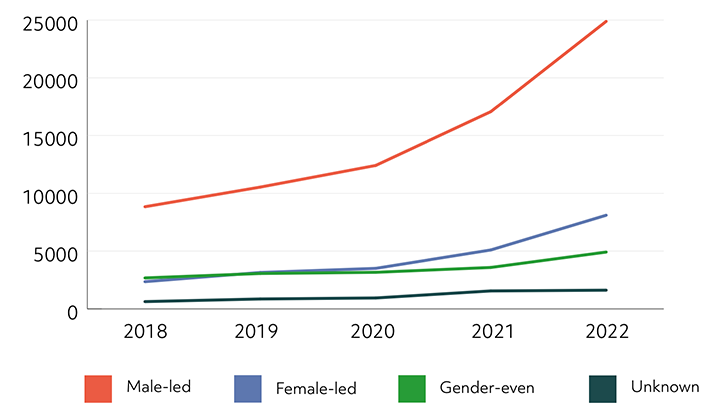
Headline figures on the number of female led[107] companies appear positive on first sight, with 8,103 new companies incorporated[108] in 2022[109]. However, this progress cannot be fully assessed without considering also the overall number of new companies – 39,258 in the same time period. Doing so shows that female-led companies account for 1 in 5 company incorporations.
While there has been welcome growth in the number of new female-led companies year on year, compared to the 2,359 incorporated in 2018, there still remains a clear and persistent gap when compared to the total number of company incorporations.
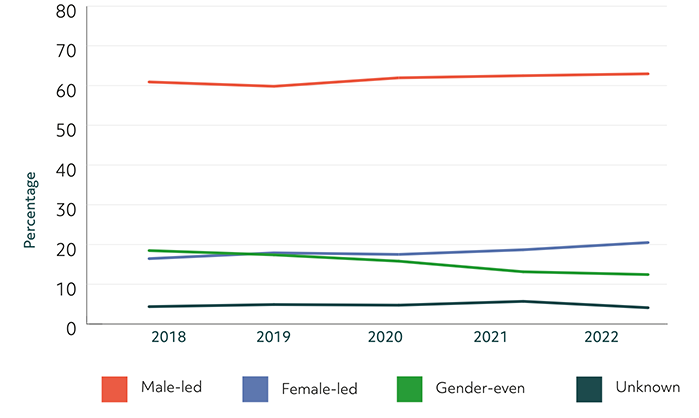
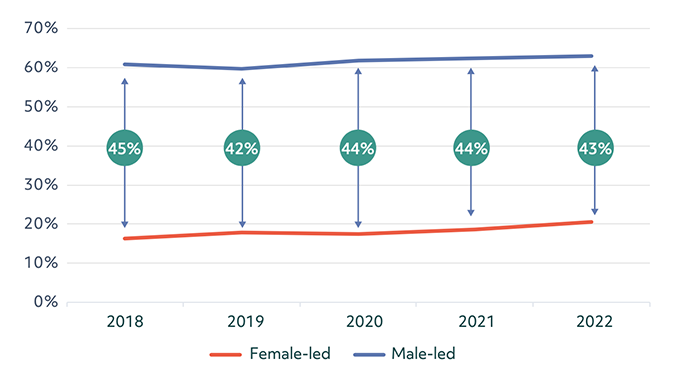
There has been no material change to the gender gap in the last 5 years with the gap between male and female led companies at 43% in 2022. There has also been a noticeable decrease in the share of companies started by 'gender-even' teams.
The Gender Gap
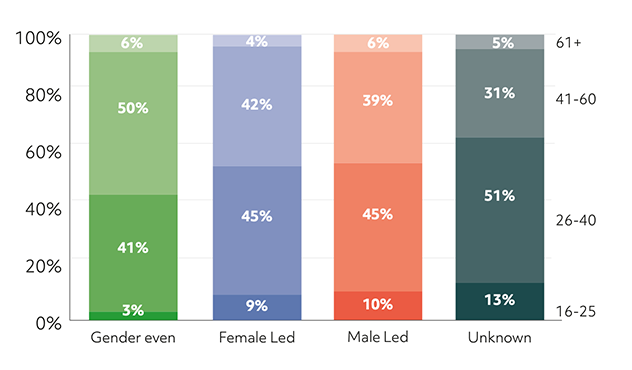
There are no clear differences in the ages at which women and men start their companies – with both groups most likely to start their company between the ages of 26-40, however women were marginally more likely to start a company between the age of 41-60.
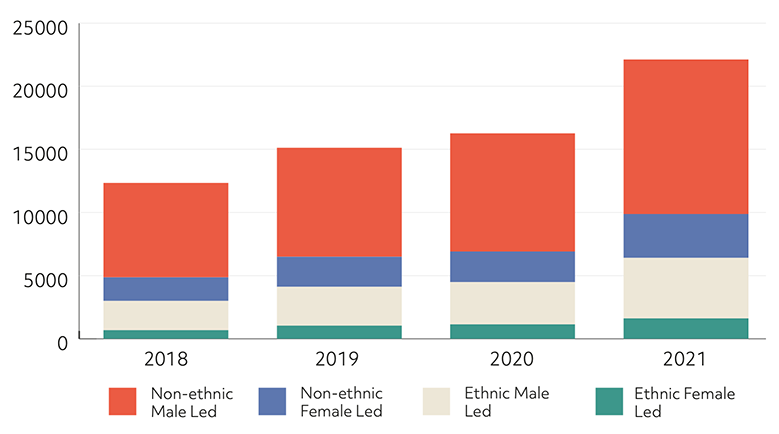
Looking at incorporations by ethnicity[110], we can see that over the 4 years to 2021, a gender gap is also present in ethnic minority company incorporations.
Further work is required to fully understand and interpret this data as it is a broad grouping and masks the experiences of different ethnic and cultural community groups.
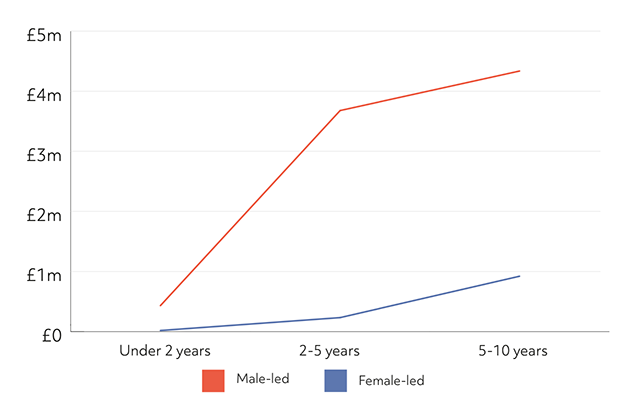
Growth
Data shows that female-led companies generate a lower turnover at all stages up to 10 years with data on company turnover by company age and gender indicating a slower rate of growth in female-led companies. These are average figures and are affected by company type, operating sector, access to investment, support networks, etc.
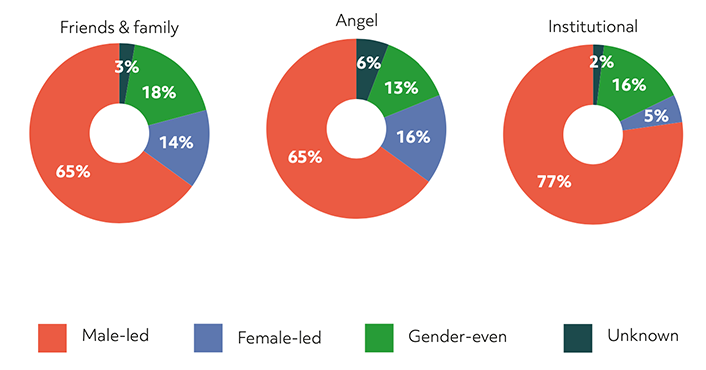
Investment
While female-led companies represent 19% of incorporations, we see female-led companies make up only:
- 14% of companies receiving 'friends & family' investment
- 16% of companies securing angel investment
- 5% of companies receiving institutional investment. (in comparison, male-led companies make up 77% of companies securing institutional investment.)
Looking across investments over the last 12 months, across all sectors female-led businesses made up 12% of companies receiving investment versus 73% being male-led businesses – a gender gap of 61 percentage
Over the past five years the gap between female and male-led companies securing institutional investment has widened.
When female-led companies do receive investment, they are securing, on average, a lower quantum. Over the last five years, excluding first round investments, the average value of female led investments was £833,754 per investment vs £3,219,146 for male-led investments.
Male-led companies secured four times the investment of female-led companies on a like-for-like basis.
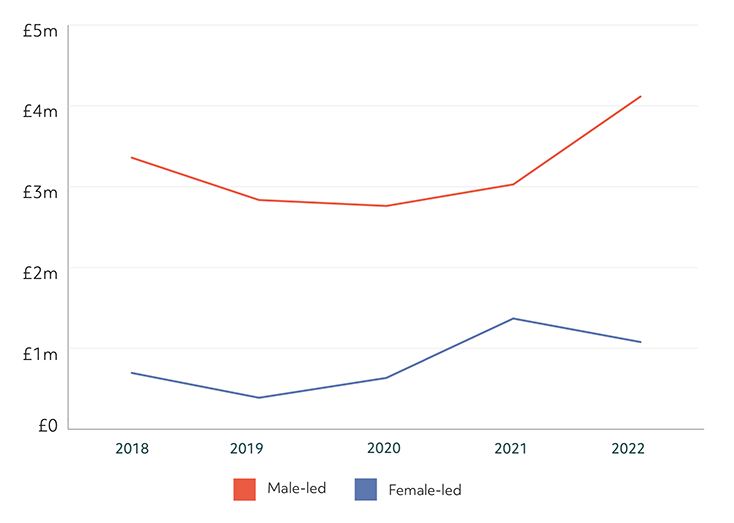
Data for 2022 shows the investment value gap widening after a recent period of improvement.
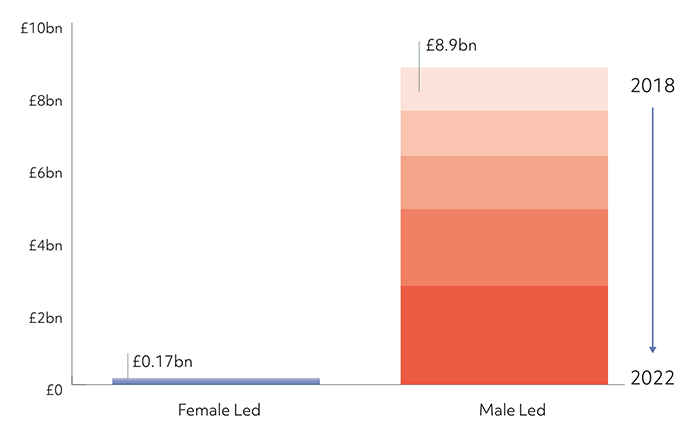
Looking at institutional investment over the last five years, an average of 2p in every £1 of institutional investment went to female-led companies. In 2022 this dropped to 1.5p in every £1.
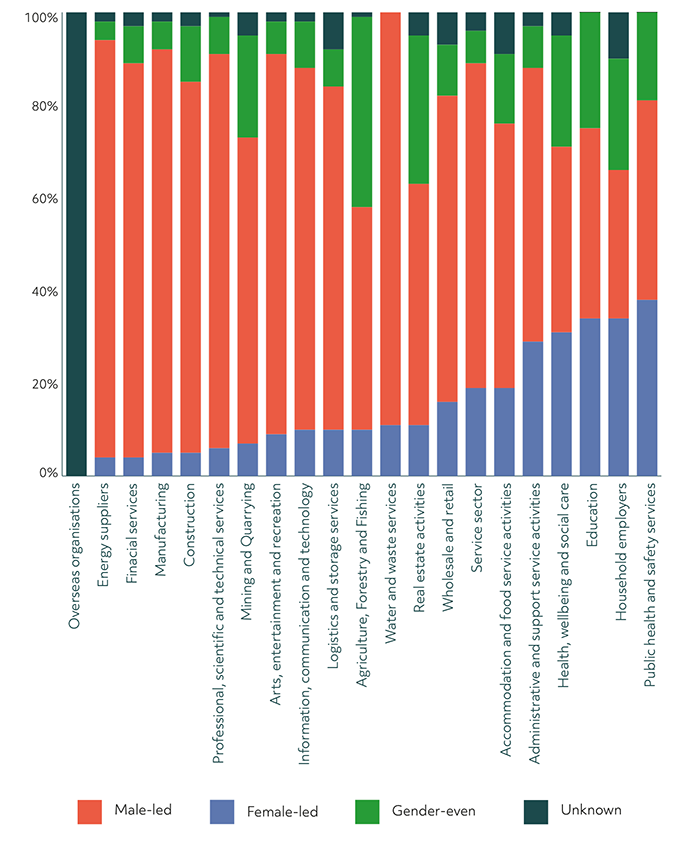
There are clear differences in the sectors favoured by male and female founders. Female-led companies made up 39% of incorporations in the Health Wellbeing & Social Care Sector over the last 5 years, in comparison to only 15% of incorporations in the Information, Communications & Technology sector, 10% in Financial Services and 5% in Mining and Quarrying.
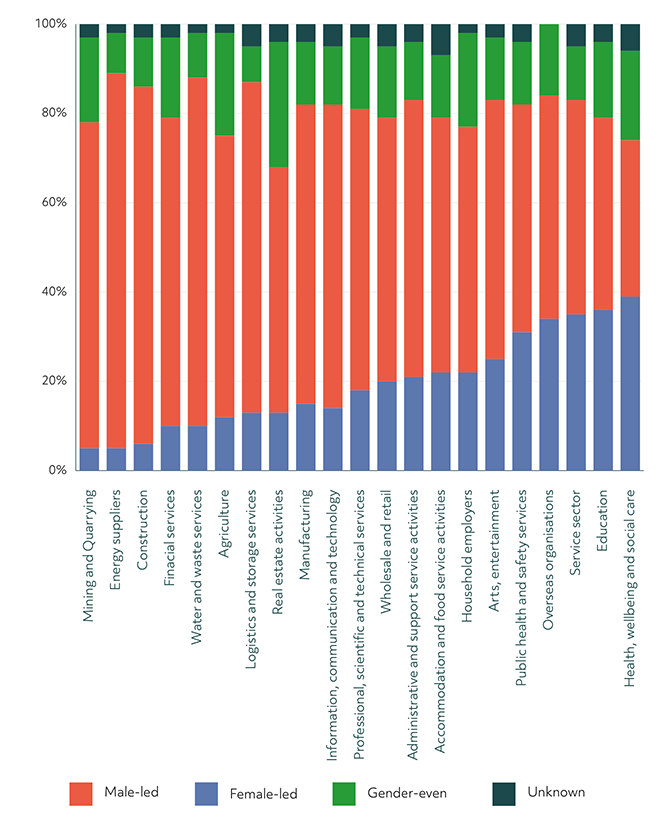
Women are receiving proportionally less investment across all sectors. Although 39% of companies in the Health, Wellbeing and Social Care sector are female-led, only 31% of companies receiving investment are female-led compared to 40% for their male-led counterparts. Similarly, in Information, Communication and Technology only 10% of those receiving investment are female-led.
Networks and Influence
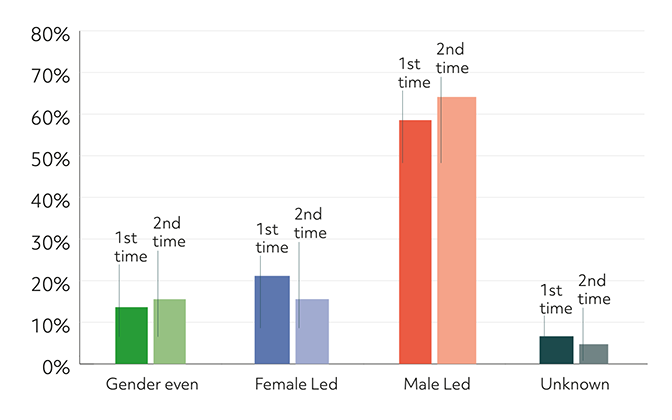
In absolute terms, as expected we see a drop in the numbers of directors taking on second or subsequent directorships. Where those second directorships happen they are far more likely to be in male-led companies with over 60% of second and subsequent directorships versus 15% in female-led companies.
Contact
Email: EIDEEBSPEnquires@gov.scot