Partnership Action for Continuing Employment: client experience survey 2020
This report provides key findings on the influence of the Scottish Government's initiative for responding to redundancy situations, Partnership Action for Continuing Employment (PACE).
3. Methodology
3.1 The 2020 Client Experience research incorporated two strands:
- A telephone survey of 736 new clients who have accessed PACE services since January 2018; and
- A follow-up survey of 300 individuals who took part in the previous wave of research in March 2018 (after accessing PACE services in the period April 2016 to January 2018).
3.2 Interviews were conducted by IFF Research using Computer Aided Telephone Interviewing (CATI) software. Fieldwork took place in February 2020.
3.3 The outline methodology for each of these strands is described below with further details on the profile of people interviewed in each strand.
New client survey
3.4 The 2020 survey methodology largely maintained continuity with the previous versions. A few changes were made to the questionnaire to reflect changes to PACE services and new questions were added to capture the following:
- Help with Pensions titled ‘PensionWise ’ was included in both the main and longitudinal surveys across all service-related questions.
- Past questions capturing whether participants had used support to assist them with online applications, satisfaction levels with this service and reasons for being dissatisfied were removed due to being less relevant to the research objectives and ensuring survey length met project guidelines.
3.5 Respondents from the survey came from a database of 5,500 PACE clients who were listed as having received PACE services in the period since January 2018.[9] Contact was attempted with all of these individuals to invite them to take part in a telephone interview. No quotas were applied to control the profile of respondents, as the priority was to conduct a census of the available contacts.
3.6 A screener was applied which excluded from the survey anybody who had not left the job which was selected for redundancy. This was found to be the case in just under four % of the starting sample. Further details on the breakdown of call outcomes can be seen in Table 3.1.
3.7 Interviews were completed with a total of 736 PACE clients, representing 60% of cases where contact was made with the named respondent. The survey lasted an average of 20 minutes.
| Sample outcome | n | Proportion of starting sample | Proportion of cases where contact made with eligible respondent |
|---|---|---|---|
| Base | (5504) | (5504) | (1219) |
| Ineligible or unavailable | |||
| Could not recall PACE service | 333 | 6% | n/a |
| Still in job selected for redundancy | 199 | 4% | n/a |
| Person not contactable on supplied number(s) during fieldwork period | 3,753 | 68% | n/a |
| Refusals | |||
| Refused to participate | 297 | 5% | 24% |
| Not available in fieldwork period | 156 | 3% | 13% |
| Respondent had poor grasp of English language | 30 | 1% | 2% |
| Completed | |||
| Completed interview | 736 | 13% | 60% |
Profile of new PACE clients surveyed
3.8 Table 3.2 on page 9 presents the demographic profile of clients taking part in the 2020 new client survey and draws comparisons to the demographic profiles of new clients in the previous survey in 2018. The 2020 new client respondents accessed PACE services from January 2018 onwards.
3.9 The profile of clients in 2020 is broadly similar to that in 2018: the majority of clients were male, older and identified themselves as White British. However, compared to 2018, there was an increase in the proportion of PACE clients aged under 30 taking part as well as an increase in the proportion of respondents in the lower socio-economic grades. There was also an increase in the proportion of female PACE clients. On the whole gender is unlikely to be driving significant differences in employment outcomes.
3.10 A third of all new clients in the 2020 survey were aged under 40 (33%, compared to only 27% in 2018), while around a fifth (22%) were aged 40 to 49 and over four in ten (43%) were aged 50+.
3.11 There was a greater proportion of female PACE clients in 2020 compared to 2018 (34% compared to 28%), while the proportion of male respondents decreased from 72% to 64%.
3.12 There was a greater proportion of PACE clients from lower socio-economic groups in 2020 compared to 2018: while the proportion of clients in A/B social group dropped by 15% to eight % and those in C1 went from 34% to 31%, the proportion in C2 increased significantly from 18% to 23% as did the proportion in group D/E (from 21% to 30%).
3.13 There was also a relatively large proportion of PACE clients (18%) who had been made redundant from the oil and gas sector in the 2018 survey, whereas very few of those taking part in the 2020 client experience survey had been made redundant from this sector (1%).
3.14 The vast majority of new clients (91%) described themselves as White British; a statistically consistent proportion with 2018 (89%).
3.15 The changes in the age, gender and socio-economic profile have been taken into account when comparisons are drawn between new client findings over time, and the report commentary highlights where significant differences occur between these sub-groups. On the whole, it seems that age of the client does have a substantial bearing on post-redundancy outcomes, as the research has previously identified.
| All 2018 survey respondents | All 2020 survey respondents | ||
|---|---|---|---|
| Base | (1,065) | (736) | |
| % | % | ||
| Gender | |||
| Male | 72 | 64 | |
| Female | 28 | 34 | |
| Prefer not to say/to self-describe | n/a | 2 | |
| Age | |||
| Under 40 | 27 | 33 | |
| 40 to 49 | 24 | 22 | |
| 50 plus | 47 | 43 | |
| Refused | 2 | 2 | |
| Ethnicity | |||
| White British | 89 | 91 | |
| Not White British | 8 | 6 | |
| Prefer not to say | 3 | 3 | |
| Socio-economic group | |||
| A/B | 15 | 8 | |
| C1 | 34 | 31 | |
| C2 | 18 | 23 | |
| D/E | 21 | 30 | |
| Unknown/refused | 11 | 8 | |
| Has disability | |||
| Yes* | 9 | 7 | |
| No | 89 | 91 | |
| Refused | 3 | 2 | |
| Served in UK Armed Forces | |||
| Yes | Not asked in 2018 | 5 | |
| No | 93 | ||
| Refused | 2 | ||
| Redundant from oil and gas sector | |||
| Yes | 18% | 1% | |
| No | 82% | 99% | |
*Question text was as follows: Do you have any long-term physical or mental impairment which limits your daily activities or the work you can do?
Note that figures may not sum to 100% due to rounding.
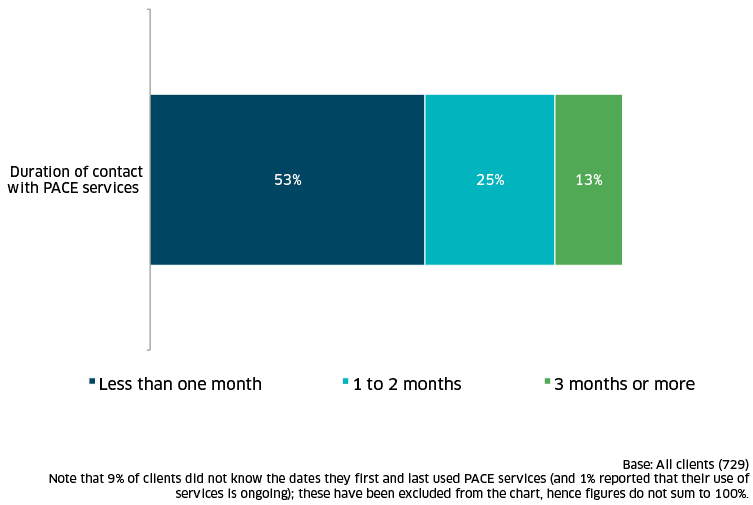
3.16 Figure 3.1 shows the duration of contact clients had with the PACE service. Around half (53%) of clients interacted with PACE services for less than one month, while a quarter used the services for between one and two months, and 13% used it for three months or more.
Longitudinal survey
3.17 The longitudinal strand of the research followed up with the 640 PACE clients who had taken part in the ‘new client’ survey in 2018 and had agreed to be contacted for further research. A census approach was attempted leading to a total of 300 interviews completed. This is equivalent to interviews being undertaken with around six in ten (57%) of cases where contact was made with the named respondent. Details of the outcomes for the whole starting sample are shown in Table 3.3.
| Sample outcome | n | Proportion of starting sample | Proportion of cases where contact made with eligible respondent |
|---|---|---|---|
| Base | (640) | (640) | (526) |
| N | % | % | |
| Ineligible or unavailable | |||
| Could not recall PACE service | 0 | 0% | n/a |
| Person not contactable on supplied number(s) during fieldwork period *11 | 114 | 18% | n/a |
| Refusals | |||
| Refused to participate | 147 | 23% | 28% |
| Not available in fieldwork period | 65 | 11% | 13% |
| Respondent had poor grasp of English language | 14 | 2% | 3% |
| Completed | |||
| Completed interview | 300 | 47% | 57% |
* 11: In most cases this relates to circumstances where there was no answer on the supplied telephone number even after 13 attempts. In others, it was clear that the named respondent was no longer available on that number.
3.18 The questionnaire for the 2020 longitudinal survey matched those used in previous iterations of the survey, collecting information on a range of labour market outcomes including:
- whether the individual secured work after being made redundant, and after how long;
- where the person secured paid work, whether this was at a higher or lower level of pay, responsibility and skills;
- whether the individual had sustained employment with the same employer, or maintained successful self-employment; and
- whether the individual engaged with any education and training since being made redundant.
Profile of PACE longitudinal clients surveyed
3.19 The longitudinal survey followed up individuals who took part in the 2018 survey. Table 3.4 on page 12 shows the profile by key factors for:
- all clients who were successfully followed up in the 2018 longitudinal survey (307 clients);
- all clients who were successfully followed up in the 2020 longitudinal survey (300 clients).
3.20 The profiles of the two samples are broadly similar, the only statistically significant difference being a higher proportion of clients in the C1 socio-economic grade group in the 2020 longitudinal sample (41% compared with 30%).
| All 2018 longitudinal survey respondents | All 2020 longitudinal survey respondents | |||
|---|---|---|---|---|
| Base | 307 | 300 | ||
| % | % | |||
| Gender | ||||
| Male | 72 | 73 | ||
| Female | 28 | 27 | ||
| Age | ||||
| Under 40 | 25 | 21 | ||
| 40 to 49 | 26 | 27 | ||
| 50 plus | 50 | 50 | ||
| Refused | - | 2 | ||
| Ethnicity | ||||
| White British | 90 | 91 | ||
| Not White British | 9 | 7 | ||
| Prefer not to say | 1 | 2 | ||
| Socio-economic group | ||||
| A/B | 21 | 16 | ||
| C1 | 30 | 41 | ||
| C2 | 13 | 18 | ||
| D/E | 31 | 19 | ||
| Unknown/refused | 5 | 7 | ||
| Has disability | ||||
| Yes* | 7 | 10 | ||
| No | 92 | 89 | ||
| Refused | 1 | 1 | ||
| Redundant from oil and gas sector | ||||
| Yes | 14 | 16 | ||
| No | 86 | 84 | ||
*Question: Do you have any long-term physical or mental impairment which limits your daily activities or the work you can do?
Note that figures may not sum to 100% due to rounding.
Contact
Email: margaret.sutor@gov.scot