
North Sea Horse Mackerel Fisheries Management Plan
The North Sea horse mackerel Fisheries Management Plan (FMP) is one of 43 FMPs set out in the Joint Fisheries Statement (JFS).This FMP sets out the policies and actions to manage the horse mackerel stocks at sustainable levels.
Background
Stock
Horse mackerel, also known as scad, comprise two stocks around the British Isles. These stocks reflect two genetically distinct populations, which are known to mix in the Channel and in the central North Sea. However, the extent of this genetic mixing is uncertain.
Adult horse mackerel are known to conduct extensive migrations among spawning, feeding and overwintering areas, but recent population-specific descriptions of these movements are lacking.
The main spawning grounds of horse mackerel around the British Isles are located in areas of the Celtic Sea and southern North Sea. Horse mackerel is a batch spawner, and females release 5-16 batches of eggs over a period of several months. Spawning activity in the Celtic Seas occurs during night-time from April to July with a peak in June. In the southern North Sea, spawning occurs from May to August.
Horse mackerel can grow up to 60 cm (total length) and live to 40 years of age, but they are more common observed in the size range of 15-40 cm and up to 15 years old. The species grows rapidly in its early years, with growth slowing markedly after age 3, when it reaches sexual maturity.
Location
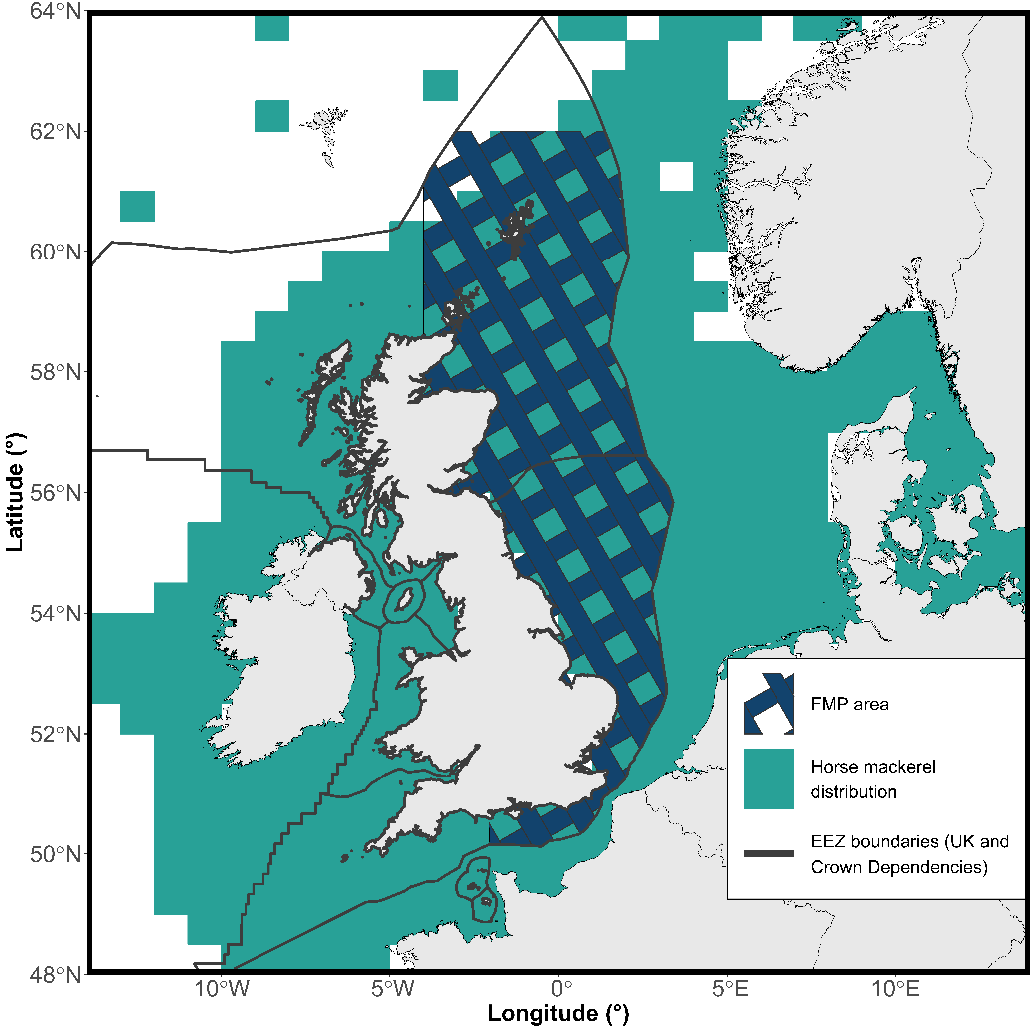
Horse mackerel is a widely distributed species which typically occurs on the continental shelves from Gulf of Guinea to the northern North Sea. Around the British Isles the species is found in the Celtic Seas, west of Scotland, in the Channel and across the North Sea. Horse mackerel live and feed both near the seafloor and in the water column, typically at depths between 100-200 metres, but individuals can be found as deep as 1,000 metres. During the winter and daytime, adults form large, dense shoals, close to the seabed.
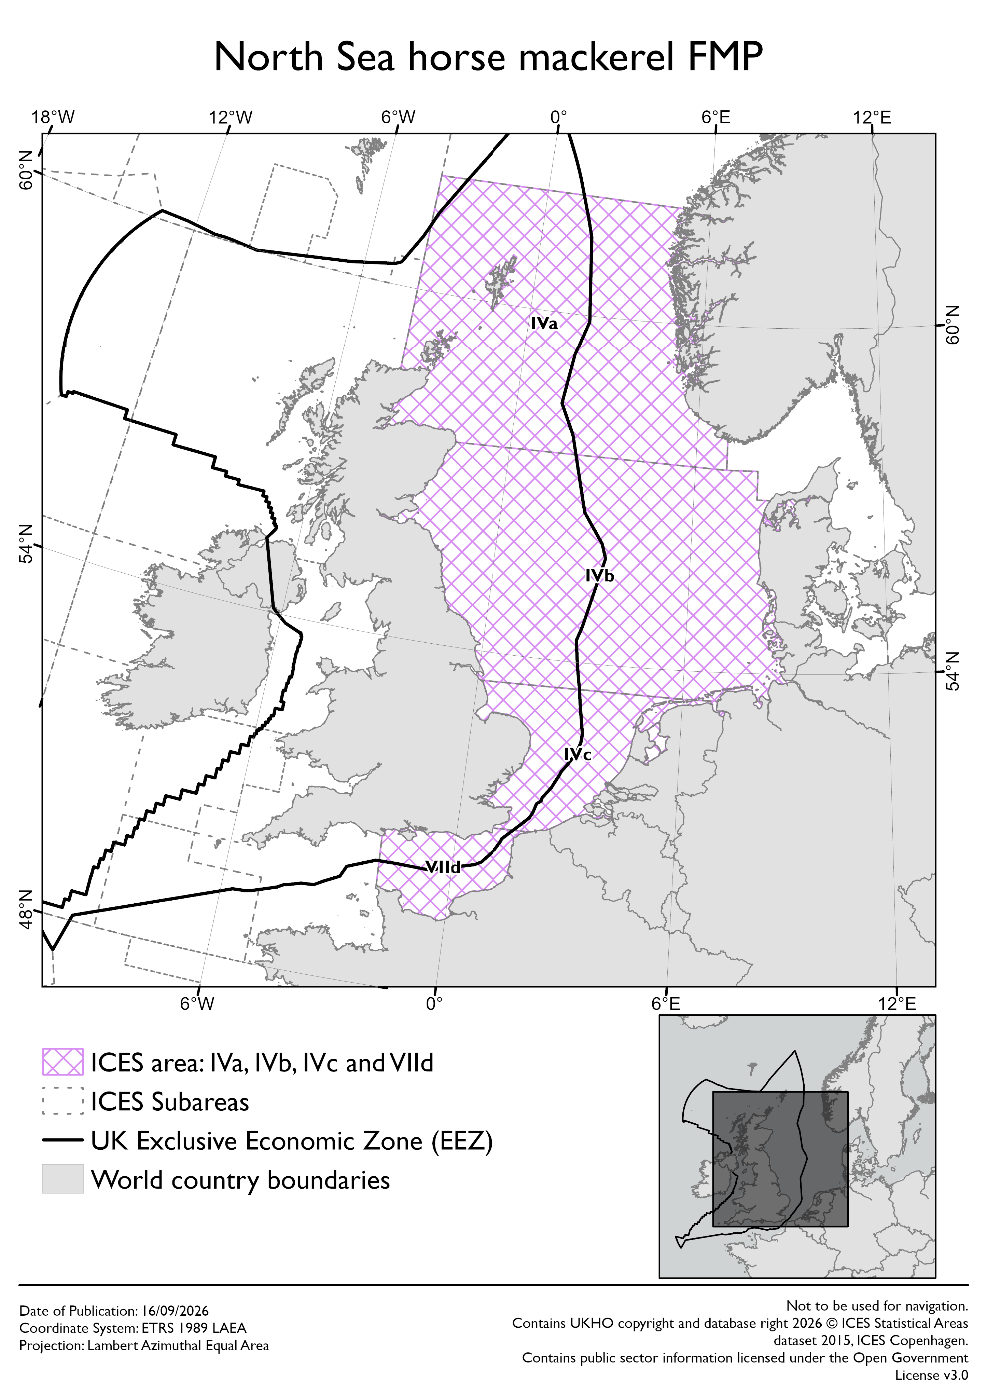
This FMP relates to fishing activity for horse mackerel in UK waters of the North Sea and eastern Channel (Figure 1). It covers part of the distribution area of the western stock (ICES Division 4a) and the southern and central North Sea stock (ICES divisions 4.b, 4.c, and 7.d).
Fishery
Analysis was undertaken of the UK fishing fleet catching horse mackerel in ICES subarea 4, and division 7.d. Between 2018 and 2024, an average of 76% of horse mackerel was caught in division 7.d and 22% was caught in division 4.c. 2% of horse mackerel was caught in 4.a, with less than 1% of horse mackerel caught in 4.b.
| Year | 2018 | 2019 | 2020 | 2021 | 2022 | 2023 | 2024 |
|---|---|---|---|---|---|---|---|
| Value (£ million) | 2.3 | 3.3 | 3.8 | 4.0 | 1.9 | 2.4 | 1.9 |
| Tonnage | 3,270 | 3,773 | 4,470 | 4,751 | 3,352 | 3,463 | 3,759 |
| Value per tonne (£) | 713 | 872 | 857 | 840 | 579 | 699 | 503 |
Source: Analysis of internal Scottish Government data.
The landed value of horse mackerel averaged £2.8 million between 2018 and 2024, with an average tonnage of approximately 3,800 tonnes. The price per tonne averaged £723 over this period. Analysis of UK fisheries data shows that the majority of horse mackerel is caught by trawls, which caught an average of 96% of the catch between 2018 and 2024. The remaining 4% was caught by vessels using seine nets.
The tables below set out landings from Area 4.a and, separately, from Areas 4.b,c and 7.d for the period 2018 to 2024, the latter being the final year in which a directed fishery operated in the southern North Sea and eastern Channel. Since then, landings from Areas 4.b,c and 7.d have been limited to bycatch from other fisheries, with approximately 99 tonnes landed in 2025. By contrast, landings from Area 4.a have continued at broadly similar levels, with around 132 tonnes taken in 2025.
| Year | 2018 | 2019 | 2020 | 2021 | 2022 | 2023 | 2024 |
|---|---|---|---|---|---|---|---|
| Landed Value (£'000, 2024 prices) | 3 | 90 | 50 | 44 | 61 | 79 | 24 |
| Tonnage | 4 | 103 | 58 | 53 | 105 | 114 | 48 |
| Price per Tonne (£, 2024 prices) | 713 | 872 | 857 | 840 | 579 | 699 | 503 |
| Year | 2018 | 2019 | 2020 | 2021 | 2022 | 2023 | 2024 |
|---|---|---|---|---|---|---|---|
| Landed Value (£'000, 2024 prices) | 2,330 | 3,290 | 3,831 | 3,991 | 1,941 | 2,421 | 1,891 |
| Tonnage | 3,268 | 3,773 | 4,470 | 4,752 | 3,352 | 3,463 | 3,759 |
| Price per Tonne (£, 2024 prices) | 713 | 872 | 857 | 840 | 579 | 699 | 503 |
Between 2015 and 2024, most landings of horse mackerel by the UK fleet were landed abroad. On average, around 91% of horse mackerel landings took place abroad. Landings into the Netherlands made up an average of 88% of the total between 2018 and 2024, with France and Norway making up the remaining 3% of landings abroad. In the UK, the Southwest made up 7% of total landings, while the Humber saw an average of 2% of landings.
Horse mackerel landings are relatively unimportant to UK ports. Plymouth takes in 91% of the value of all horse mackerel landings in the UK, but these landings make up only 1% of the total value of landings in Plymouth. Similarly, horse mackerel landings are only a small proportion of landings for the group that targets it. Pelagic vessels over 40 metres landed 91% of horse mackerel, but it only accounted for 1% of their total landed value.
Contact
Email: fmps@gov.scot