New Light on Adult Literacy and Numeracy in Scotland: Evidence from the 2004 survey of the 1970 British Cohort Study (BCS70)
This report gives the results of a separate analysis for Scotland of literacy and numeracy data collected in the 1970 British Cohort Study at age 34. It relates performance in these skills to a wide range of other features of Scottish cohort members' lives.
Chapter 3 Assessment of literacy and numeracy skills in Scotland
This was the first time that the literacy and numeracy skills of cohort study members living in Scotland had been assessed by objective methods 15. The new literacy and numeracy assessments designed for assessing cohort members in 2004 combined
- Open-response ( OR) literacy and numeracy questions previously used to assess the functional literacy and numeracy skills of BCS70 cohort members' in 1991 (England and Wales sample only) 16.
- Multiple-choice ( MC) questions extracted from the 2002 Skills for Life Survey 17.
The aim of importing items from the Skills for Life (SfL) Survey was to enable cross-referencing from one survey to another and supply benchmarking to the national standards 18. The OR items were included for continuity purposes. In this report we will be concentrating on the multiple choice assessments. The MC items selected from the SfL survey were selected to provide as comprehensive coverage as possible of the Adult Literacy and Numeracy Core Curricula for England. The questions are set at four levels of difficulty: Entry Level 2, Entry Level 3, Level 1 and Level 2, the most difficult. Entry levels in England (National Qualifications Framework ( NQF)) cover the same qualification range as Access levels 1, 2 and 3 in Scotland (Scottish Credit and Qualifications Framework ( SCQF)). For further details on the mapping of qualifications across the UK and Ireland see the Qualifications Can Cross Boundaries leaflet included in the Annex. A brief description of the design of the literacy and numeracy assessments are given below.
Literacy
A total of 30 multiple-choice literacy questions made up the final assessment, of which ten were screening questions SCQF Access Level 3 ( NQF Entry Level 3). Respondents failing to answer at least six of these questions correctly went on to answer ten SCQF Access Level 2 ( NQF Entry Level 2) questions on the lower tier. Respondents who answered between six and ten screening questions correctly proceeded to the upper tier and answered five SCQF Level 4 ( NQF Level 1) and five SCQF Level 5 ( NQF Level 2) questions. Although question selection was heavily concentrated on the many aspects of 'Reading Comprehension', Figure 3.1 shows that 'Writing Composition', 'Grammar and Punctuation' and 'Spelling and Handwriting' were also covered by items on both the lower and upper tiers.
Figure 3.1: Final literacy multiple-choice assessment
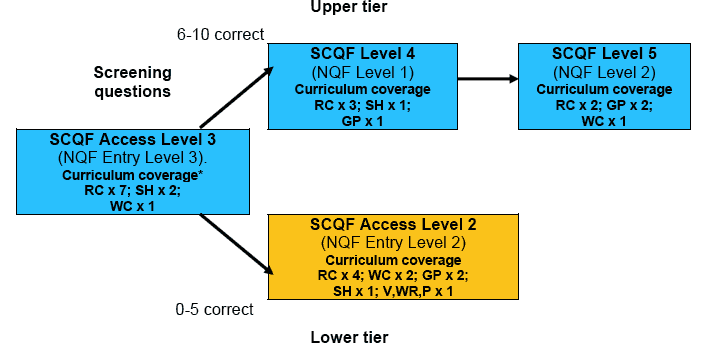
*The number of questions covering specific aspects of the literacy core curriculum. Reading: RC = Reading Comprehension, GP = Grammar and Punctuation, V, WR,P = Vocabulary, Word Recognition, Phonics. Writing: WC = Writing Composition, GP = Grammar and Punctuation, SH = Spelling and Handwriting.
Numeracy
Unlike for literacy, all respondents attempted all questions in the numeracy multiple-choice assessment. The widespread and diverse nature of difficulties associated with numeracy - that people can be good at some numerical tasks and not others at the same level of difficulty - suggested that allowing a 'spiky profile' for number skills at the population level, would have equal, if not more, value than restricting this examination to the one in four or one in three with the poorest grasp of numeracy. There were 17 questions in the final version of the assessment. To obtain as balanced a set of questions as possible in relation to curriculum coverage and difficulty levels, the final instrument was made up of five questions set at SCQF Access Level 2 ( NQF Entry Level 2), four at SCQF Access Level 3 ( NQF Entry Level 3), five at SCQF Level 4 ( NQF Level 1) and three at SCQF Level 5 ( NQF Level 2). Seven aspects of number skill from the numeracy curriculum were assessed by the selected items. These were:
- Basic Money ( BM)
- Whole Numbers and Time ( NT)
- Measures and Proportion ( MP)
- Weights and Scales ( WS)
- Length and Scaling ( LS)
- Charts and Data ( CD)
- Money Calculations ( MC)
The 17 selected questions were presented in order of difficulty within each curriculum topic, for example, all questions set at different levels of 'Money Calculations' were attempted, before moving to the next set of questions on 'Whole Numbers and Time'. This method was adopted because of its potential value for capturing more of the elements of numeracy that an individual respondent could and could not do. The assessment started and ended with an SCQF Access Level 3 ( NQFSCQF Access Level 3) question, as shown in Figure 3.2.
Figure 3.2: Final numeracy assessment: curriculum coverage and sequence of difficulty of questions
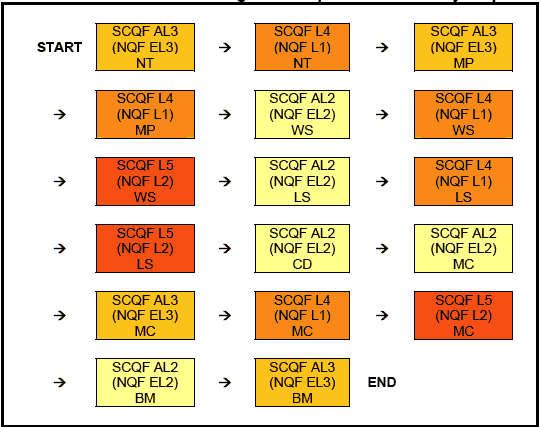
Note 1:Aspects of the Skills for Life numeracy core curriculum: NT = Whole Numbers and Time, MP = Measures and Proportion, WS = Weights and Scales, LS = Length and Scaling, CD = Charts and Data, MC = Money Calculations, BM = Basic Money.
Note 2: In combination, the selected MC and OR questions ensured that each aspect of the curriculum was covered by at least three questions at different levels of difficulty.
Calculation of overall scores
For numeracy, computation of an overall score was straightforward as all cohort members completed all questions. Any correct answer was given '1' point, any incorrect answer '0' points. The maximum numeracy score available from the multiple-choice questions is within the range 0 to 17 for all cohort members.
For the vast majority of cohort members who progressed along the upper tier of the literacy assessment the identical scoring technique applied: any correct answer was given '1' point, any incorrect answer '0' points. However, to calculate an overall score that included the 4% of cohort members who, because they failed to answer six or more of the screening questions correctly, moved down to the lower tier of the MC assessment, we have to assume they would not have been able to answer any of the more difficult questions on the upper tier, SCQF Level 4 and SCQF Level 5. Accordingly, a score of '0' was automatically awarded to this group for the ten questions on the upper tier. Likewise, a score of '1' for each of the ten questions on the lower tier was automatically awarded to the 96% of cohort members who progressed along the upper tier. The maximum literacy score available from the multiple-choice questions is therefore within the range 16 to 30 for cohort members on the upper tier and 0 to 15 for cohort members who progressed on the lower tier.
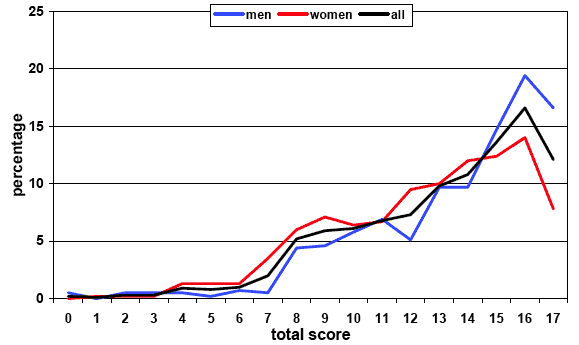
For cohort members living in Scotland in 2004, the distribution of their total literacy score (0 to 30) is shown in Figure 3.3a. The performance of lower tier cohort members is represented by the long tail towards the low scores, reflecting the relatively low incidence of very poor reading skills in the population. The total numeracy score is displayed in Figure 3.3b. We can see that men rather than women answered more of the questions correctly in the numeracy assessment: 51% answered at least 15 of the 17 questions correctly compared to 36% of women.
We also looked at the relationship between performance in the literacy and numeracy assessment. The Pearson correlation coefficient 19 showed a strong and highly significant relationship between cohort members' performance in the literacy and numeracy multiple choice assessments. This was slightly weaker for cohort members' living in Scotland than in Great Britain overall, being weakest of all among those living in the Central Belt region of Scotland.
Figure 3.3a: Total literacy score from multiple-choice questions
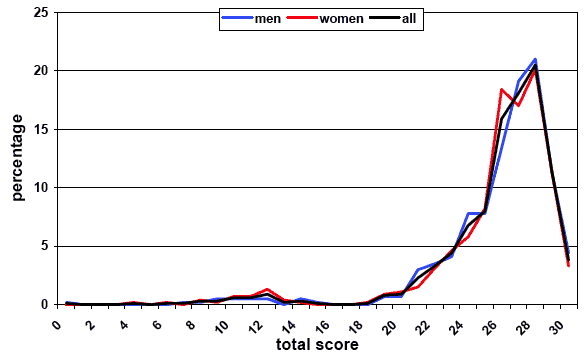
Figure 3.3b: Total numeracy score from multiple-choice questions
Converting performance in literacy and numeracy assessments into levels
By converting performance answers in the multiple choice assessment into levels, we were able to classify respondents by their achieved level 20. The classification by levels that was employed is based on the principle that, to pass a level, at least half the test questions at the given level had to be answered correctly, as follows.
For Literacy
- Below SCQF Access Level 2: 0 - 5 correct at SCQFAL2
- SCQF Access Level 2: 6 - 10 correct at SCQFAL2 and 0 - 5 at SCQFAL3
- SCQF Access Level 3: 6 - 10 correct at SCQFAL3 and 0 - 2 at SCQF L4
- SCQF Level 4: 3 - 5 correct at SCQF L4 and 0 - 2 at SCQF L5
- SCQF Level 5: 3 - 5 correct at SCQF L4 and 3 at SCQF L5
For Numeracy
- Below SCQF Access Level 2: 0 - 3 correct at SCQFAL2
- SCQF Access Level 2: 4 - 5 correct at SCQFAL2 and 0 - 2 at SCQFAL3
- SCQF Access Level 3: 3 - 4 correct at SCQFAL3 and 0 - 3 at SCQF L4
- SCQF Level 4: 4 - 5 correct at SCQF L4 and 0 - 2 at SCQF L5
- SCQF Level 5: 3 correct at SCQF L5
As a guide to the possible totals represented by percentages quoted in the text, current figures from the Census give a total population for Scotland of 5,062,011 of which the adult population over 16 is 4,049,609.
http://www.scrol.gov.uk/scrol/common/home.jsp, 2007)
Literacy and numeracy levels in Scotland
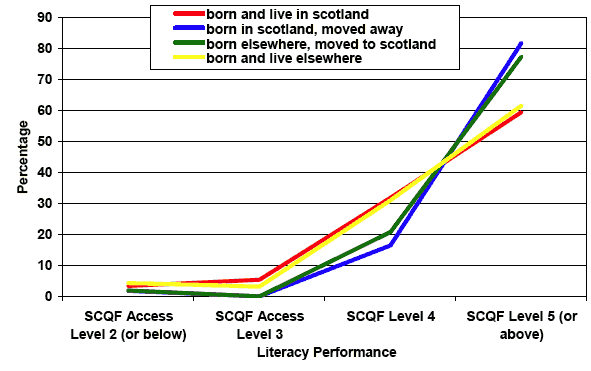
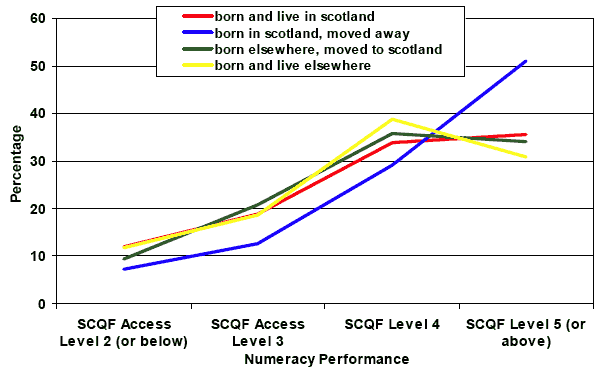
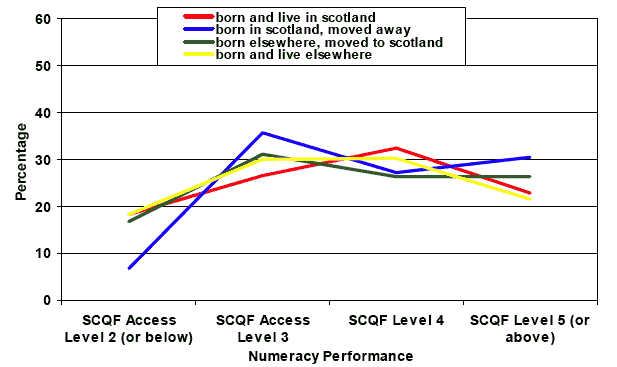
After classifying performance on the number of correct answers to the multiple-choice questions in terms of the (Scottish equivalent) literacy and numeracy levels used in the Skills for Life Survey ( SCQF Access Level 2, Access Level 3, Level 4 and Level 5), we now compare the distribution of men and women in the 2004 survey across the four levels of literacy and numeracy by geographic region within Scotland and then by their Scottish roots. In the initial New Light report literacy performance among cohort members in Scotland was nearly identical to that of the majority living in England, but there were slightly more who performed at the upper end for numeracy. Overall, 8% of men and women in Scotland had literacy skills at SCQF Level 3 and below, while 31% of men and 29% of women (30% overall) had not progressed beyond SCQF Level 4. However, whereas 31% of men were assessed with SCQF Access Level numeracy this increased to 45% for women, meaning 69% of men and 55% of women had SCQF Level 4 or higher numeracy. Within Scotland, slightly more men and women living within the Central Belt performed at the higher end of the distribution for both literacy and numeracy (63% to 61% SCQF Level 5 or higher literacy; 31% to 25% SCQF Level 5 (or higher numeracy). However, this better performance can be largely accounted for by the in-migration to the metropolitan areas of Scotland. As we can see in Figure 3.4a and 3.4b, the overall performance of men and women who by our simple classification were 'non-migrants', either born and living in Scotland or born and living elsewhere, was nearly identical and that performance was much higher among the 'migrants' - men and women who had moved to or from Scotland after they were born. Migrant men were four times less likely to have SCQF Access Levels 2 or 3 literacy, compared to non-migrants, and migrant women were half as likely to. Around 8 in 10 men who had moved to or from Scotland, and 8 in 10 women who had moved to Scotland, had SCQF Level 5 or higher literacy skills. Looking at numeracy performance, Figure 3.5a and 3.5b shows that both men and women who had moved away from Scotland were the least likely to have SCQF Access Level 2 numeracy and most likely to have SCQF Level 5 numeracy: 1 in 2 men had SCQF Level 5 or higher skills, compared with around 1 in 3 of all other men.
Figure 3.4: 'Profiles of competence'
a) Literacy performance of men in BCS70 (present at birth and 34)
b) Literacy performance of women in BCS70 (present at birth and 34)
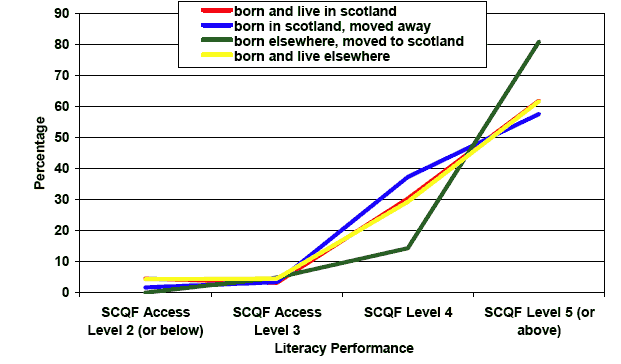
Figure 3.5: 'Profiles of competence'
a) Numeracy performance of men in BCS70 (present at birth and 34)
b) Numeracy performance of women in BCS70 (present at birth and 34)
Summary of assessed Literacy and Numeracy Levels in Scotland
Performance in the literacy and numeracy assessments was more weakly related for men and women in Scotland compared with BCS70 overall. Within Scotland men had stronger numeracy skills than women, and slightly more men and women living within the Central Belt area performed at the higher end of the distribution for both literacy and numeracy. However, men who had moved away from Scotland had the strongest skills of all, with more than 8 in 10 having SCQF Level 5 or higher literacy or numeracy skills. Among all other men, around 6 in 10 had SCQF Level 5 or higher literacy and 1 in 3 SCQF Level 5 or higher numeracy.