National Standardised Assessments for Scotland: national report 2024-2025
Summary of outcomes at a national level on the 'Scottish National Standardised Assessments' (SNSA) and ‘Measaidhean Coitcheann Nàiseanta airson Foghlam tron Ghàidhlig’ (MCNG) (collectively known as NSA) in the 2024 to 2025 academic year.
2 Numeracy
2.1 The scope of the numeracy assessment
2.1.1 Numeracy for P1, P4, P7 and S3
For both SNSA and MCNG, there were separate assessments of numeracy for P1, P4, P7 and S3 (though assessment data shows that Gaelic Medium learners tend to take the SNSA Numeracy assessment at S3). The same set of organisers was used for each of the assessments, with the proportion of items in each organiser varying by stage to reflect the change in emphasis on each area within Curriculum for Excellence (CfE).
2.1.2 A note on contexts used in the numeracy NSA
For numeracy assessments within NSA, a wide variety of simple contexts was used. Typically, items were short and discrete, so contexts were relatively straightforward in nature, covering a mix of everyday life and the school environment.
All items were reviewed by Education Scotland for their appropriateness to the Scottish context, prior to inclusion in the assessments.
MCNG items are written by Gaelic Medium Education practitioners and quality assured by a panel, chaired by Education Scotland. MCNG items also follow the same trialling process as SNSA items.
2.2 Coverage of Curriculum for Excellence
NSA is just one part of the range of assessments that teachers use in making their evaluations of children's and young people's learning. It has been possible to assess most areas of the numeracy Experiences and Outcomes within this standardised assessment, using closed response items that can be automatically marked. The assessments comprise between 27 and 30 items per learner, according to stage. Due to the adaptive nature of the assessments, there will be variation in specific areas assessed in different assessments, according to the learner’s individual pathway. The assessment items for the NSA reflect the knowledge, skills understanding, and standards embedded within the Curriculum for Excellence Experiences and Outcomes for reading, writing and numeracy across the CfE Levels, in accordance with the most up to date Education Scotland advice and curricular guidance on Experiences and Outcomes and Benchmarks. To note: although mathematics Experiences and Outcomes are included within the Curriculum for Excellence document Benchmarks: Numeracy and Mathematics, these are not assessed within NSA, since the numeracy assessment only assesses the numeracy Experiences and Outcomes.
All four organisers were represented in the P1, P4, P7 and S3 numeracy assessments, with different proportions across the stages. In the reports provided to schools, teachers received information about the outcomes of the learner at the organiser level, if the learner was presented with at least five items from that organiser. Similarly, in this report, outcomes for organisers that were addressed by at least five items in each learner's assessment are analysed.
The information in sections 2.2.1 - 2.2.4 apply to SNSA. MCNG examples and descriptions can be found in sections 2.2.5 - 2.2.8 of this report.
2.2.1 SNSA Number
The focus of this organiser is understanding the properties of numbers and the ability to use the four basic number operations. It included items that asked about estimating and rounding; number and number processes; addition, subtraction, multiplication and division; and place value. In P7 and S3, negative numbers were also assessed. This organiser could be regarded as containing some of the basic building blocks of numeracy: the ability to engage with content in the other organisers is dependent to some extent upon the ability to understand place value and properties of number, as well as being able to understand and use the four basic operations of addition, subtraction, multiplication and division.
Please note that the item included in Figure 3 and all subsequent figures throughout this report have not been included in any of the assessments since the 2022 to 2023 academic year, and they will not be included in any future SNSA.
Figure 3 shows a Number item from the S3 numeracy assessment.
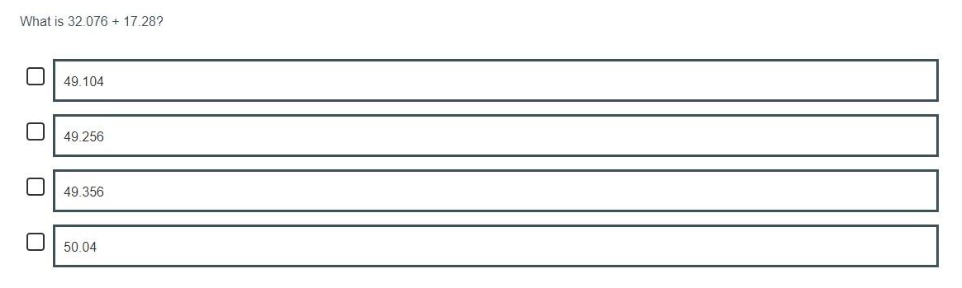
In this item, learners solve an addition problem working with decimal fractions to two and three decimal places, without the use of context. It builds on young people's existing knowledge of place value in whole numbers to assess their understanding of place value in decimal numbers. This item comes from the middle of the item difficulty range for the S3 numeracy assessment.
2.2.2 SNSA Fractions, decimal fractions and percentages
The main focus of this organiser is on the ability to recognise and work with fractions, decimal fractions and percentages. At P1, this involves sharing objects into equal sets and recognising representations of halves. By P4, children were asked to recognise standard fraction notation for common fractions, order fractions by size, and recognise pictorial representations of fractions. In the P7 assessment, children were also assessed on their current capacity to work with decimal fractions and percentages, recognise equivalent values in the different forms, and find fractions and percentages of a quantity. At S3, young people were also assessed on their current capacity to work with ratios.
In the assessments for the later stages, there was an increase in the number of items assessing this organiser. This shift in the assessments' weightings reflects learners' increasing familiarity with whole numbers, and the transition to applying their understanding of how to calculate with whole numbers to their growing understanding of Fractions, decimal fractions and percentages.
Figure 4 shows a difficult Fractions, decimal fractions and percentages item focusing on percentages from the P7 numeracy assessment.
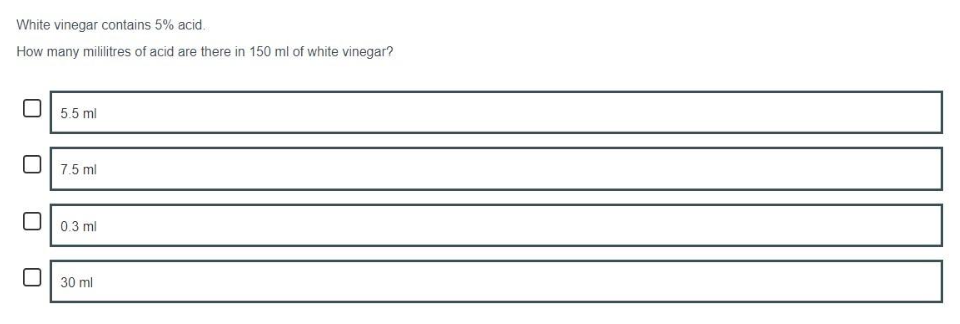
This item asks children to calculate a given percentage of an amount. The use of 5% as the percentage in the question prompt enables children to use a variety of approaches to solving the problem. The most likely strategy would be the standard approach of dividing by 100 and then multiplying by five; alternatively, children may make use of known facts to divide by 10 and then halve. The use of vinegar as a context enables children to demonstrate that they are able to apply their knowledge to situations where they may not have previously worked with percentages.
Figure 5 shows a Fractions, decimal fractions and percentages item from the S3 numeracy assessment.
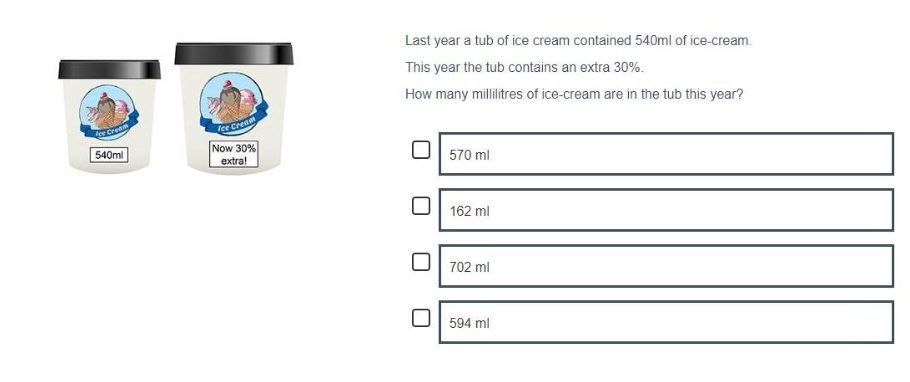
This item asks young people to calculate a new total after a given percentage increase, in the context of capacity. The wrong answers represent the ways in which the learners could miscalculate the change in total. This item would be above average difficulty for the S3 numeracy assessment.
2.2.3 SNSA Measurement, time and money
This organiser draws together the numeracy Benchmarks that cover measurement, time and money. The measurement strand of SNSA progresses from comparing and ordering, and the use of non-standard units of measure at P1, to the use of standard units, reading scales and estimation, and calculating areas by counting squares or other methods at P4. At P7, children are expected to be estimating using standard units of measures and calculate areas of squares, rectangles and right-angled triangles. By S3, young people were asked to demonstrate that they could calculate other areas and volumes and convert between standard units of measure. Money at P1 and P4 focused on the recognition of coin values and calculating change, with P4 additionally covering accurate use of pounds and pence notation. At P7 and S3, budgeting, calculating profit and loss, and currency conversion also featured. Time covered areas such as reading clock times, interpreting timetables, calculating time durations and speed/distance/time calculations, as appropriate for each stage.
Figure 6 shows an item from the middle of the difficulty range for the P4 numeracy assessment, reflecting the measurement aspect of the organiser.
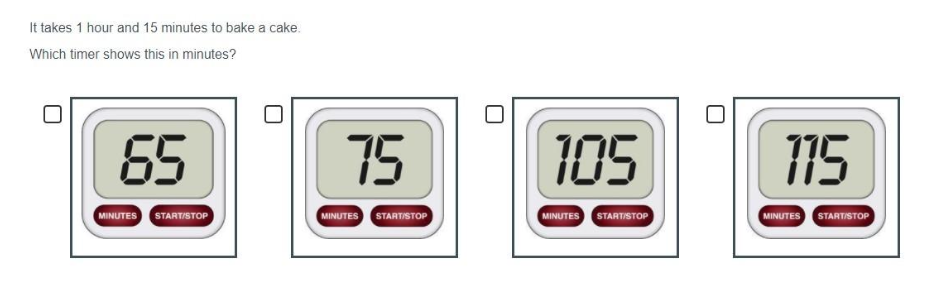
The focus of this item is on converting hour and minutes to minutes only. This looks to identify if learners are able to identify the number of minutes in an hour and use this to complete a calculation. This is from the upper end of the difficulty scale for P4.
Figure 7 shows a typical P1 numeracy item, reflecting the time aspect of the organiser.
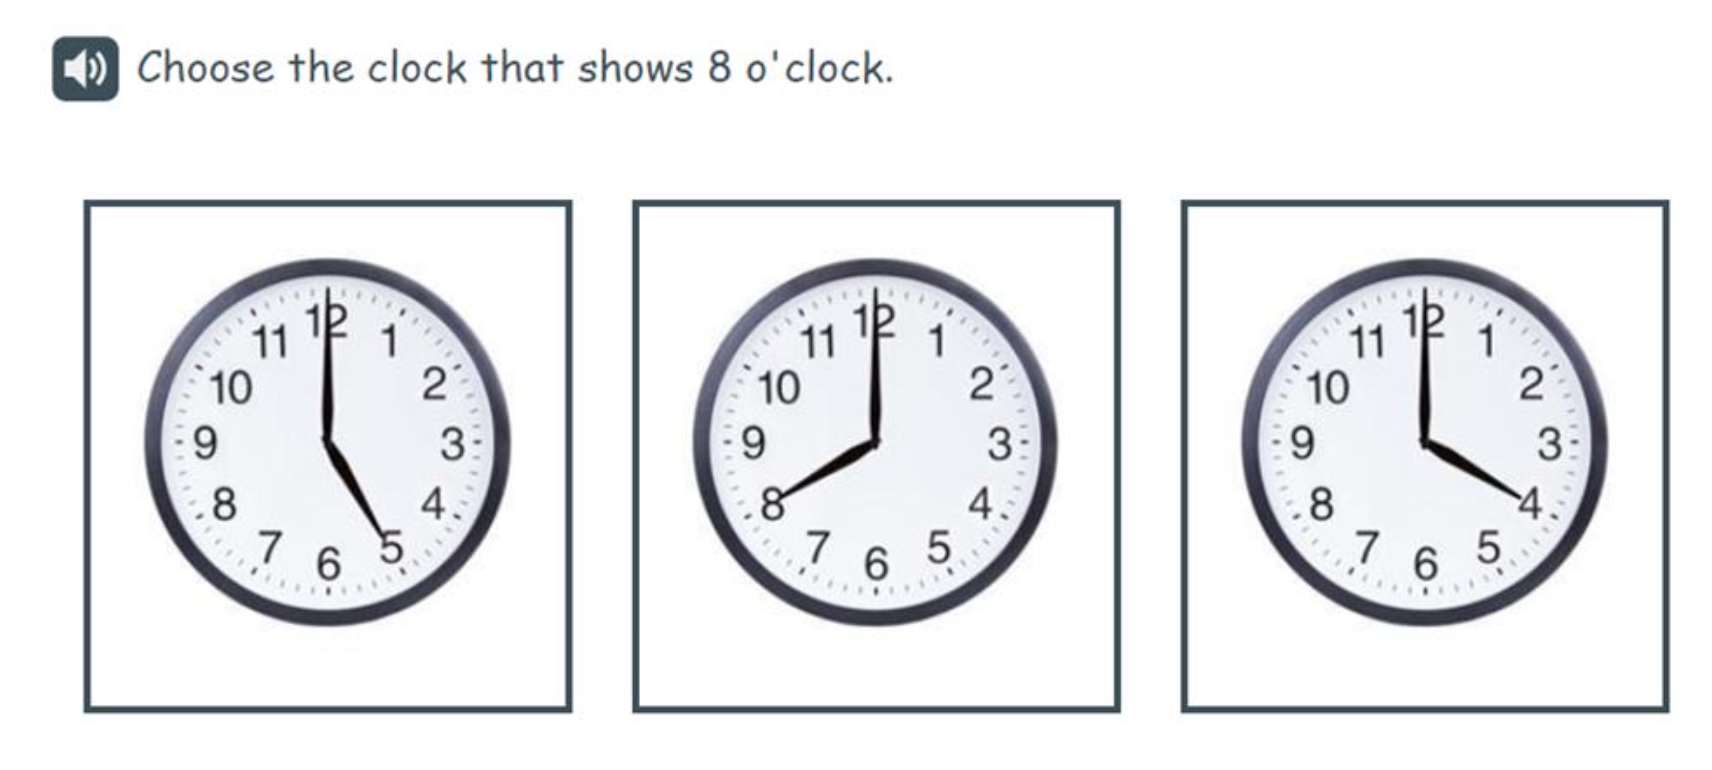
This item is designed to assess children's ability to read o'clock times on analogue clocks. In this instance, children were asked to select the analogue clock from a given time. Typically, in SNSA and other assessments for this age group, learners’ understanding of analogue clocks correlates less well with overall capacity in numeracy than is the case for many other aspects of numeracy. As such, typically, there is less of a difference in outcomes for learners working across the capacity range than for other areas of numeracy. This may be due to experiences outside of school that affect children's understanding of this aspect more than in other areas of numeracy.
Figure 8 shows an item reflecting the money aspect of the organiser.
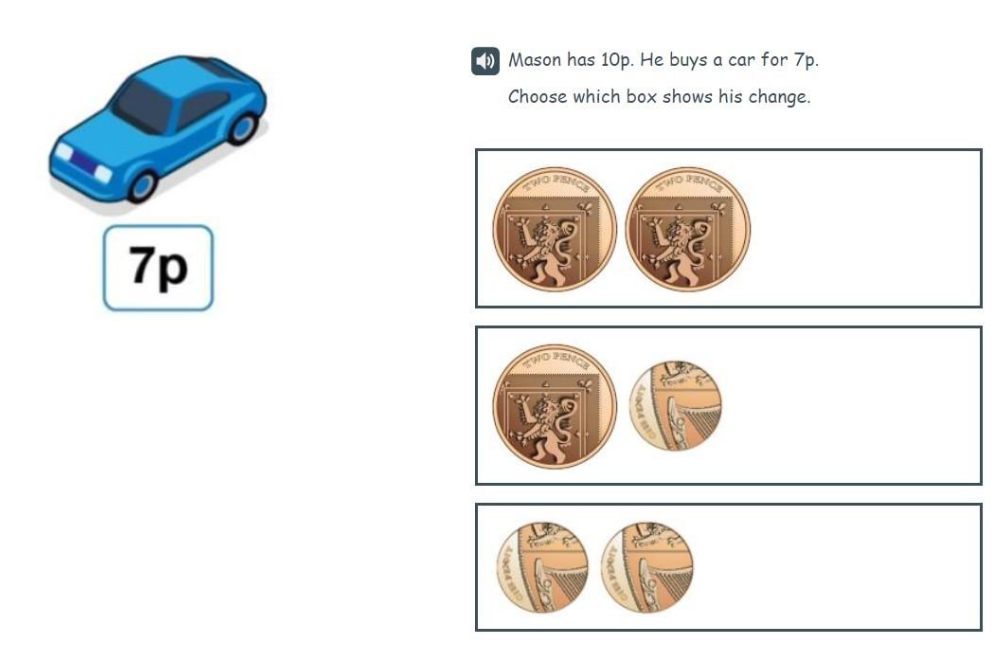
This item is designed to assess recognition of coin values with the context of a calculation. Retaining and processing both pieces of information in a two-step problem adds an additional level of challenge. Coin recognition is a skill which P1 learners seem to find more challenging, especially below £1.
2.2.4 SNSA Information handling
The focus of this organiser is on data and analysis. It involves the use and interpretation of a wide range of increasingly complex tables, charts and graphs. At P1, this begins with sorting and categorising objects according to specified criteria. Forms of data presentation that are assessed include Venn and Carroll diagrams, tally charts, tables, block graphs, bar graphs, line graphs and pie charts; types of charts that are covered vary according to stage. Scales on the charts progress in complexity from those numbered in ones to having scales where not all values are marked. From P4 onwards, elements of probability, as detailed in the 'chance and uncertainty' Benchmarks, are also assessed. This includes the language of chance and also the use of the 0 to 1 probability scale.
Figure 9 shows an item from the lower end of the difficulty range for the P7 numeracy assessment, reflecting the data and analysis aspect of the organiser.
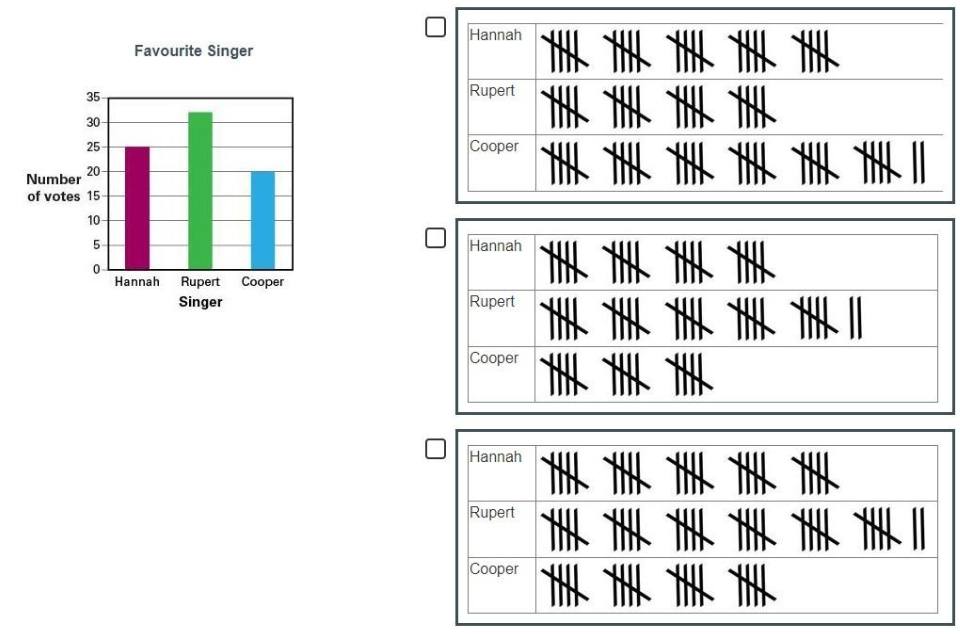
This item shows a simple column graph where the scale is numbered in fives and three tally charts of data. From these, the learner must select the correct tally chart which was used to create the graph.
2.2.5 MCNG Number
The focus of this organiser is understanding the properties of numbers and the ability to use the four basic number operations. It included items that asked about estimating and rounding; number and number processes; addition, subtraction, multiplication and division; and place value. In P7 and S3, negative numbers were also assessed. This organiser could be regarded as containing some of the basic building blocks of numeracy: the ability to engage with content in the other organisers is dependent to some extent upon the ability to understand place value and properties of number, as well as being able to understand and use the four basic operations of addition, subtraction, multiplication and division.
Figure 10 shows an example item from P1 Number.
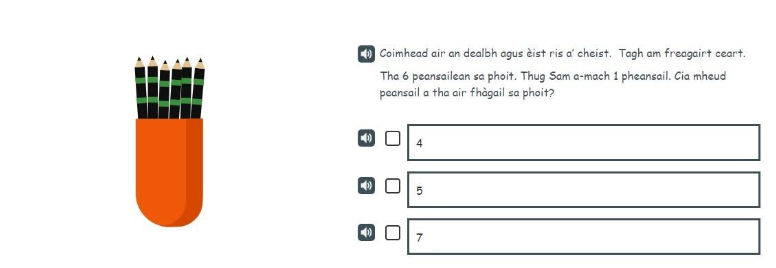
This item is designed to assess a learner’s ability to subtract one number from another and identify the correct answer. This item has audio support for the learners, as well as visual support.
Figure 11 is another example of a P1 Number item which assesses basic counting skills.
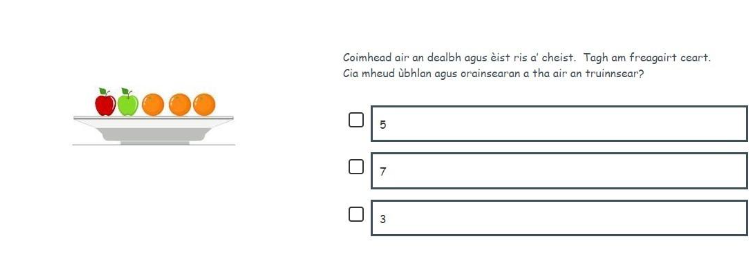
This item asks learners to count the number of apples and oranges on the plate.
2.2.6 MCNG Fractions, decimal fractions and percentages
The main focus of this organiser is on the ability to recognise and work with fractions, decimal fractions and percentages. At P1, this involves sharing objects into equal sets and recognising representations of halves. By P4, children were asked to recognise standard fraction notation for common fractions, order fractions by size, and recognise pictorial representations of fractions. In the P7 assessment, children were also assessed on their current capacity to work with decimal fractions and percentages, recognise equivalent values in the different forms, and find fractions and percentages of a quantity. At S3, young people were also assessed on their current capacity to work with ratios.
In the assessments for the higher stages, there was an increase in the number of items assessing this organiser. This shift in the assessments' weightings reflects learners' increasing familiarity with whole numbers, and the transition to applying their understanding of how to calculate with whole numbers to their growing understanding of Fractions, decimal fractions and percentages.
Figure 12 asks learners to work with fractions to calculate how many of an item are left after 35% of them have been sold.
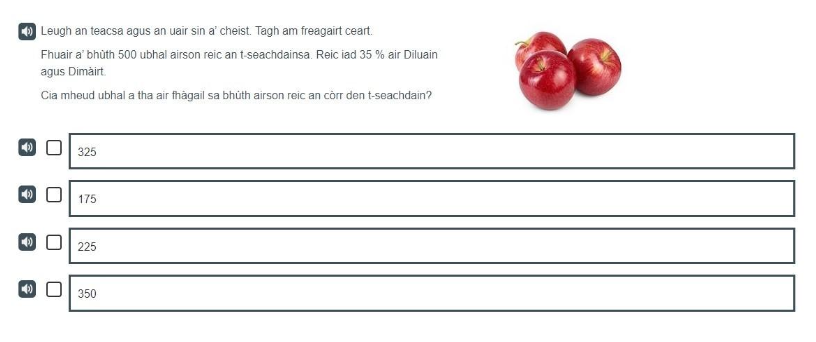
This item asks learners to calculate how many apples are left after a percentage of the original have been sold.
Figure 13 shows an example item from an S3 Fractions, decimal fractions and percentages assessment.
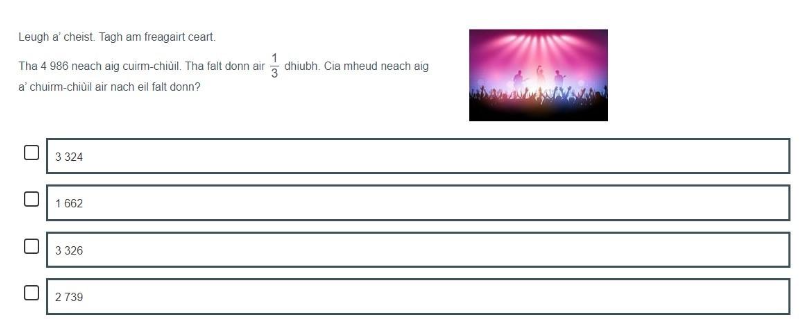
This multi-step item assesses learners’ ability to calculate a number based on a fraction and then subtract that number from a total. Although this is a multi-step item, it is an easier item for S3 Fractions, decimal fractions and percentages.
2.2.7 MCNG Measurement, time and money
This organiser draws together the numeracy Benchmarks that cover measurement, time and money. The measurement strand of MCNG progresses from comparing and ordering, and the use of non-standard units of measure at P1, to the use of standard units, reading scales and estimation, and calculating areas by counting squares or other methods at P4. At P7, children are expected to be estimating using standard units of measures and calculate areas of squares, rectangles and right-angled triangles. By S3, young people were asked to demonstrate that they could calculate other areas and volumes and convert between standard units of measure. Money at P1 and P4 focused on the recognition of coin values and calculating change, with P4 additionally covering accurate use of pounds and pence notation. At P7 and S3, budgeting, calculating profit and loss, and currency conversion also featured. Time covered areas such as reading clock times, interpreting timetables, calculating time durations and speed/distance/time calculations, as appropriate for each stage.
Figure 14 shows an example item from a P4 assessment which assesses the learners’ ability to add time intervals.
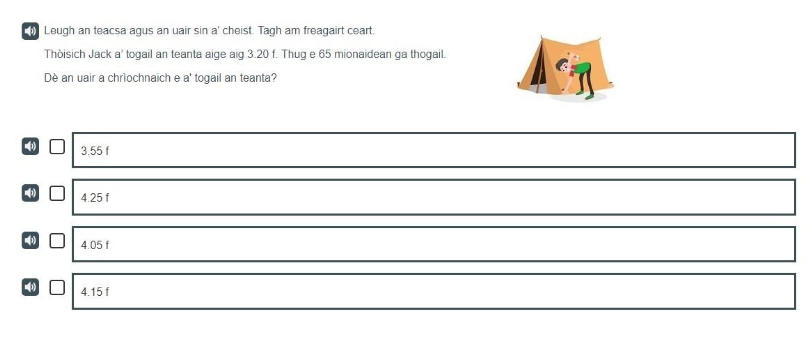
This item asks learners to add 65 minutes to a starting time, assessing their ability to add time in increments of more than one hour. This type of item would be towards the harder end of difficulty for P4.
2.2.8 MCNG Information handling
The focus of this organiser is on data and analysis. It involves the use and interpretation of a wide range of increasingly complex tables, charts and graphs. At P1, this begins with sorting and categorising objects according to specified criteria. Forms of data presentation that are assessed include Venn and Carroll diagrams, tally charts, tables, block graphs, bar graphs, line graphs and pie charts; types of charts that are covered vary according to stage. Scales on the charts progress in complexity from those numbered in ones to having scales where not all values are marked. From P4 onwards, elements of probability, as detailed in the 'chance and uncertainty' Benchmarks, are also assessed. This includes the language of chance and also the use of the 0 to 1 probability scale.
Figure 15 shows an example probability item from a P4 assessment.
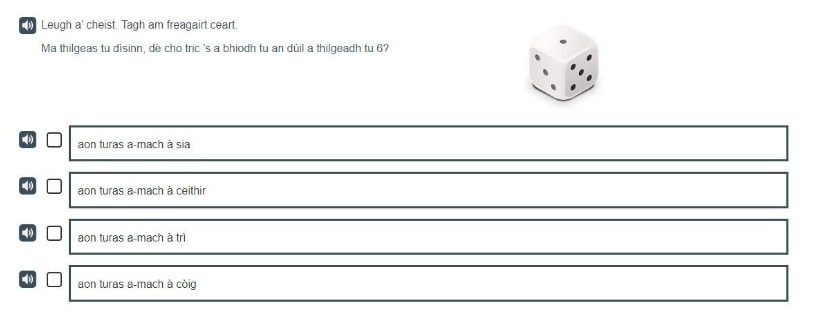
This item asks learners what the probability of throwing a six with a six-sided dice is. This item would be a difficult item for P4 learners.
2.3 SNSA National outcomes for numeracy[4]
2.3.1 Overall outcomes
Charts 1a to 1d show, for each stage (P1, P4, P7 and S3), the overall outcomes of learners for numeracy. Where learners are presented with more than 5 items per organiser, they additionally show the outcomes of learners according to the knowledge organisers: Number (NUM), Fractions, Decimal fractions and Percentages (FDP), Measurement, Time and Money (MTM) and Information Handling (IH). The bars show outcomes across the six capacity bands that are specific to each stage, in line with SNSA reports for the academic year 2024 to 2025.
For P1, the majority of learners achieved outcomes in the upper bands, and for P4, P7 and S3 learners, the middle bands were the most frequently achieved by learners.
Please note that for all charts, a notable difference refers to a difference of 10 percent or more, a small difference refers to any difference between 5 percent and 10 percent.
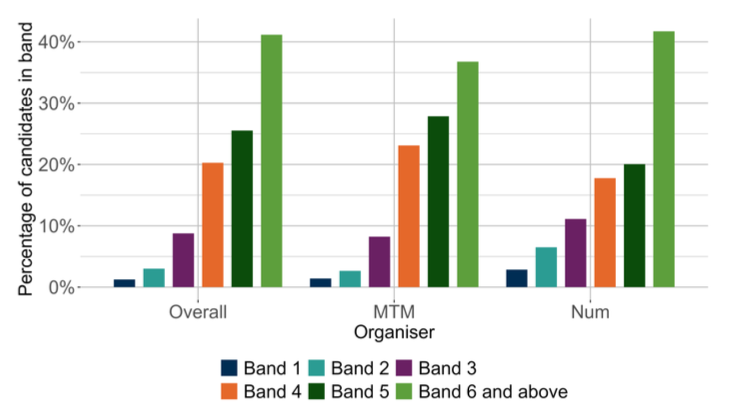
Overall, for P1, the band achieved by the largest proportion of learners was band 6, with 41.2% of learners achieving this. The band achieved by the smallest proportion of participants was band 1 with only 1.25% of learners scoring in this band. 66.7% of learners achieved bands 5 and 6 and 87% of learners achieved bands 4 to 6.
For the 'Money, time and measurement' organiser, 64.6% of learners achieved the upper bands (5 and 6) and 87.7% of learners achieved bands 4 to 6. As with the overall summary, the 'Money, time and measurement' organiser had the largest proportion of learners achieving outcomes in band 6.
For the 'Number' organiser, 61.8% of learners achieved the upper bands (5 and 6) and 79.5% of learners achieved bands 4 to 6. As with the overall summary, the 'Number' organiser had the largest proportion of learners achieving outcomes in band 6.
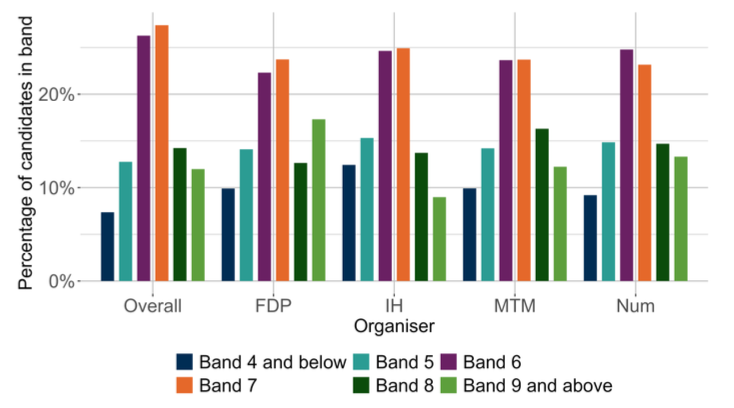
Overall for P4, band 7 was achieved by the largest proportion of learners, with 27.4% of students achieving this band, the second most common band was band 6. The least frequently achieved band for P4 learners was band 4 with only 7.4% of learners scoring in this band. 67.9% of learners achieved bands 6 to 8 and 92.6% of learners achieved bands 5 to 9.
As in the overall summaries, band 7 was achieved by the largest proportion of learners for each of the organisers, with the exception of the 'Number' organiser, for which band 6 was the most common outcome.
For the 'Fractions, decimal fractions and percentages' organiser, 58.7% of learners achieved bands 6 to 8 and 90.1% of learners achieved bands 5 to 9. Similarly, for the 'Information handling' organiser, 63.3% of learners achieved bands 6 to 8 and 87.6% of learners achieved bands 5 to 9.
Likewise, for the 'Money, time and measurement' organiser, 63.6% of learners achieved bands 6 to 8 and 90.1% of learners achieved bands 5 to 9. Finally, for the 'Number' organiser, 62.6% of learners achieved bands 6 to 8 and 90.8% of learners achieved bands 5 to 9.
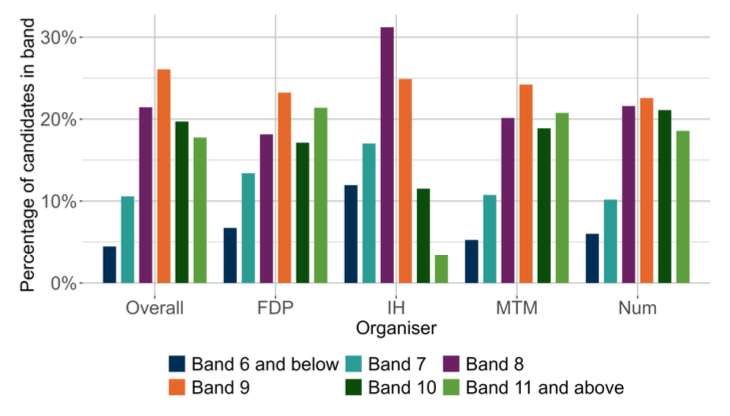
Overall for P7, the band achieved by the largest proportion of learners was band 9, with 26.1% of learners scoring in this band, and the second most common band achieved was band 8. The band achieved by the smallest proportion of learners was band 6 with only 4.5% scoring in this band. 67.2% of learners achieved bands 8 to 10 and 95.5% of learners achieved bands 7 to 11.
As with the overall summary, band 9 was the modal band achieved by learners for each of the organisers, with the exception of the 'Information handling' organiser, for which band 8 was the most common outcome.
For the 'Fractions, decimal fractions and percentages' organiser, 58.5% of learners achieved bands 8 to 10 and 93.3% of learners achieved bands 7 to 11.
Similarly, for the 'Information handling' organiser, 67.6% of learners achieved bands 8 to 10 and 88% of learners achieved bands 7 to 11.
For the 'Money, time and measurement' organiser, 63.2% of learners achieved bands 8 to 10 and 94.7% of learners achieved bands 7 to 11.
Finally, in the 'Number' organiser, 65.3% of learners achieved bands 8 to 10 and 94% of learners achieved bands 7 to 11.
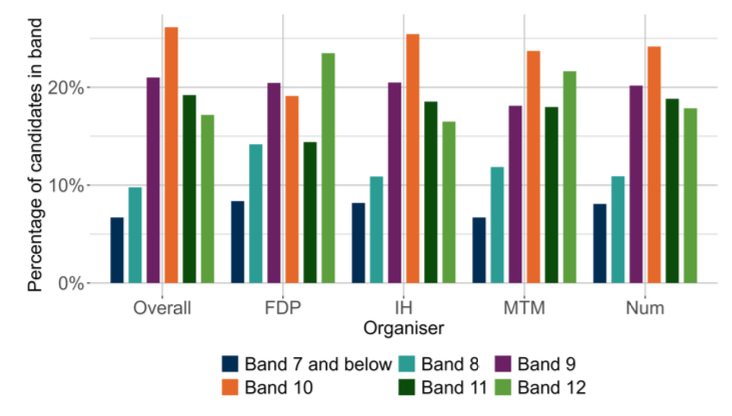
Overall for S3, band 10 was achieved by the largest proportion of learners (26.1% of learners) and the second most frequently achieved band was band 9. The band achieved by the smallest proportion of participants was band 7, with only 6.7% scoring in this band. 66.3% of learners achieved bands 9 to 11 and 93.3% of learners achieved bands 8 to 12.
For the 'Fractions, decimal fractions and percentages' organiser, 54% of learners achieved bands 9 to 11 and 91.6% of learners achieved bands 8 to 12.
In the 'Information handling' organiser, 64.5% of learners achieved bands 9 to 11 and 91.8% of learners achieved bands 8 to 12.
Similar outcomes can be seen in the 'Money, time and measurement' organiser where 59.8% of learners achieve bands 9 to 11 and 93.3% of learners achieved bands 8 to 12.
For the 'Number' organiser, 63.2% of learners achieved bands 9 to 11 and 91.9% of learners achieved bands 8 to 12.
As with the overall summary, band 10 was the modal band achieved by learners for each of the organisers, with the exception of the 'Fractions, decimal fractions and percentages' organiser, for which band 12 was the most common outcome.
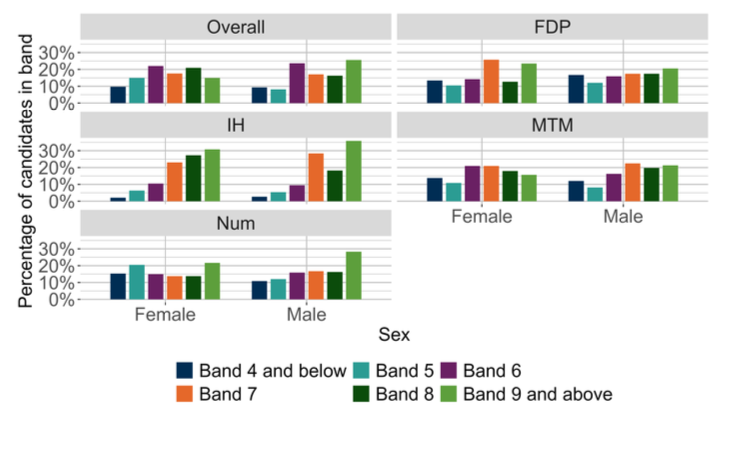
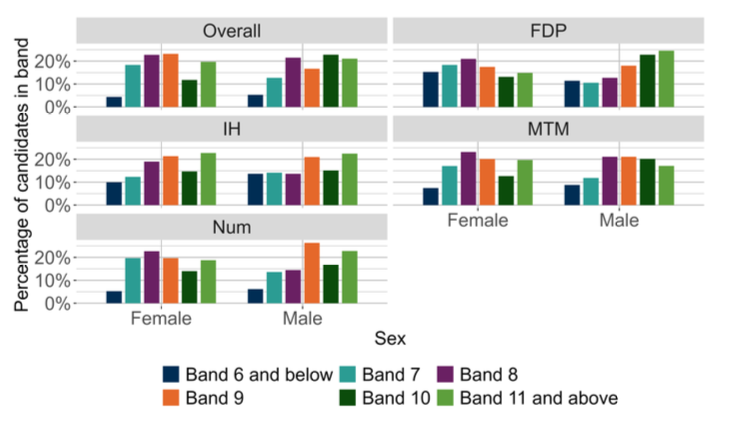
2.3.2 Sex
Charts 2a to 2d show outcomes for male and female learners for each stage (P1, P4, P7 and S3). Outcomes are given for the overall outcomes and by organiser.
Across all stages there were no notable differences between the outcomes of female and male learners in the overall summaries, and for P1 and P4 in the organiser summaries. For P7 and S3, there were notable differences between bands in the 'Fractions, decimal fractions and percentages' organiser and small differences at an overall and organiser level.
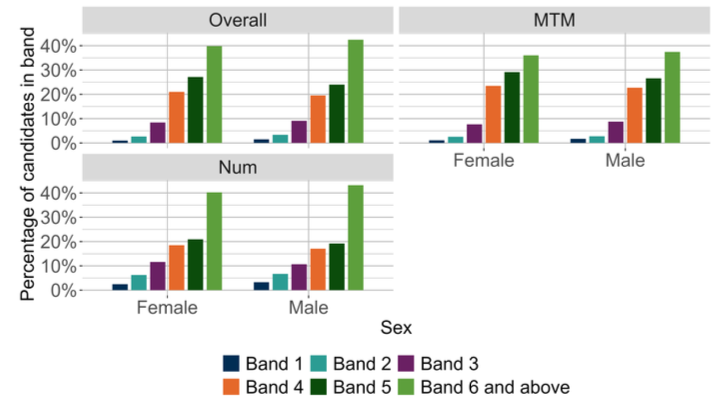
For P1, overall and for the ‘Number’ and ‘Money, time and measurement’ organisers, there were no differences between the proportions of females and males achieving outcomes in each band.
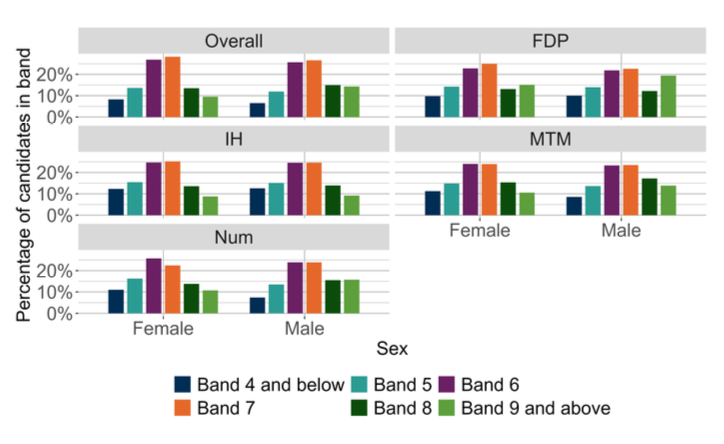
For P4, overall and for each of the organisers, there were no notable differences between the proportion of females and males achieving outcomes in each band.
For the ‘Number’ organiser was a small difference between the proportion of female and male learners achieving outcomes in band 9, with a greater proportion of male than female learners achieving a band 9. There were no differences between male and female learners across other organisers.
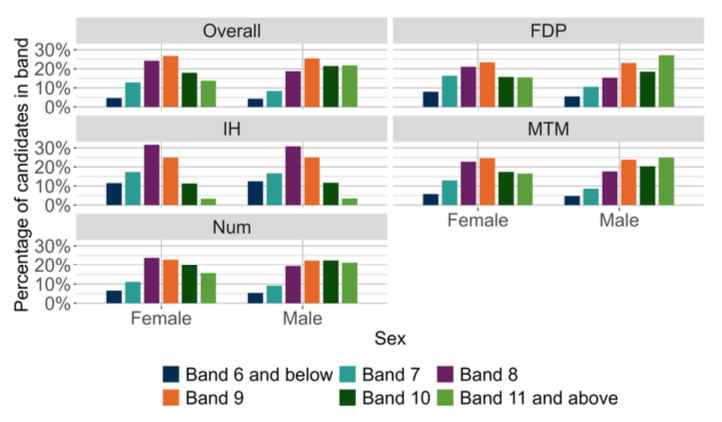
For P7, overall, there was a small difference between the proportion of females and males achieving outcomes in band 11, with a greater proportion of f male learners achieving outcomes in the upper two bands.
For the organisers, there was a notable difference between the proportion of females and males achieving outcomes in band 11 for the ‘Fractions, decimal fractions and percentages’ organiser. The ‘Number’ and ‘Money, time and measurement’ organisers showed only small differences in band 11 and the ‘Money, time and measurement’ organiser showed small differences in band 8. There was no difference for all other bands.
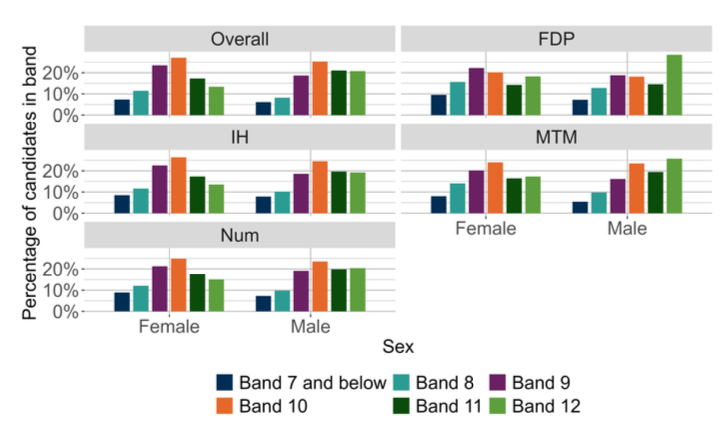
Overall, there was a small difference between the proportion of females and males achieving outcomes in band 12, with a higher proportion of males achieving an outcome in the top band.
For the organisers, the only notable difference was in 'Fractions, decimal fractions and percentages', which had a notable difference in band 12.
The 'Information handling', 'Money, time and measurement' and 'Number' organisers also had small differences between the proportion of females and males achieving outcomes in band 12. For these organisers there were no differences for all other bands, and there was no difference in the proportion of female and male learners in any other band for the 'Fractions, decimal fractions and percentages' organiser.
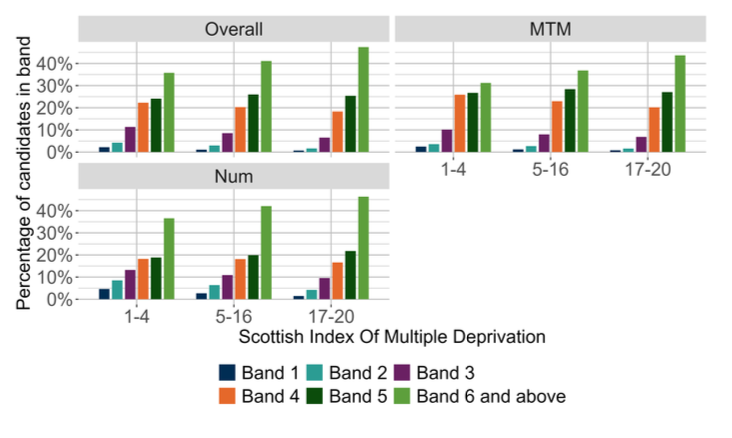
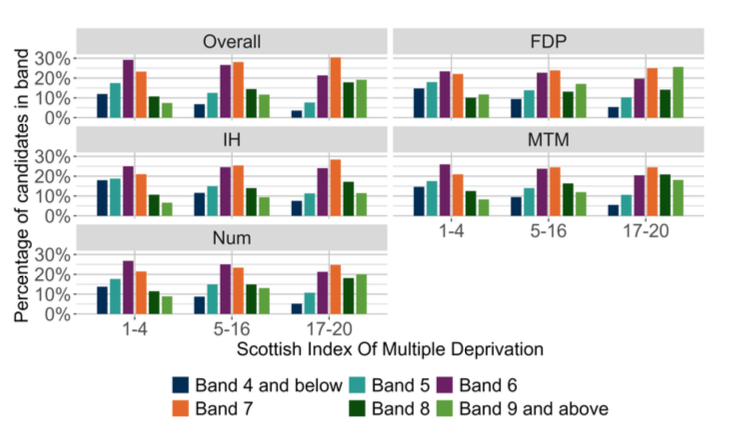
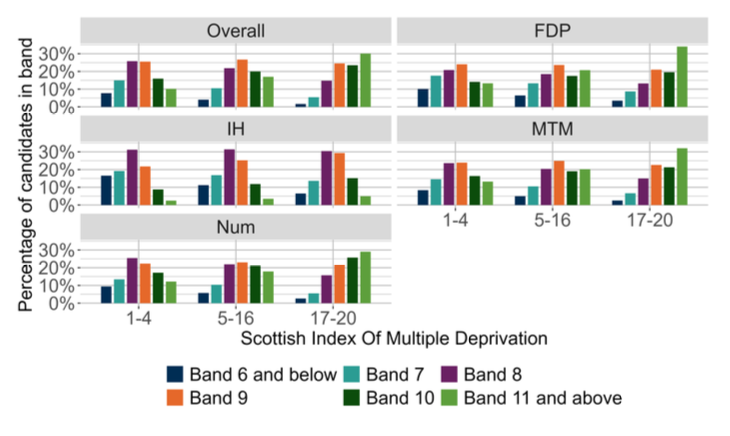
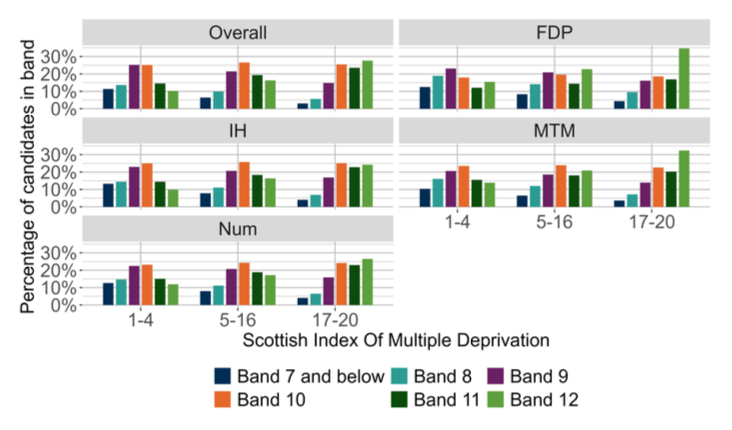
2.3.3 Scottish Index of Multiple Deprivation
This section reviews the distribution of learners for all stages across categories that reflect the Scottish Index of Multiple Deprivation (SIMD). To simplify the display of outcomes and aid their interpretation, we have divided the original 20 categories (vigintiles) into three combined categories of socio-economic background. These combined categories are: SIMD 1–4, indicating the lowest socio-economic quintile (that is, the most deprived children and young people, those in vigintiles 1 to 4); SIMD 5–16, indicating the three middle quintiles (vigintiles 5 to 16); and SIMD 17–20, indicating the highest socio-economic quintile (that is the least deprived children and young people, those in vigintiles 17 to 20).
Charts 3a to 3d show for each stage (P1, P4, P7 and S3), the proportions of learners achieving each capacity band for learners within these SIMD categories, for both overall outcomes and outcomes in each organiser.
At each stage, the proportion of learners with outcomes in the upper capacity band was largest among learners in the least deprived group (SIMD 17–20) and lowest in the most deprived group (SIMD 1-4). The reverse is true for the lowest capacity bands, where there was a higher proportion of learners from the most deprived group (SIMD 1-4) with these outcomes. These trends hold for numeracy overall and for outcomes by organiser.
The charts show that the differences in the numeracy outcomes for the most deprived and least deprived quintiles are more pronounced in later stages than at P1, where differences are comparatively small. At P1, the majority of learners across each SIMD group achieve outcomes in the mid to upper bands, whereas at later stages, most SIMD 1-4 learners achieve outcomes in the middle bands and most SIMD 17-20 learners achieve outcomes in the mid to upper bands.
2.3.4 Ethnic background
This section looks at differences in outcomes between learners from different ethnic backgrounds. Charts 4a to 4e show the percentages of learners in each of the major ethnic groups for P4. Outcomes for learners with missing or undisclosed ethnicity data are not included in the charts. A more granular breakdown of the number and percentages of learners in different ethnic groups who completed each assessment is available in Tables 13 to 16 in Appendix 6.
For the ethnicity outcomes, to allow for the presentation of data the MCNG ethnicity groupings differ from those used in SNSA where more granularity can be provided without identification of completers.
The outcomes show that, generally, there were only relatively small differences across the groups, both in terms of overall numeracy outcomes and when considering assessment outcomes regarding each of the organisers. For, generally, the middle bands were the outcome achieved by the greatest proportion of learners for each ethnic background.
At P4, learners from Mixed and multiple ethnic backgrounds and Asian backgrounds achieved outcomes in slightly higher proportions in the upper bands than the other major ethnic backgrounds. For the lower capacity bands, there were greater proportions of learners from Caribbean or Black and Other backgrounds achieving these outcomes.
In line with ONS guidelines the data for P1, P7 and S3 is not reported to avoid identifying individual learners.
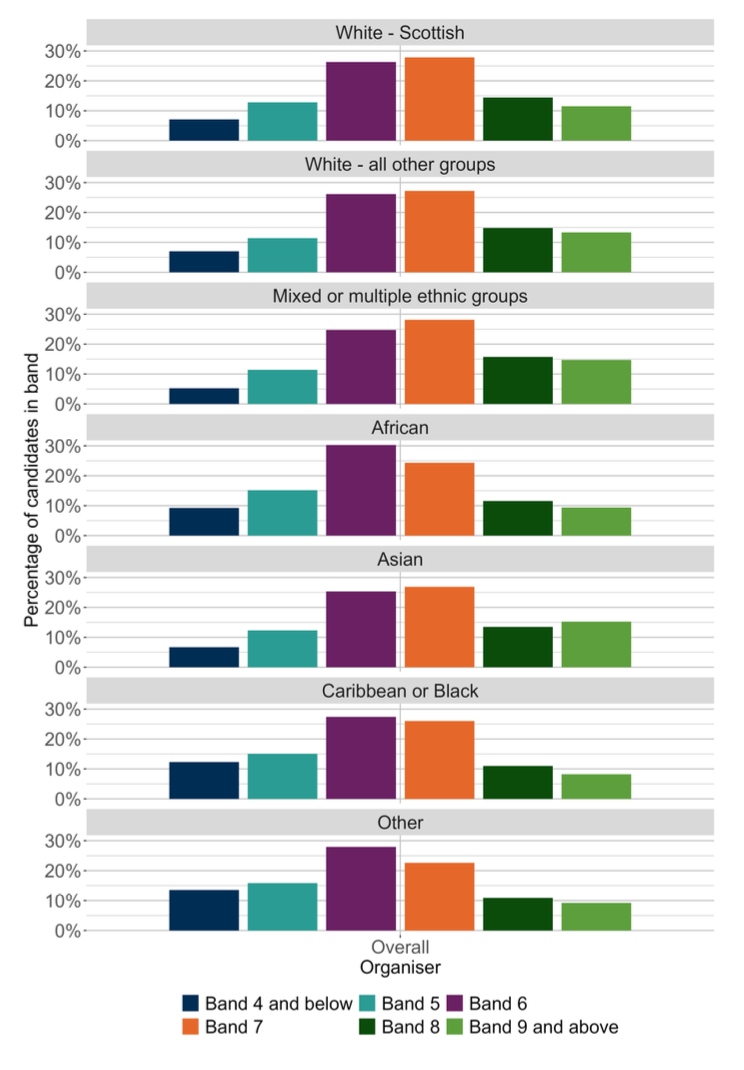
Overall, there were no notable differences between the proportions of learners from different ethnic backgrounds, but there were small differences in bands 4, 6, 7 and 9.
Across all ethnic background groups, the most frequently achieved bands were the middle bands (6 and 7).
There were proportionally more learners from Asian, Mixed or multiple ethnic and White - all other backgrounds achieving outcomes in the highest capacity band compared to the other ethnic groups presented.
There were proportionally more learners from Other and Caribbean or Black ethnic backgrounds achieving outcomes in the lowest capacity bands compared to the other ethnic groups presented.
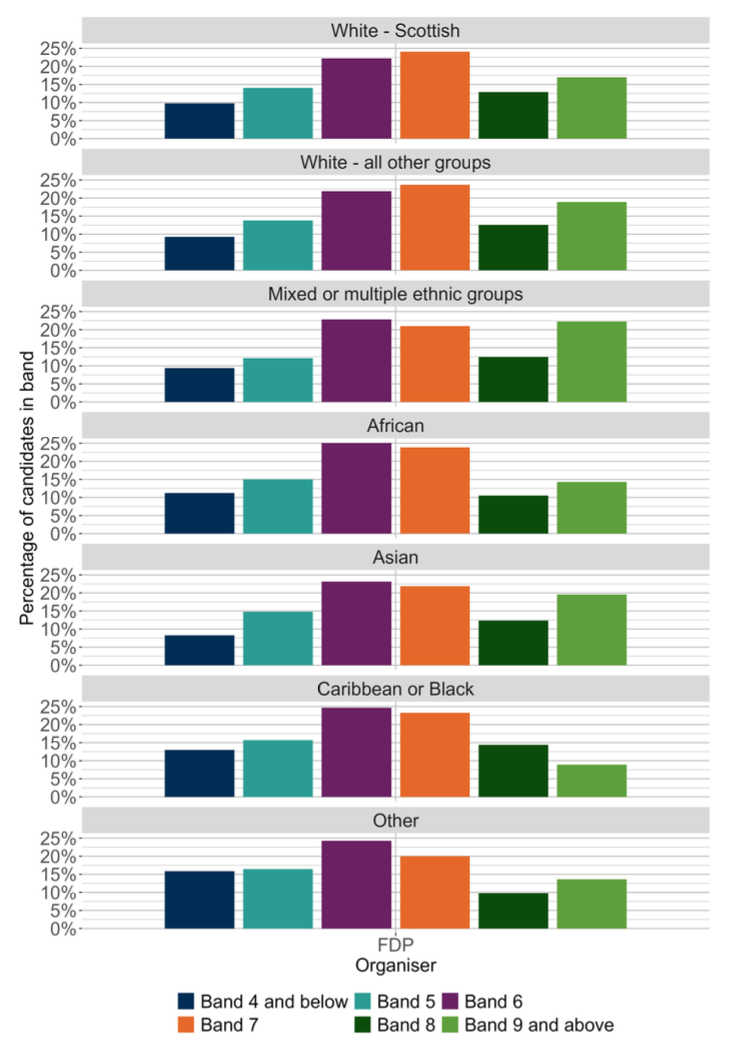
For the ‘Fractions, decimal fractions and percentages’ organiser, there was a notable difference between the proportion of learners from different ethnic backgrounds in band 9 and a small difference in band 4.
Across all ethnic background groups, the bands achieved by the largest proportion of learners were the middle bands (6 and 7).
There were proportionally more learners from Mixed or multiple ethnic and Asian ethnic backgrounds achieving outcomes in the highest capacity band compared to the other ethnic groups presented.
There were proportionally more learners from Other and Caribbean or Black ethnic backgrounds achieving outcomes in the lowest capacity bands compared to the other ethnic groups presented.
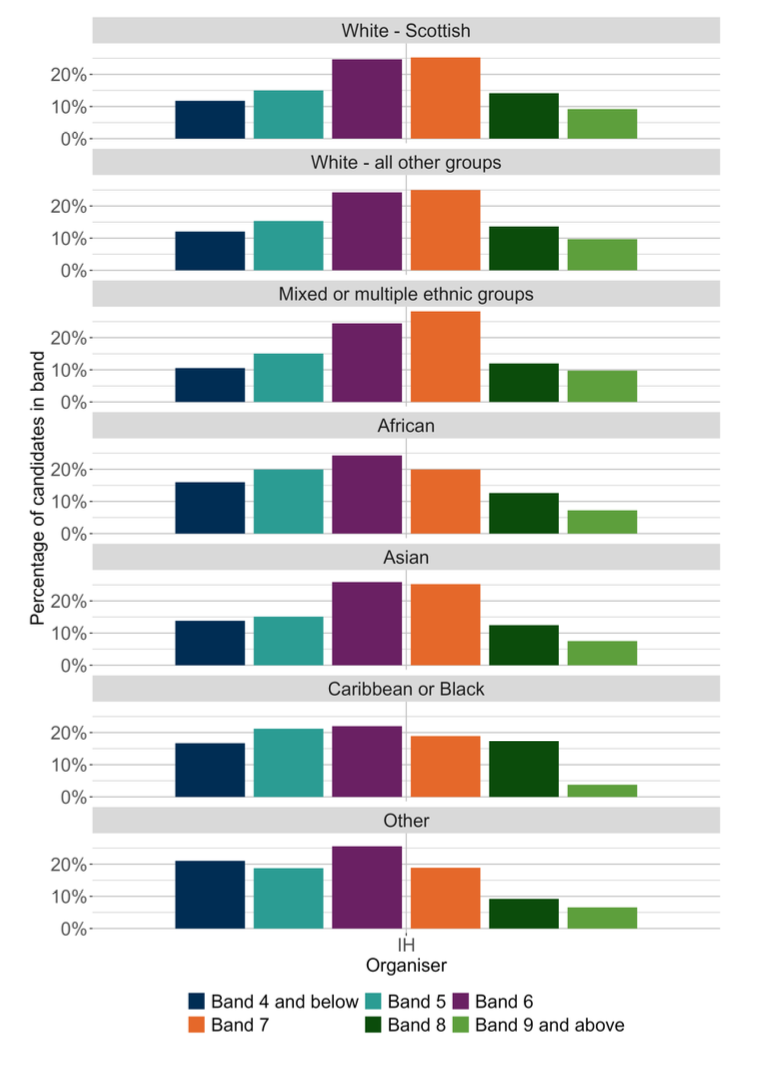
For the ‘Information handling’ organiser, there was a notable difference between proportions of learners from different ethnic backgrounds in band 4 and there were small differences in bands 5, 7, 8 and 9.
Across all ethnic background groups, the most frequently achieved bands were the middle bands (6 and 7).
There were proportionally more learners from Mixed or multiple ethnic, White - all other and White - Scottish ethnic backgrounds achieving outcomes in the highest capacity band compared to the other ethnic groups presented.
There were proportionally more learners from Other and Caribbean or Black ethnic backgrounds achieving outcomes in the lowest capacity bands compared to the other ethnic groups presented.
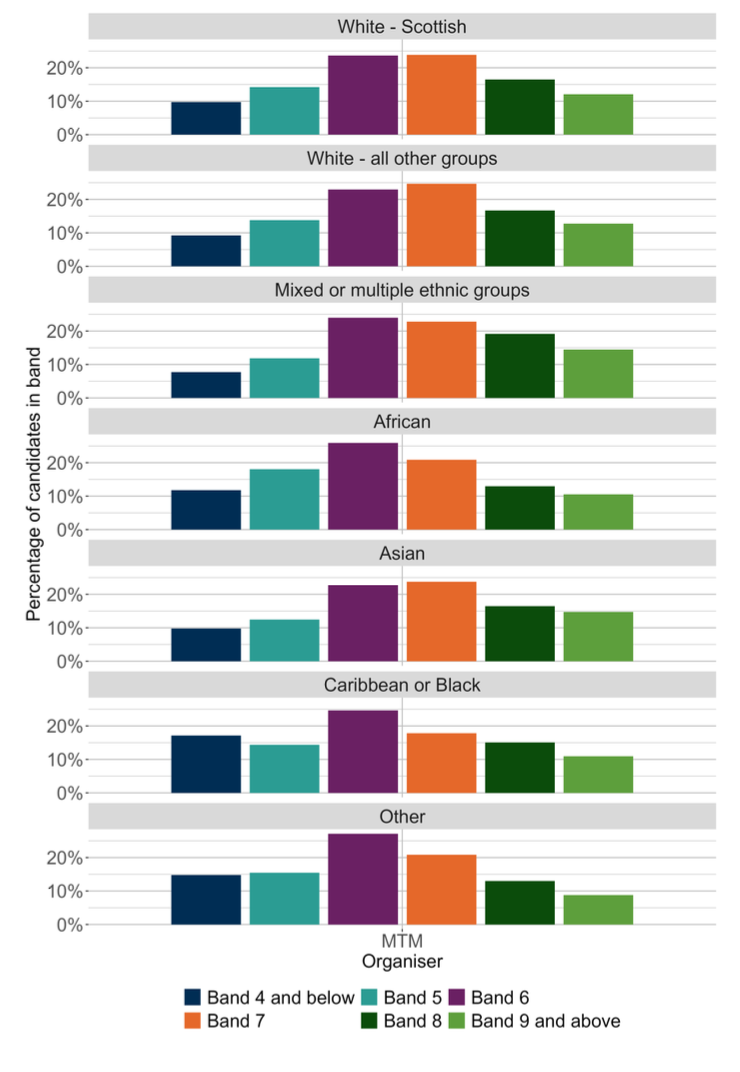
For the ‘Money, time and measurement’ organiser, there were no notable differences between the proportions of learners from different ethnic backgrounds.
Across all ethnic backgrounds, the bands achieved by the largest proportion of learners were the middle bands (6 and 7).
There were proportionally more learners from Asian, Mixed or multiple ethnic groups and White - all other groups ethnic backgrounds achieving outcomes in the highest capacity band compared to the other ethnic groups presented.
There were proportionally more learners from Caribbean or Black, Other and African ethnic backgrounds achieving outcomes in the lowest capacity bands compared to the other ethnic groups presented.
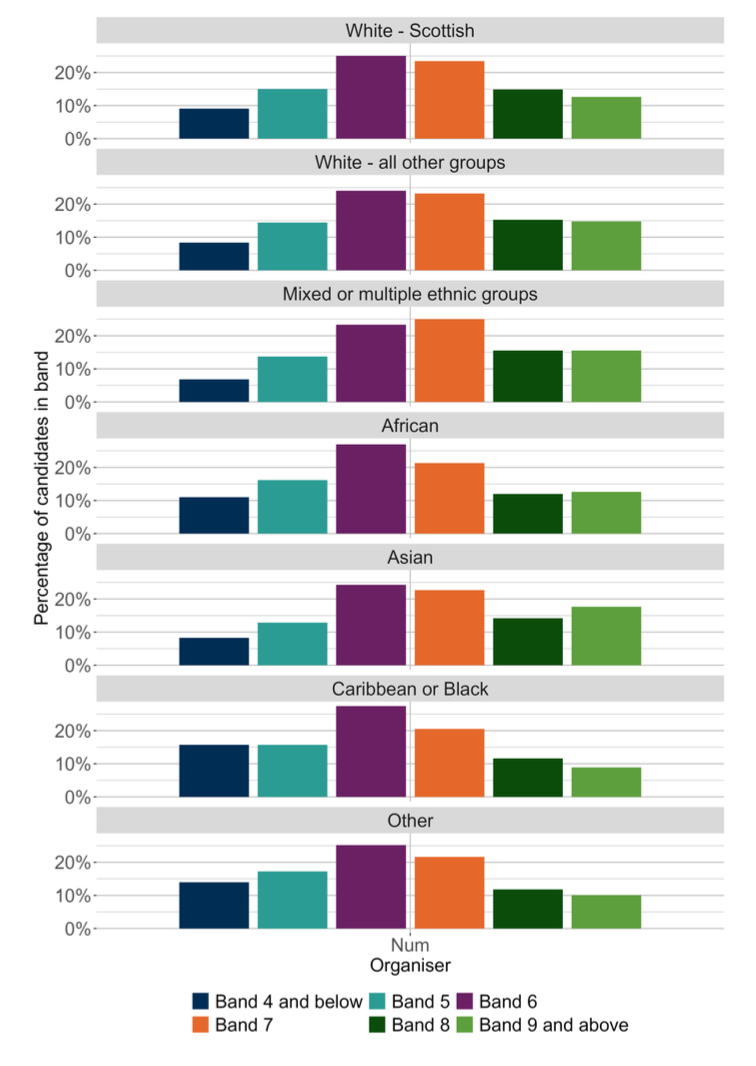
Across all ethnic background groups, the most frequently achieved bands were the middle bands (6 and 7).
There were proportionally more learners from Asian, Mixed or multiple ethnic groups and White - all other groups ethnic backgrounds achieving outcomes in the highest capacity band compared to the other ethnic groups presented.
There were proportionally more learners from Caribbean or Black and Other ethnic backgrounds achieving outcomes in the lowest capacity bands compared to the other ethnic groups presented.
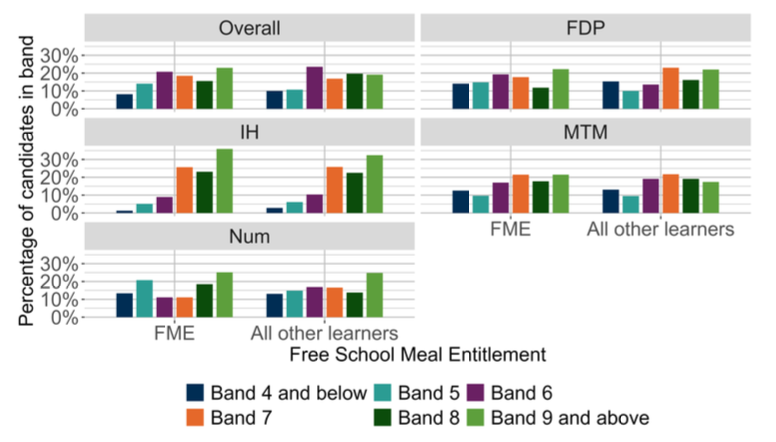
2.3.5 Free School Meal Entitlement
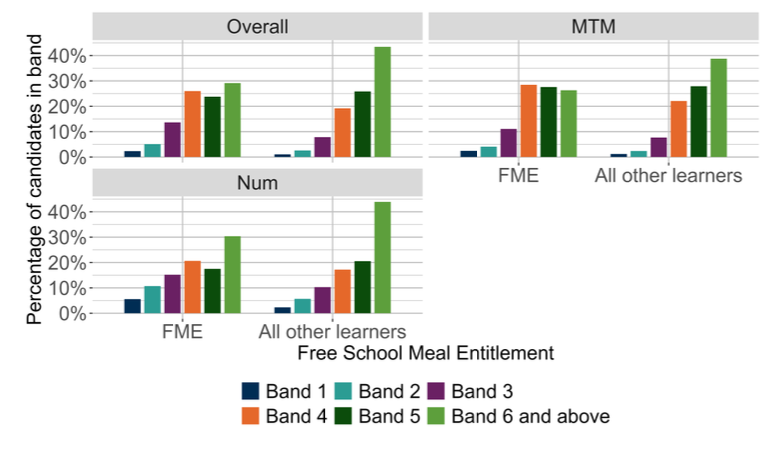
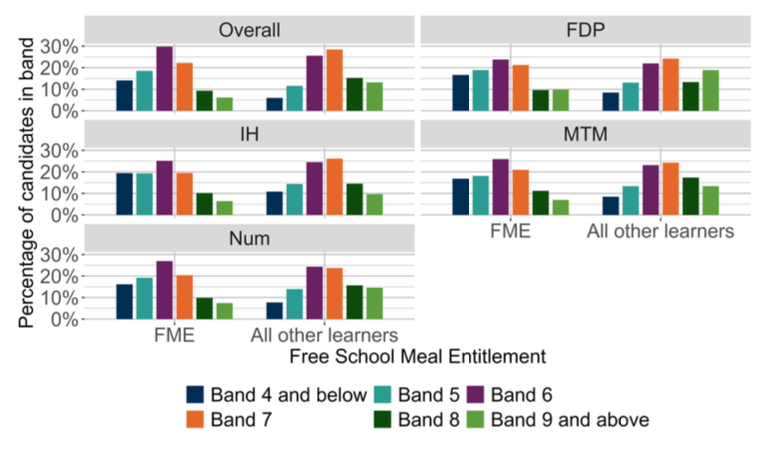
Charts 5a to 5d show numeracy outcomes of learners according to entitlement to free school meals (FME), distinguishing those with entitlement from all other learners, for each stage (P1, P4, P7 and S3). Outcomes are given for the overall outcomes and by organiser.
Across P1, P7 and S3, there were noticeably larger proportions with outcomes in the upper two capacity bands among learners not entitled to free school meals than among those with FME. Correspondingly, there were higher proportions of outcomes in the lower two capacity bands among learners with FME. This pattern was evident across each of these stages, both for numeracy overall and by organiser.
However, for the P4 year group, there were no notable or small differences between the proportion of 'All other learners' and 'FME' learners achieving outcomes in each band for both overall summaries and for each organiser.
At P1, approximately 70% of learners without FME had outcomes corresponding to the two upper bands compared with just over 50% of learners with FME. While the proportion achieving outcomes in the upper bands reduced for learners without FME in later stages, generally, the majority of learners still achieved outcomes in the three highest capacity bands, whereas the majority of learners with FME achieved outcomes in the lower three capacity bands.
Overall, there was a notable difference between the proportion of all other learners and learners that are entitled to FME achieving outcomes in band 6. There was no difference for all other bands.
There were notable differences between the proportions of all other learners and learners that are entitled to FME achieving outcomes in band 6 for the ‘Money, time and measurement’ and ‘Number’ organisers.
For P4, there were no notable differences between the proportion of all other learners and learners that are entitled to FME achieving outcomes in each band overall and for each organiser
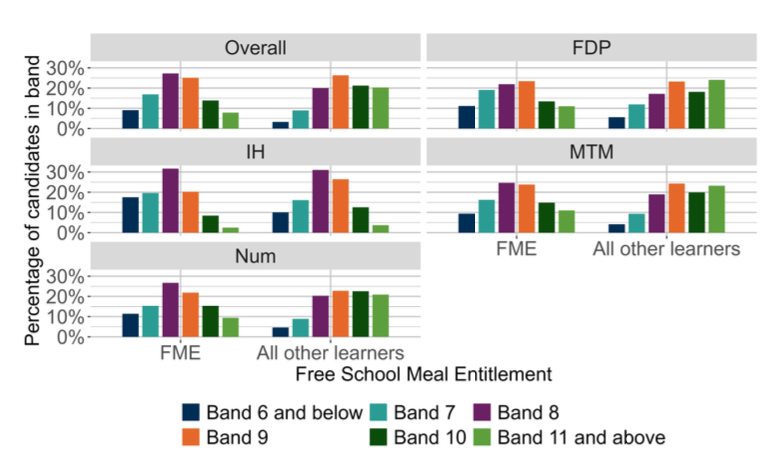
Overall, there was a notable difference between the proportion of all other learners and learners that are entitled to FME achieving outcomes in band 11. There was no difference for all other bands.
For each of the curricular organisers, there were notable differences between the proportion of all other learners and learners that are entitled to FME achieving outcomes in band 11.
There were no notable differences in any other band across all organisers.
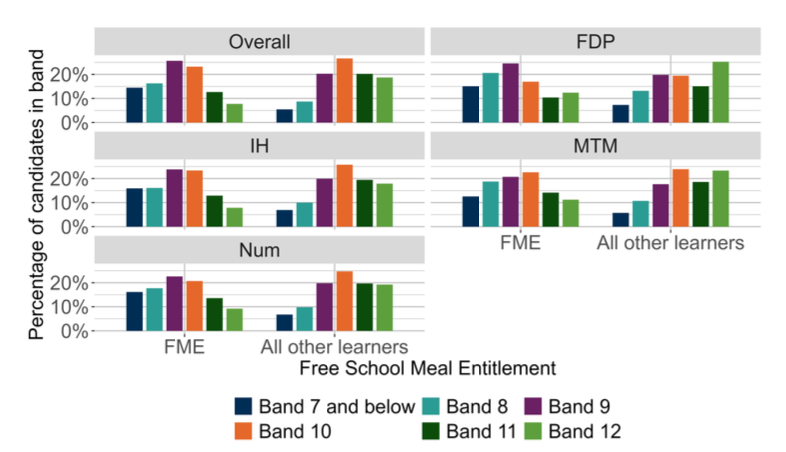
Overall, there was a notable difference between the proportion of all other learners and learners that are entitled to FME achieving outcomes in band 12. There was no difference for all other bands.
For each of the curricular organisers, there were notable differences between the proportion of all other learners and learners that are entitled to FME achieving outcomes in band 12.
There were no notable differences in any other band across all organisers.
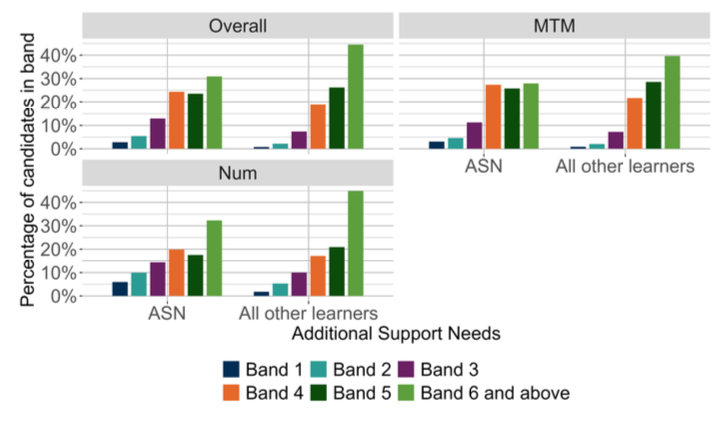
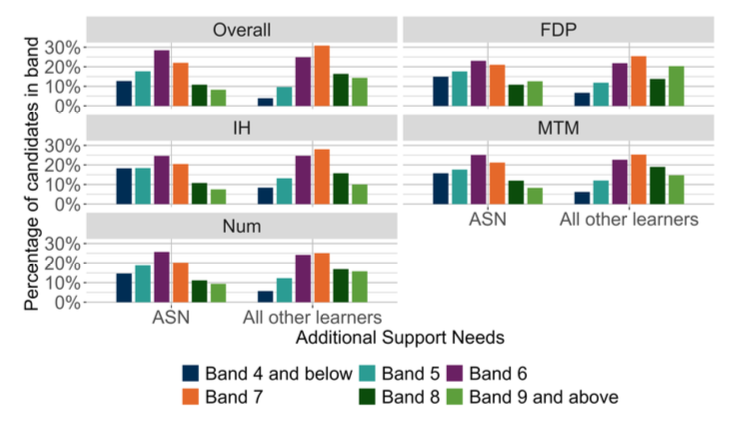
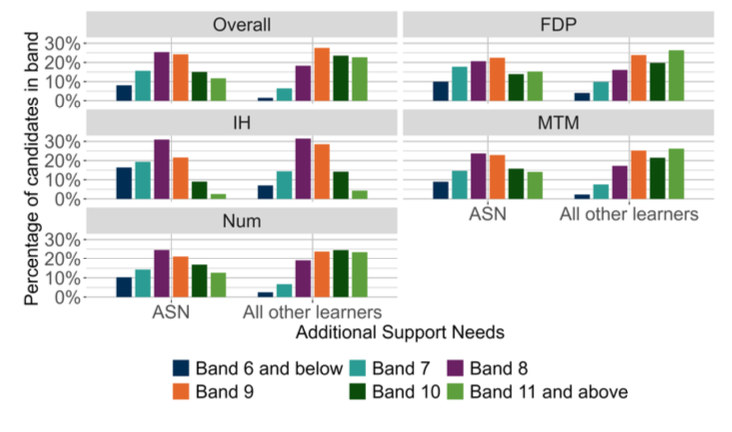
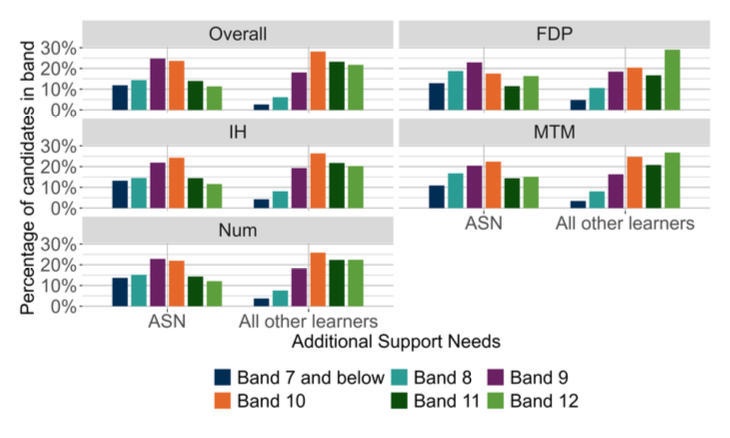
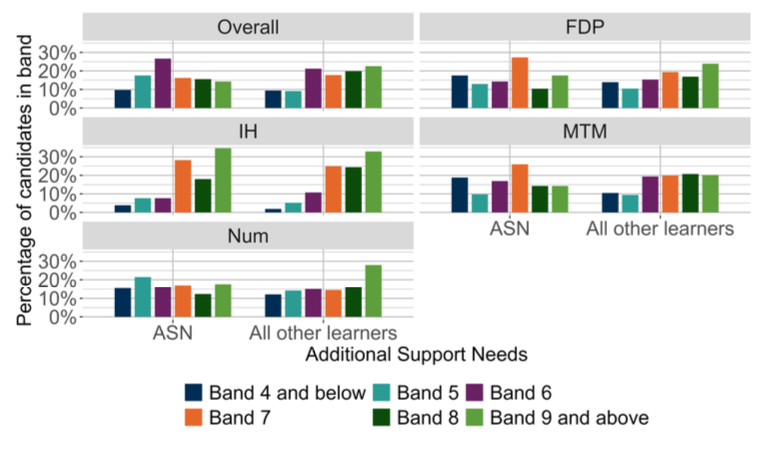
2.3.6 Additional Support Needs
Charts 6a to 6d show numeracy outcomes of learners according to whether or not learners were registered as learners with Additional Support Needs (ASN), distinguishing those registered as learners with ASN from all other learners, for each stage (P1, P4, P7 and S3). Outcomes are given for the overall outcomes and by organiser.
For all stages apart from P4, where the differences were much less pronounced across all bands, the proportions of learners in the two upper bands were notably larger among learners without ASN. Similarly, there were relatively larger proportions of learners with ASN in the two lower bands. These differences were similar for numeracy overall as well as when considering each organiser separately.
While in P1, differences between the proportions of learners with and without ASN in the two lower bands were somewhat less pronounced, at P4, P7 and S3, there tended to be just under 30 percent of learners with ASN in the two lower bands, compared to less than 15 percent of learners without ASN.
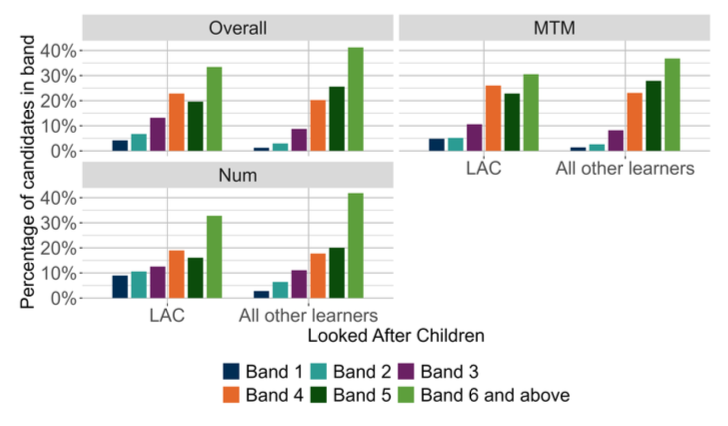
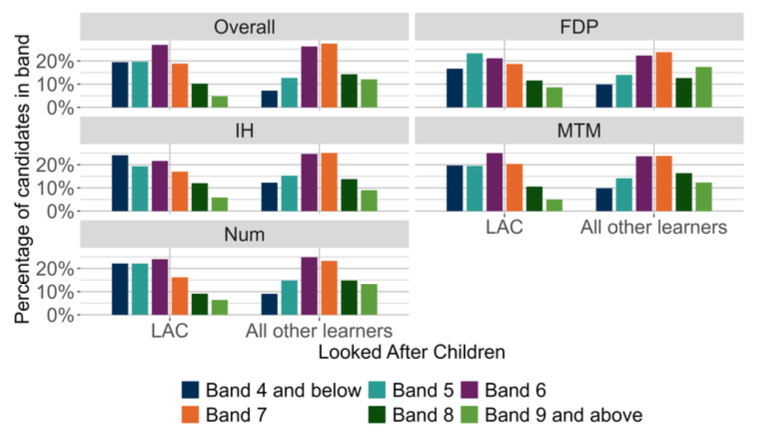
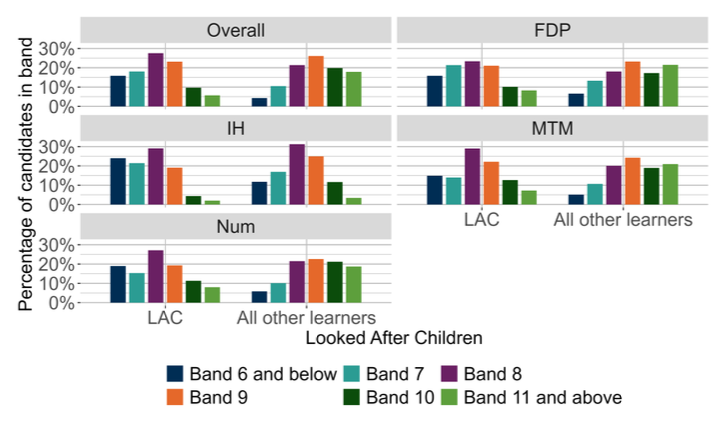
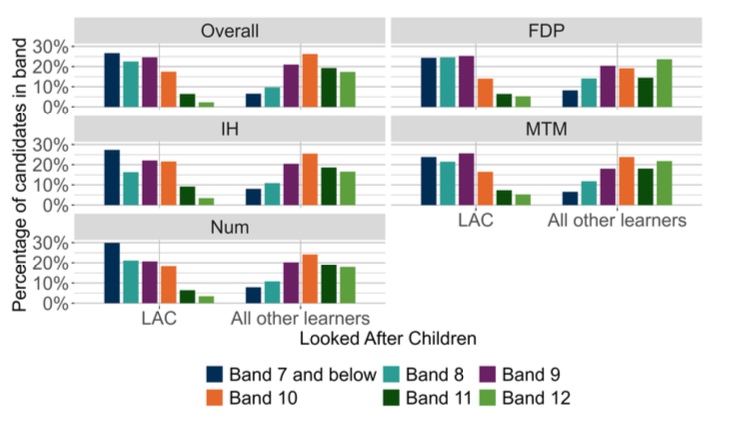
2.3.7 Looked After Children
Charts 7a to 7d show numeracy outcomes of learners according to whether or not learners were learners who were classified as Looked After Children (LAC) either at Home or Away from Home. The information was taken from the national database, SEEMiS, and compares LAC with all other learners, for each stage (P1, P4, P7 and S3). Outcomes are given for the overall outcomes and by organiser.
Across all stages, among learners classified as Looked After Children, smaller proportions achieved outcomes in the two upper capacity bands, compared to other learners without these classifications. This trend was least pronounced at P1, with the largest difference in outcome achievement seen in S3. Similarly, for the lower capacity bands, there was a higher proportion of learners classified as Looked After Children achieving these outcomes compared to all other learners. These patterns can be seen across stages and generally hold for organiser outcomes in addition to the overall summaries.
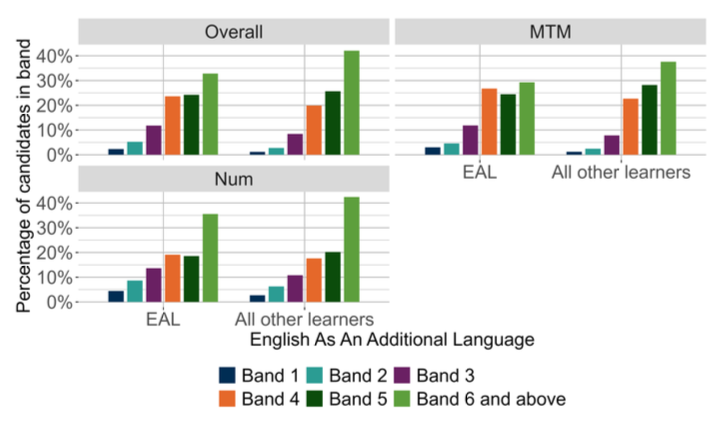
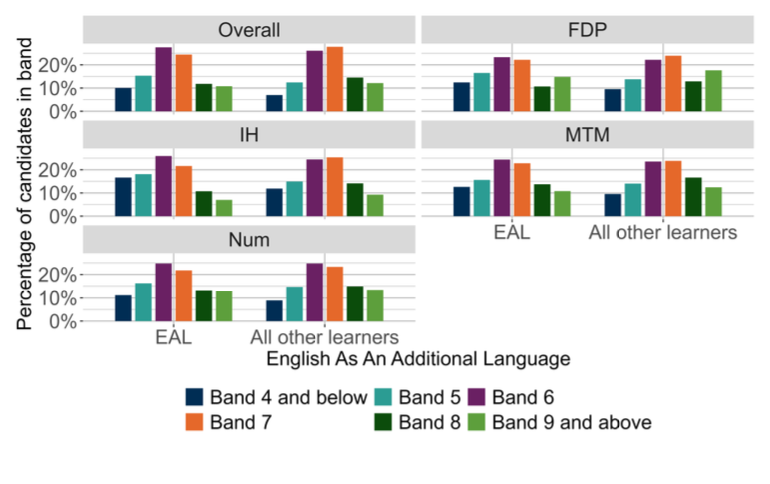
2.3.8 English as an Additional Language
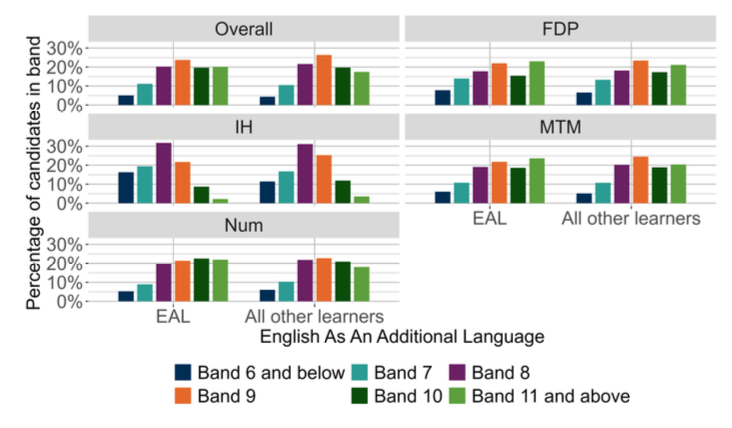
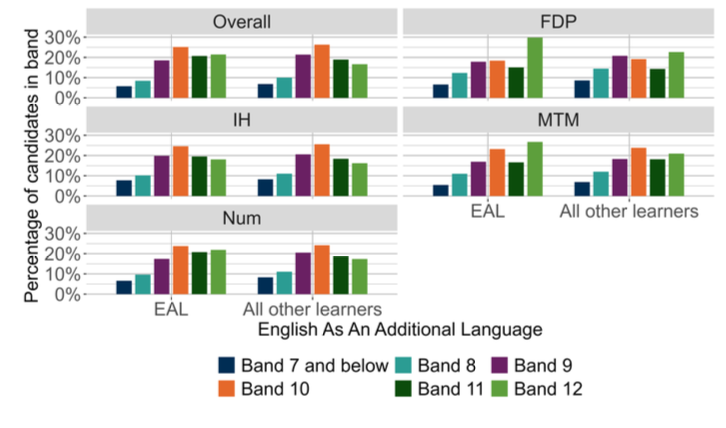
Charts 8a to 8d show numeracy outcomes of learners according to language background and compares English as an Additional Language (EAL) with all other learners, for each stage (P1, P4, P7 and S3). Outcomes are given for the overall outcomes and by organiser.
When comparing learners for whom English is an Additional Language (EAL) and those for whom English is their first language at P4, P7 and S3, we observed only relatively small differences in the proportion of learners achieving outcomes in the lowest two and highest two capacity bands. When comparing proportions in bands for each organiser, we observed very similar outcomes between the two groups, with only slightly larger proportions of learners who do not have English as their first language achieving outcomes in the highest two bands at S3.
At P1, differences between the two groups were larger than for the other stages, with greater proportions of EAL learners achieving outcomes in the lowest capacity bands than other learners and lower proportions achieving the higher capacity bands than other learners.
2.4 MCNG National outcomes for numeracy
2.4.1 Overall outcomes
Charts 9a and 9b show overall outcomes of P4 and P7 learners for Numeracy. Outcomes are given for the overall outcomes and by organiser. Where learners are presented with more than 5 items per organiser, they additionally show the outcomes of learners according to the knowledge organisers: Number (NUM), Fractions, Decimal fractions and Percentages (FDP), Measurement, Time and Money (MTM) and Information Handling (IH). The bars show outcomes across the six capacity bands that are specific to each stage, in line with MCNG reports for the academic year 2024 to 2025.
Please note that for all charts, a notable difference refers to a difference of 10 percent or more, a small difference refers to any difference between 5 percent and 10 percent.
Overall, for P4 and P7 the mid to upper bands were most frequently achieved.
In line with ONS guidelines the data for P1 and S3 is not reported to avoid identifying individual learners.
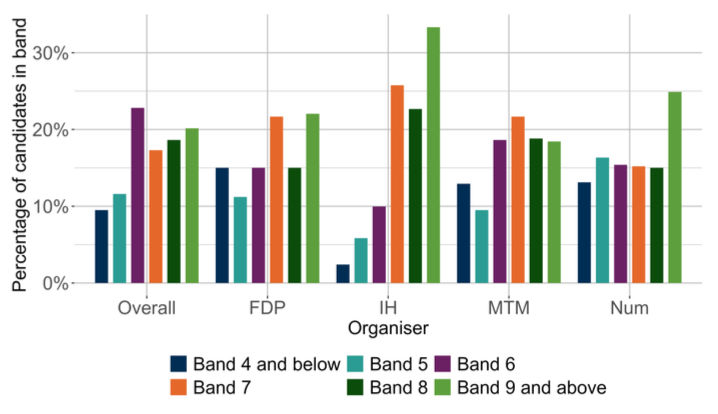
Overall, for P4, the band achieved by the largest proportion of learners was band 6, with 22.8% of learners achieving this band. The second most common band achieved by learners was band 9 and the band achieved by the smallest proportion of participants was band 4 with only 9.5% of learners scoring in this band. 51.7% of learners achieved bands 5 to 7 and 79.8% of learners achieved bands 4 to 8.
In the 'Fractions, decimal fractions and percentages' organiser, 77.9% of learners achieved bands 4 to 8 with band 9 achieved by the largest proportion of learners.
For the 'Information handling' organiser, 66.7% of learners achieved bands 4 to 8 and 100% of learners achieved bands 4 to 9. The largest proportion of learners achieve band 9 for this organiser.
For the 'Money, time and measurement' organiser, 81.6% of learners achieved bands 4 to 8. The modal band for this organiser differed from the overall summary, with the band achieved by the largest proportion of learners instead being band 7.
In the 'Number' organiser, 75.1% of learners achieved bands 4 to 8 with the band achieved by the largest proportion of learners being band 9.
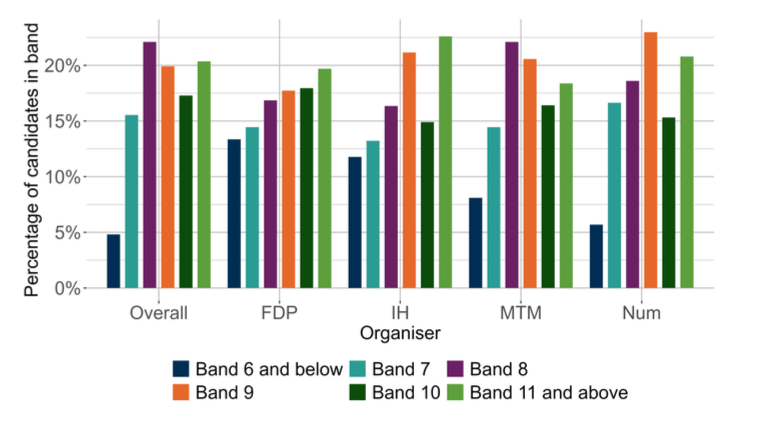
Overall, for P7, the band achieved by the largest proportion of learners was band 8, with 22.1% of learners achieving this band. The second most common band achieved by learners was band 11 and the band achieved by the smallest proportion of learners was band 6 with only 4.81% scoring in this band. Bands 7 to 9 were achieved by 57.5% of and 79.6% of learners achieved bands 6 to 10.
For the 'Fractions, decimal fractions and percentages' organiser, 80.3% of learners achieved bands 6 to 10. Band 11 was achieved by the largest proportion of learners.
For the 'Information handling' organiser, 50.7% of learners achieved bands 7 to 9 and 77.4% of learners achieved bands 6 to 10. The largest proportion of learners achieved band 11.
In the 'Money, time and measurement' organiser, 57.1% of learners achieved bands 7 to 9 and 81.6% of learners achieved bands 6 to 10. As with the overall summary, the 'Money, time and measurement' organiser had the largest proportion of learners achieving outcomes in band 8.
For the 'Number' organiser, 58.2% of learners achieved bands 7 to 9 and 79.2% of learners achieved bands 6 to 10. The band achieved by the largest proportion of learners was band 9.
2.4.2 Sex
Charts 10a and 10b show outcomes for male and female learners for P4 and P7. Outcomes are given for the overall outcomes and by organiser.
For 4, there was a notable difference between the proportion of females and males achieving outcomes in band 9 overall with, proportionally, more male learners achieving outcomes in this band than female learners. By P7 there was no difference between the proportion of female learners and male learners achieving the top band.
In line with ONS guidelines the data for P1 and S3 is not reported to avoid identifying individual learners.
2.4.3 Ethnic background
In line with ONS guidelines the data for P1, P4, P7 and S3 is not reported to avoid identifying individual learners.
2.4.4 Free School Meal Entitlement
For the P4 year group, there were no notable differences between the proportion of 'All other learners' and 'FME' learners achieving outcomes in each band for both overall summaries and for each organiser.
In line with ONS guidelines the data for P1, P7 and S3 is not reported to avoid identifying individual learners.
2.4.5 Additional Support Needs
Chart 12 shows writing outcomes of learners according to whether or not learners were registered as learners with Additional Support Needs (ASN), distinguishing those registered as learners with ASN from all other learners, for P4. Outcomes are given for the overall outcomes and by organiser.
For P4 learners, there was no notable difference overall, with small differences seen in some of the curricular organisers. between bands in the ‘Number’ organiser and small differences in the other organisers
In line with ONS guidelines the data for P1, P7 and S3 is not reported to avoid identifying individual learners.
2.4.6 Looked After Children
There are no Looked After Children in the MCNG data.
2.4.7 English as an Additional Language
In line with ONS guidelines the data for P1, P4, P7 and S3 is not reported to avoid identifying individual learners.