Publication - Progress report
National innovation strategy: scorecard - 2025 update
The national innovation strategy first published an innovation scorecard in 2023, tracking Scotland's performance against key metrics compiled from publicly available data. In the second annual update to the scorecard, Scotland’s innovation performance is compared to UK and global peers.
2. GERD (Gross Expenditure on R&D)
2.1 Ecosystem
- Investment
2.2 Performance Assessment
- Performance Worsening
2.3 Description
- Gross Expenditure on R&D (GERD) measures R&D expenditure investment in Business (BERD), Higher Education (HERD), Government (GovERD) and Charity (PNP) sector and is a proxy for total R&D spend. This is expressed as a percentage of GDP to allow for regional and international comparisons.
- R&D and related concepts follow internationally agreed OECD definitions, as published in the Frascati Manual (2015). GERD is the OECD preferred measure of R&D activity for international comparisons.
- Also tracked for insight and analysis are the main GERD sub-categories of Business Enterprise R&D spend (BERD), Higher Education R&D spend (HERD), and Government R&D spend (GovERD).
2.4 UK Regional Benchmark for GERD Main Sub-categories
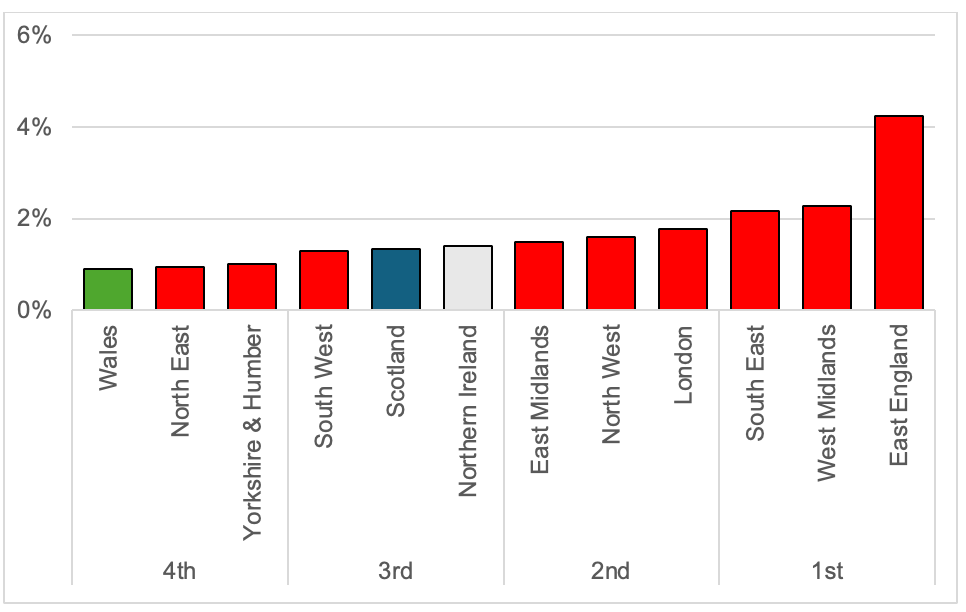
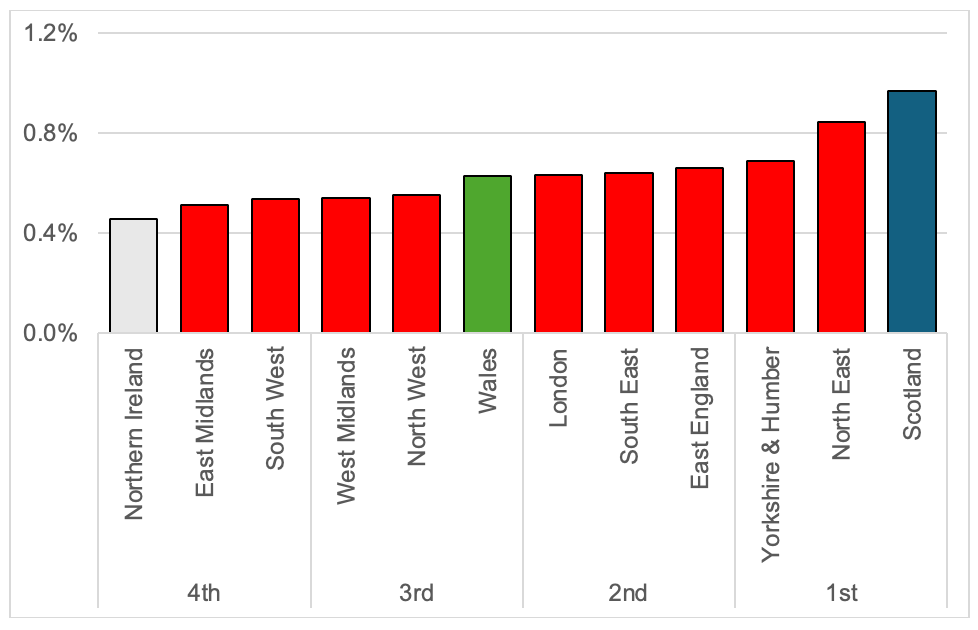
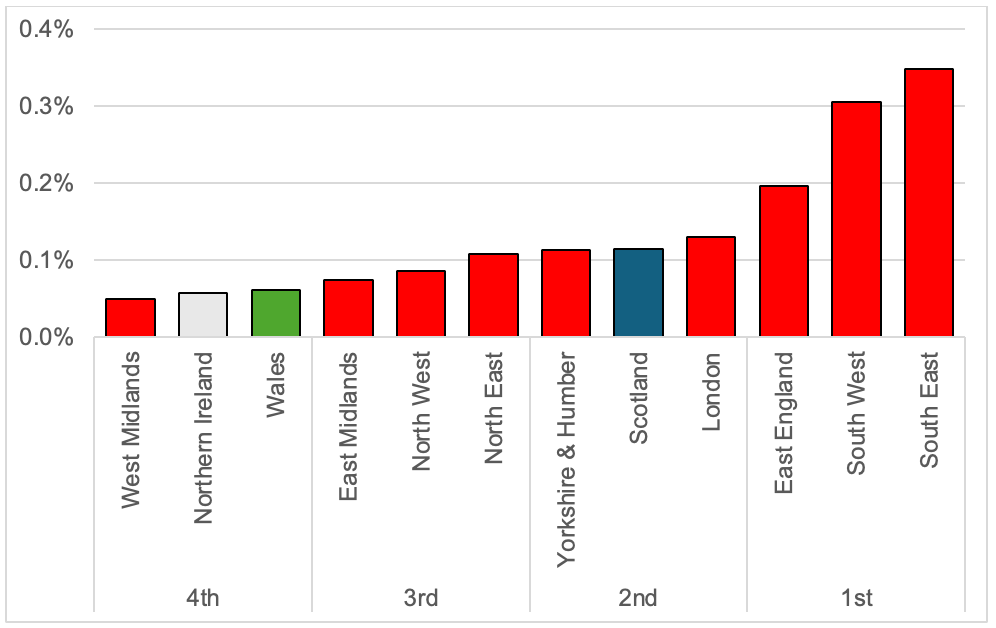
- Whilst a full regional breakdown for GERD is unavailable (as ONS have withheld some data), Scotland is in 3rd, 1st, and 2nd quartiles for BERD (1.34% in 2023), HERD (0.97%), GovERD (0.11%) respectively.
2.5 Current Performance
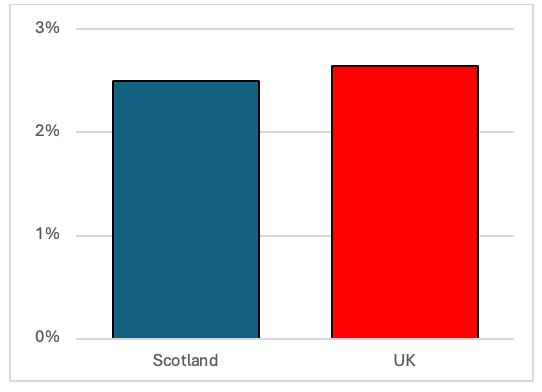
- GERD fell in Scotland from 2.58% of GDP in 2022 to 2.5% in 2023.
- The fall was driven primarily by weaker Business Enterprise R&D expenditure, the only category of GERD which fell in absolute terms, and as a percentage of GDP.
2.6 Previous Year and Time Series
| R&D as % of GDP | 2023 | 2022 |
|---|---|---|
| GERD | 2.50% | 2.58% |
| BERD | 1.34% | 1.43% |
| HERD | 0.97% | 0.98% |
| GovERD | 0.11% | 0.10% |
2.7 UK Regional Benchmark
- Regional breakdown is unavailable due to withheld data. On GERD, Scotland (2.50%) is below UK (2.64%).
2.8 International Benchmark
- EU27 average GERD is 2.13% and OECD is 2.70%.
- Scotland 14th & UK 13th in OECD countries (2nd quartile).
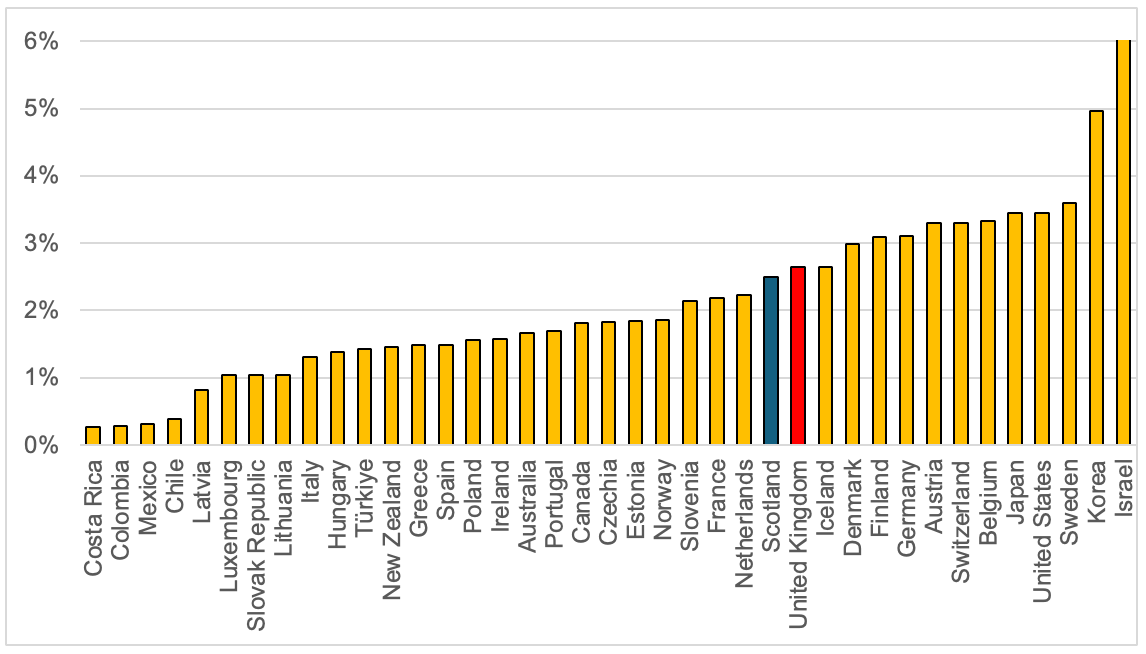
Source: OECD
*Latest data for Australia, Chile, Colombia, Costa Rica, Mexico, NZ & Switzerland
2.9 About the Data
- Current Dataset: Scottish Government (SG): Gross expenditure on research and development Scotland - 2023 (released 10 September 2025)
- Next Release: To be announced (Expected August 2026)
Contact
Email: innovation@gov.scot