National Improvement Framework - future of insight consultation: response summary and next steps
A summary of responses and next steps following the consultation on the future of Insight.
Annex A – Consultation Questions and Response Statistics
The data below sets out the consultation questions and results from those who responded via the online platform Citizen Space. Not all respondents answered every question presented.
Part one:
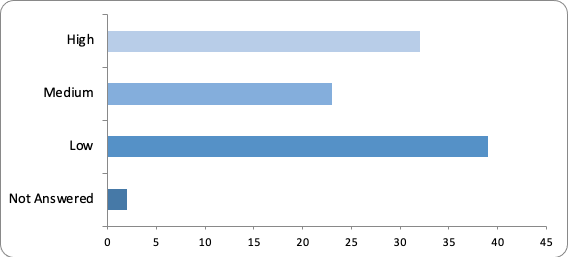
Proposal 1.1: Increase the volume of awards and achievement recognised on the SCQF, included in Insight.
There were 96 responses to this part of the question.
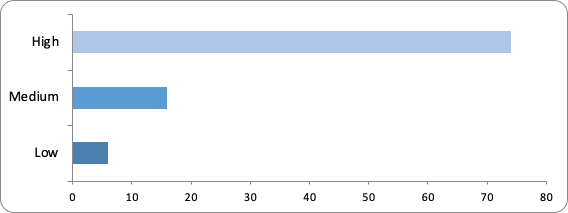
| Option | Total | Percent |
|---|---|---|
| High | 74 | 77.08% |
| Medium | 16 | 16.67% |
| Low | 6 | 6.25% |
| Not Answered | 0 | 0.00% |
Proposal 1.2 : Include achievement or awards not recognised on the SCQF.
There were 96 responses to this part of the question.
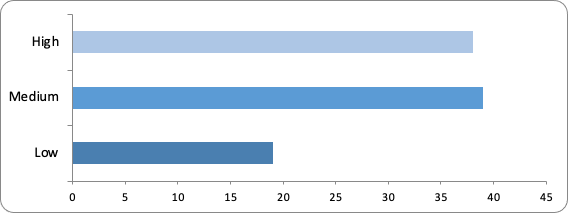
| Option | Total | Percent |
|---|---|---|
| High | 38 | 39.58% |
| Medium | 39 | 40.62% |
| Low | 19 | 19.79% |
| Not Answered | 0 | 0.00% |
Proposal 1.3 : Carry out further developmental work and consultation on the inclusion of special schools in Insight.
There were 92 responses to this part of the question.
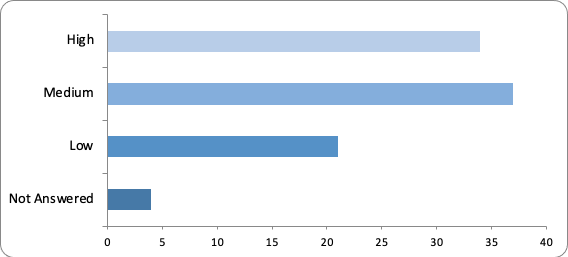
| Option | Total | Percent |
|---|---|---|
| High | 34 | 35.42% |
| Medium | 37 | 38.54% |
| Low | 21 | 21.88% |
| Not Answered | 4 | 4.17% |
Proposal 1.4 : Reflect the recommendations made by the ASL review (Morgan Review) within Insight.
There were 85 responses to this part of the question.
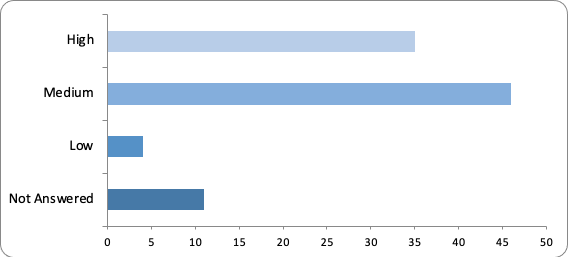
| Option | Total | Percent |
|---|---|---|
| High | 35 | 36.46% |
| Medium | 46 | 47.92% |
| Low | 4 | 4.17% |
| Not Answered | 11 | 11.46% |
Proposal 2.1 : Consider the place of Insight and the data it includes on wider achievement as part of wider consideration of the generation of core school leaver attainment statistics.
There were 94 responses to this part of the question.
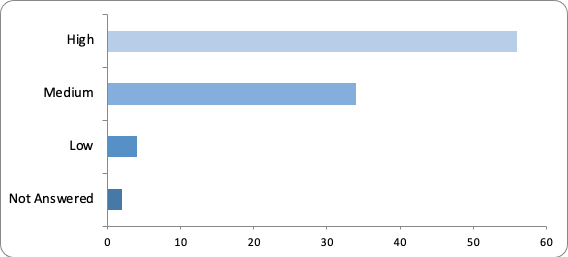
| Option | Total | Percent |
|---|---|---|
| High | 56 | 58.33% |
| Medium | 34 | 35.42% |
| Low | 4 | 4.17% |
| Not Answered | 2 | 2.08% |
Proposal 2.2 : Work across agencies to understand various data needs.
There were 94 responses to this part of the question.
| Option | Total | Percent |
|---|---|---|
| High | 50 | 52.08% |
| Medium | 33 | 34.38% |
| Low | 11 | 11.46% |
| Not Answered | 2 | 2.08% |
Proposal 2.3 : Ensure that Insight fits with the current educational landscape.
There were 96 responses to this part of the question.

| Option | Total | Percent |
|---|---|---|
| High | 75 | 78.12% |
| Medium | 16 | 16.67% |
| Low | 5 | 5.21% |
| Not Answered | 0 | 0.00% |
Proposal 3.1 : Explore options for extending Insight:
There were 92 responses to this part of the question.
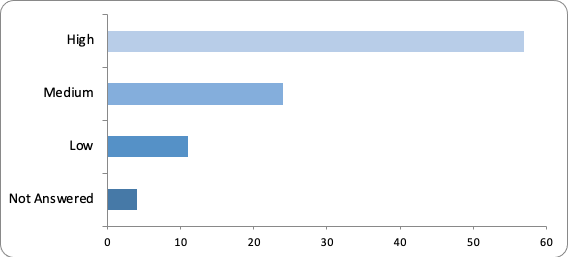
| Option | Total | Percent |
|---|---|---|
| High | 57 | 59.38% |
| Medium | 24 | 25.00% |
| Low | 11 | 11.46% |
| Not Answered | 4 | 4.17% |
Proposal 4.1 : Refresh the user interface to be more intuitive and easy to use.
There were 92 responses to this part of the question.
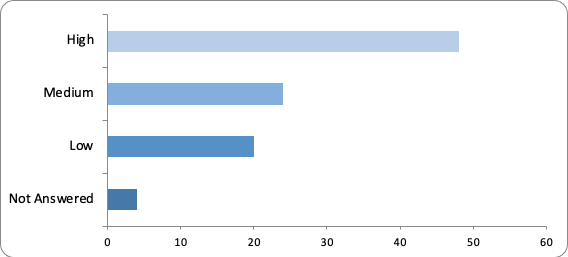
| Option | Total | Percent |
|---|---|---|
| High | 48 | 50.00% |
| Medium | 24 | 25.00% |
| Low | 20 | 20.83% |
| Not Answered | 4 | 4.17% |
Proposal 4.2 : Amend the default settings within Insight.
There were 94 responses to this part of the question.
| Option | Total | Percent |
|---|---|---|
| High | 32 | 33.33% |
| Medium | 23 | 23.96% |
| Low | 39 | 40.62% |
| Not Answered | 2 | 2.08% |
Part two
1: Where do you work?
There were 95 responses to this part of the question.
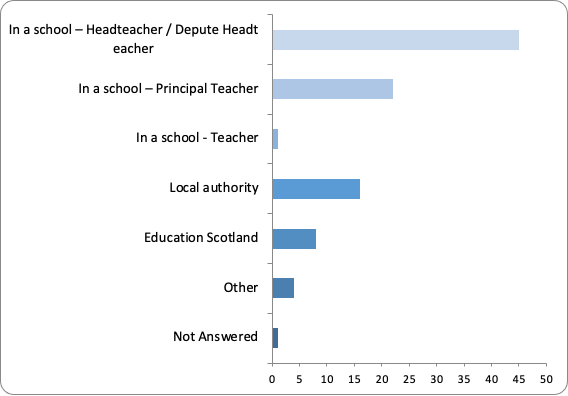
| Option | Total | Percent |
|---|---|---|
| In a school – Headteacher / Depute Headteacher | 45 | 46.88% |
| In a school – Principal Teacher | 22 | 22.92% |
| In a school - Teacher | 1 | 1.04% |
| Local authority | 16 | 16.67% |
| Education Scotland | 8 | 8.33% |
| Scottish Government | 0 | 0.00% |
| Other | 4 | 4.17% |
| Not Answered | 1 | 1.04% |
2: How often do you use Insight?
There were 95 responses to this part of the question.
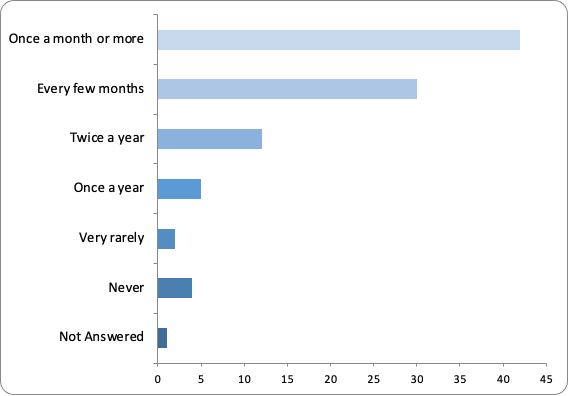
| Option | Total | Percent |
|---|---|---|
| Once a month or more | 42 | 43.75% |
| Every few months | 30 | 31.25% |
| Twice a year | 12 | 12.50% |
| Once a year | 5 | 5.21% |
| Very rarely | 2 | 2.08% |
| Never | 4 | 4.17% |
| Not Answered | 1 | 1.04% |
3: If you rarely or never engage with Insight can you tell us why not?
There were 15 responses to this part of the question.
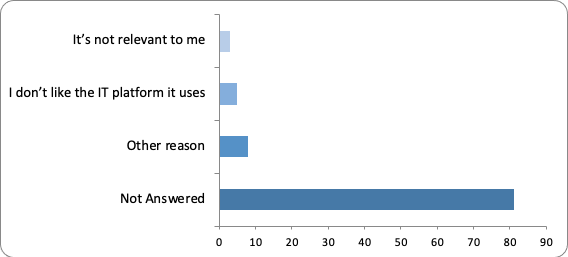
| Option | Total | Percent |
|---|---|---|
| It’s not relevant to me | 3 | 3.12% |
| I don’t like the IT platform it uses | 5 | 5.21% |
| Other reason | 8 | 8.33% |
| Not Answered | 81 | 84.38% |
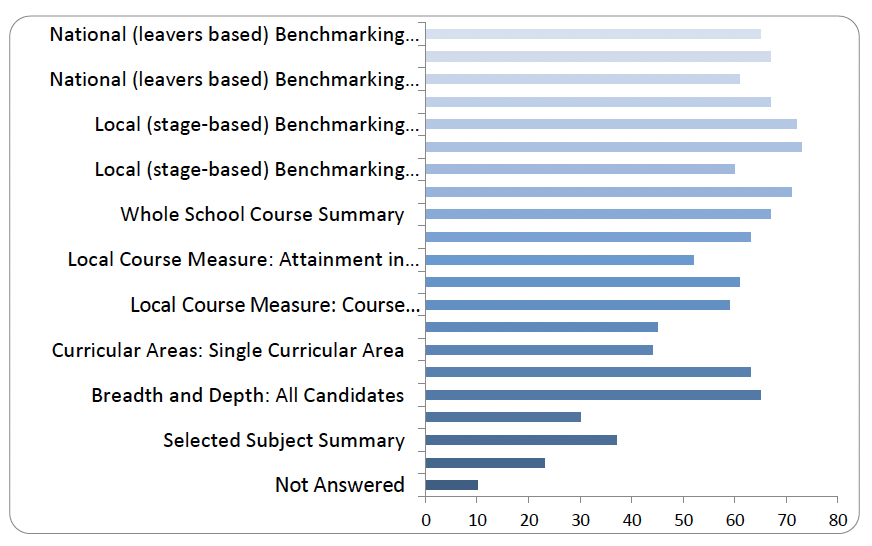
4: Which of the following features of Insight do you currently use?
There were 86 responses to this part of the question.
| Option | Total | Percent |
|---|---|---|
| National (leavers based) Benchmarking Measure: Improving Attainment for All | 65 | 67.71% |
| National (leavers based) Benchmarking Measure: Attainment versus Deprivation | 67 | 69.79% |
| National (leavers based) Benchmarking Measure: Leaver Initial Destinations | 61 | 63.54% |
| National (leavers based) Benchmarking Measure: Literacy and Numeracy | 67 | 69.79% |
| Local (stage-based) Benchmarking Measure: Improving Attainment for All | 72 | 75.00% |
| Local (stage-based) Benchmarking Measure: Attainment versus Deprivation | 73 | 76.04% |
| Local (stage-based) Benchmarking Measure: Candidate Initial Destinations | 60 | 62.50% |
| Local (stage-based) Benchmarking Measure: Literacy and Numeracy | 71 | 73.96% |
| Whole School Course Summary | 67 | 69.79% |
| Local Course Measure: Attainment in Selected Graded Course - Percentage of Resulted Entries | 63 | 65.62% |
| Local Course Measure: Attainment in Selected Ungraded Course | 52 | 54.17% |
| Local Course Measure: Course Comparator - Selected Graded Course | 61 | 63.54% |
| Local Course Measure: Course Comparator – All Graded Courses | 59 | 61.46% |
| Curricular Areas: All Curricular Areas | 45 | 46.88% |
| Curricular Areas: Single Curricular Area | 44 | 45.83% |
| Breadth and Depth: Leavers | 63 | 65.62% |
| Breadth and Depth: All Candidates | 65 | 67.71% |
| Partnership Course Summary | 30 | 31.25% |
| Selected Subject Summary | 37 | 38.54% |
| Learning Partners | 23 | 23.96% |
| Not Answered | 10 | 10.42% |
5: For each box that you selected in Q4, what do you use it for? Is there anything you would like to change about this measure?
What do you use it for?
There were 66 responses to this part of the question.
Is there anything you would like to change about this measure?
There were 38 responses to this part of the question.
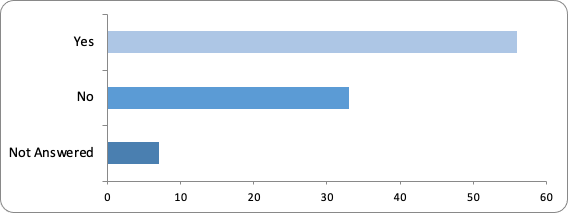
6: Do you use Insight data to measure progress towards local stretch aims?
There were 89 responses to this part of the question.
| Option | Total | Percent |
|---|---|---|
| Yes | 56 | 58.33% |
| No | 33 | 34.38% |
| Not Answered | 7 | 7.29% |
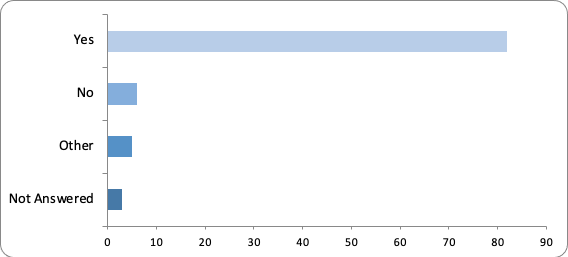
7: Do you understand the methodology used in constructing the Virtual Comparator?
There were 93 responses to this part of the question.
| Option | Total | Percent |
|---|---|---|
| Yes | 82 | 85.42% |
| No | 6 | 6.25% |
| Other | 5 | 5.21% |
| Not Answered | 3 | 3.12% |
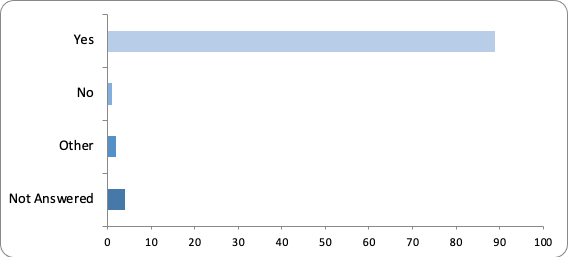
8: Do you understand what it means if your school is performing statistically significantly better than their Virtual Comparator? (e.g. if a commentary is displayed beneath chart)
There were 92 responses to this part of the question.
| Option | Total | Percent |
|---|---|---|
| Yes | 89 | 92.71% |
| No | 1 | 1.04% |
| Other | 2 | 2.08% |
| Not Answered | 4 | 4.17% |
9: Does it have any impact on the actions you would take if you find out your school is statistically significantly better or worse than their Virtual Comparator in a particular measure (rather than just knowing how many points/what percentage they are above or below their Virtual Comparator)?
There were 85 responses to this part of the question.

| Option | Total | Percent |
|---|---|---|
| Yes | 66 | 68.75% |
| No | 19 | 19.79% |
| Not Answered | 11 | 11.46% |
10: Have you used the Learning Partnership feature within Insight?
There were 91 responses to this part of the question.
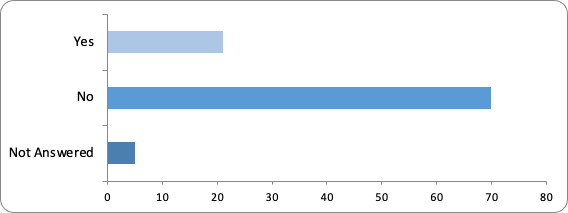
| Option | Total | Percent |
|---|---|---|
| Yes | 21 | 21.88% |
| No | 70 | 72.92% |
| Not Answered | 5 | 5.21% |
How could these best support improvement going forward? Please explain your answer
There were 28 responses to this part of the question.
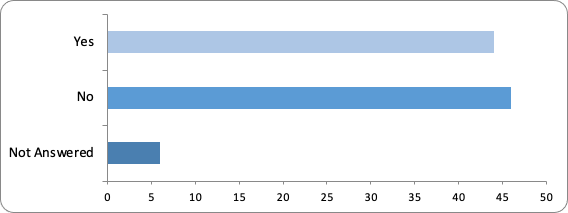
11: Are there other features that you would like to see included within Insight that could support school improvement?
There were 78 responses to this part of the question.
| Option | Total | Percent |
|---|---|---|
| Yes | 44 | 45.83% |
| No | 34 | 35.42% |
| Not Answered | 18 | 18.75% |
12: What BGE ACEL data do you use?
Please explain your answer
There were 74 responses to this part of the question.
13: Would you use BGE ACEL data if it was in Insight? (for example it may be possible to add a feature where you can look at the performance of your S4/5/6 cohort who achieved 2nd level at the end of P7 against versus those who didn’t)
There were 88 responses to this part of the question.
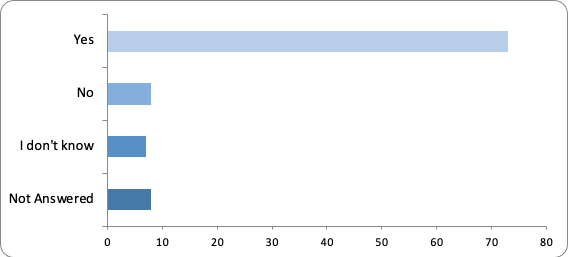
| Option | Total | Percent |
|---|---|---|
| Yes | 73 | 76.04% |
| No | 8 | 8.33% |
| I don't know | 7 | 7.29% |
| Not Answered | 8 | 8.33% |
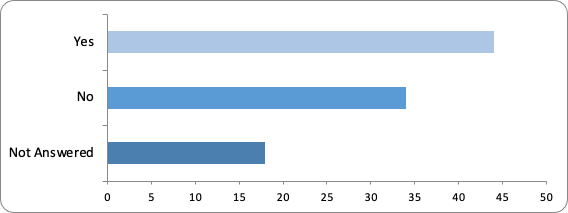
14: Do you use the BGE Benchmarking Tool?
There were 90 responses to this part of the question.
| Option | Total | Percent |
|---|---|---|
| Yes | 44 | 45.83% |
| No | 46 | 47.92% |
| Not Answered | 6 | 6.25% |
15: If you selected no to Q14, why not?
There were 41 responses to this part of the question.
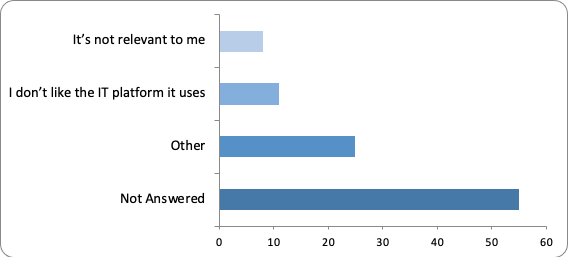
| Option | Total | Percent |
|---|---|---|
| It’s not relevant to me | 8 | 8.33% |
| I don’t like the IT platform it uses | 11 | 11.46% |
| Other | 25 | 26.04% |
| Not Answered | 55 | 57.29% |
If you selected other, please explain your answer
There were 34 responses to this part of the question.
16: If you selected yes to Q14, do you think the BGE Tool (or the data it includes) should be accessible within Insight?
There were 59 responses to this part of the question.
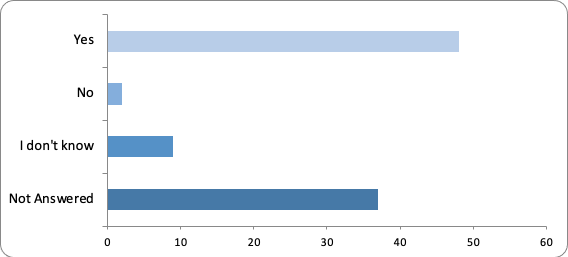
| Option | Total | Percent |
|---|---|---|
| Yes | 48 | 50.00% |
| No | 2 | 2.08% |
| I don't know | 9 | 9.38% |
| Not Answered | 37 | 38.54% |