National Electrofishing Programme for Scotland (NEPS) 2021: analysis
The National Electrofishing Programme for Scotland (NEPS) is a statistical survey design that ensures collection of unbiased data on the density and status of salmon and the pressures that affect them, including water quality and genetic introgression. This report presents the latest analysis.
Materials and Methods
NEPS Survey design 2021
The NEPS survey design that operated in 2018 and 2019 was intended to run for nine years (see Malcolm et al., 2019b for details). However, greater than expected demand for over samples (replacement samples for sites that could not be fished) in some regions determined that a new survey design was required for 2021. Given the ongoing challenges around COVID-19 and the need to progress a survey at short notice it was decided that the 2021 survey design would operate for a single year, with a new multi-year design to follow in future years.
Consistent with previous years, NEPS 2021 was an unequal probability Generalised Random Tessellation Stratified (GRTS) survey design where sample site selection was weighted towards areas where higher juvenile salmon densities were expected (based on the Benchmark model predictions from Malcolm et al., 2019a). The target population encompasses all rivers that are accessible to Atlantic salmon (i.e. below barriers to migration), where there are registered fisheries and where sampling by wading and electrofishing is possible. Samples were assigned to strata, which were typically regional aggregations of rivers, although in some cases additional strata were created for logistic reasons or to investigate particular issues where additional local resource allowed (Malcolm et al., 2020, see below).
Following feedback from local fisheries managers the sample frame, i.e. the approximate spatial representation of the target population, was extended from Strahler river orders (a hierarchical measure of stream size) 2-4, to include larger 5th order rivers in selected regions. This was not universally possible and depended on the regionally varying characteristics of rivers (e.g. depths and velocities) and their history of anthropogenic modification (e.g. channelisation, dredging) which can make access and sampling difficult or unsafe. In some situations local fisheries managers also identified new barriers or physical constraints to salmon access and this information was used to remove upstream river segments from the sample frame (Fig. 1).
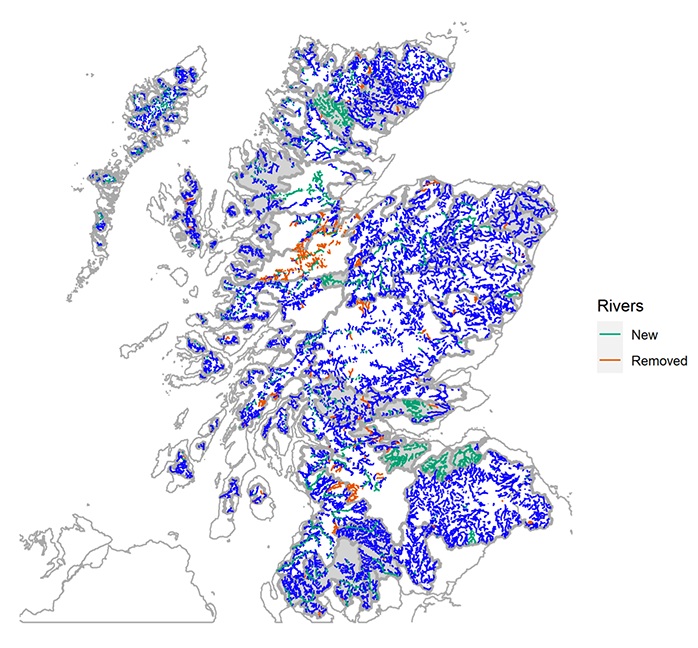
Figure 1 Map showing changes to the NEPS strata and sample frame between 2018-19 and 2021 surveys. Polygons with thick grey outlines indicate 2021 strata. Light grey shaded polygons indicate changes to NEPS strata between 2018-19 and 2021. Blue lines indicate rivers that were included in both survey designs. Blue-green lines indicate rivers that were added to the sample frame in 2021. Orange lines indicate rivers that were removed from the sample frame in 2021.
The 2021 survey design sought to maintain regional sample numbers at levels consistent with the previous surveys except where additional local resources were available to supplement core funding. In 2018-19 reporting regions and strata covered the same geographic area. However, changes were made to strata boundaries in 2021 to address local reporting requirements or to improve spatial consistency with fisheries management organisations, the latter creating challenges for the allocation and management of over samples. New strata were created for the Forth region to improve assessment in the area and to monitor the outcomes of barrier removal work. This was supported by the addition of substantial new resource from the Forth Rivers Trust which doubled the number of samples in the region (from 30 to 60 sites). New strata were also established to monitor salmon populations above Shin dam and Spey dam. Both of these sub-catchments are above barriers that are categorised as impassable by SEPA and thus did not appear in the earlier survey design, although constrained passage of salmon is possible. Monitoring above Shin dam was supported by Kyle of Sutherland Fisheries Trust. There was no monitoring above Spey dam in 2021, although such monitoring would be possible in the future. Changes to the strata were also made to allow for separate strata covering Brora and Helmsdale; Ythan and Ugie; Skye and Lochalsh, and Wester Ross. A small change was also made to the Galloway strata to include the river Urr (Fig. 1). The final survey design consisted of 36 strata and 855 samples of which 810 were funded (at least in part) centrally.
Electrofishing data
Full details of the electrofishing sampling protocols for NEPS are provided elsewhere (Malcolm et al., 2019b). However, in brief, electrofishing was undertaken by local fisheries managers following standard operating procedures developed for NEPS. All electrofishing data were area delimited (the surveyed area was measured for each site) with a target date for sampling between 01 July and 30 September. Approximately a third of sites were fished using three passes, while two thirds of sites were fished with a single pass. The effort expended on the first pass of the multi-pass electrofishing and the single pass electrofishing should be the same. Basic habitat information was recorded at each site, and water quality samples were collected for analysis at MSS-FFL (Marine Scotland Science, Freshwater Fisheries Laboratory). Genetic samples were obtained from 30 salmon parr at all sites to assess levels of genetic introgression from farmed fish. Data were stored in the Marine Scotland Science Fish Observation (FishObs) database, making use of the FishObs Data Processing Utility (DPU) for data entry.
Generation of covariates for electrofishing sites
GIS proxies for habitat (gradient, altitude, river distance to sea, percentage conifer in riparian zone) are required as predictor variables for both the capture probability and benchmark models. Covariates were generated for every node on the Digital River Network (DRN) that represented the sample frame, and for all electrofishing sites using an in-house R package (FFL GIS) and scripts following the methods described by Jackson et al. (2017) and Malcolm et al. (2019a) where further details can be found.
Estimating capture probability
Capture probability for juvenile salmon and trout was estimated following the methods described by Millar et al. (2016) and Malcolm et al. (2019a). The capture probability model was fitted to a dataset that included previously published multi-pass electrofishing data collected across Scotland between 1997- 2015 (Malcolm et al. 2019a), ad-hoc data collected between 2016 and 2017 and new data collected under NEPS in 2018, 2019 and 2021. Capture probability was modelled as a logistic function of covariates representative of people and equipment (Organisation-Team), fish size and behaviour (Lifestage and electrofishing Pass / run), time (Year and Day of the Year, DoY), habitat (e.g. Altitude, Upstream Catchment Area, UCA; River Distance to Sea, RDS; and Gradient), land use (Conifer, Deciduous and Mixed trees, Urban area) and geographical region (Hydrometric Area, HA). The term Organisation (as an indicator of staff) was divided into broad time periods (Organisation Team) to reflect major organisational changes identified from an assessment of staff names / abbreviations identified in the SFCC database and available web-based materials.
Model selection followed a step-up-down procedure starting from a large model that included a 3-way interaction between Species, Lifestage and Pass, a multi-level factor for Year, two level factor for Urban area (essentially presence / absence) and smoothed main effects for the other continuous variables. The model scope (maximum possible model complexity) allowed for 4-way interactions between Species, Lifestage, Pass and the other covariates. The step-up-down procedure also allowed for the multi-level factor for Year to be replaced by a smooth or linear expression for Year. In some cases it was not possible to estimate capture probability for individual Organisation - Teams due to small samples sizes. In these circumstances it was necessary to group teams within a region or adjacent time period (e.g. Nairn 2019 was grouped with Nairn, Findhorn and Lossie Fisheries Trust 2018).
Estimating site-wise (observed) salmon and trout densities
Fish densities were estimated for each species, lifestage and electrofishing site following the methods described by Glover et al. (2018) and Malcolm et al. (2019a). In brief:
where ∑countpass n is the total fish count for each species / lifestage combination across all passes and
Pcum = 1 - (1 - P1) * (1 - P2) * (1 - P3)
is the cumulative capture probability across all passes (in the example above 3 passes) and Pn denotes the fitted capture probability for pass n (where n can be pass 1,2,3). To ensure consistency with the benchmark models, wetted area measured at the time of electrofishing was used to represent the site area.
Site-wise benchmark densities (salmon only)
Site-wise benchmark densities were calculated for salmon, for each electrofishing site, using GIS derived habitat proxies (see covariate generation above) and the national juvenile salmon density benchmark model reported by Malcolm et al. (2019a, Fig. 2). Benchmark densities were calculated separately for fry and parr life-stages and represent the densities that would be expected on average for a particular habitat (site location) free from anthropogenic pressures (Malcolm et al., 2019). Because the sample frame for 2021 included some larger 5th order rivers, which were not well represented in the original benchmark dataset, upstream catchment areas were capped at 250 km2 in the prediction model to prevent unrealistically high estimates of benchmark abundance.
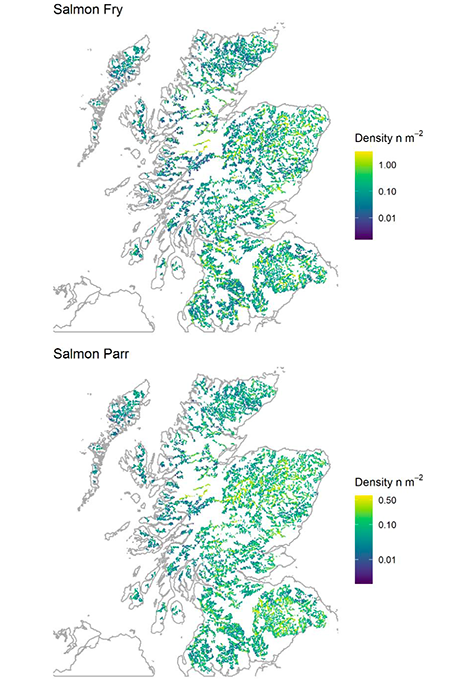
Figure 2 Map showing benchmark density predictions for salmon fry (upper panel) and parr (lower panel) for the NEPS 2021 sample frame. The effects of upstream catchment area on predicted densities have been constrained by capping upstream catchment areas at 250km2. For further details of the benchmark model see Malcolm et al. (2019).
Scaling benchmark densities to region (salmon only)
The regional-scale benchmark for salmon fry and parr was calculated by obtaining a benchmark estimate of expected salmon densities and river length for each of the digitised river segments in the sample frame. Benchmark densities were predicted for upstream and downstream river nodes. In circumstances where these nodes had the same river order, the segment benchmark was the geometric mean of the two. Where the downstream node had a higher river order to the upstream node (e.g. a small tributary entering a larger river) then upstream benchmark predictions were assigned to the edge to avoid over inflating benchmark estimates for the segment.
Regional benchmark estimates were thus calculated as follows:
where Edge Benchmark is the density estimate for each river segment (edge) in the DRN and Edge Length is the length of each line feature (m). Consistent with site-wise estimates of the benchmark, upstream catchment area was capped at 250km2 when making predictions.
Scaling site-wise observed densities to region
The R package "spsurvey" (Kincaid et al., 2020) was used to both design and analyse data from the NEPS monitoring programme. Sample weights were adjusted to reflect the final list of sampled locations (i.e. removing sites that were not sampled and including replacement over samples). Analysis was conducted using the "cont.analysis" function for continuous data. Separate analyses were performed for each survey year. The response variable was the site-wise observed densities (n m-2 wetted area). Wetted area densities were chosen as these provided greatest consistency with the benchmark. The "cont.analysis" function estimates the mean density (per unit length of sample frame) in each strata, together with associated two-sided 90% confidence intervals (i.e. one-sided 95% confidence intervals). It can also be used to combine estimates over strata e.g. for national scale or regional estimates matching with previous surveys.
Analysis of NEPS data at varying spatial scales
By combining strata or post-stratifying data it is possible to analyse the NEPS data for areas that were not individual strata in the survey design. This allowed: 1. data from NEPS 2021 to be compared to similar surveys in 2018-19 through the removal of 5th order rivers and aggregation of strata where appropriate; and 2. estimates of juvenile density for different Strahler river orders.
Regional assessments of status for salmon (grades)
Since 2016, Scottish rivers have received one of three conservation grades associated with an adult assessment method (Marine Scotland, 2020c). These grades are based on the probability of meeting a spatially varying egg deposition target indicative of maximum sustainable yield (Conservation Limit). Results are averaged over a 5-year period to prevent any single poor year from bringing down the status of the river (Marine Scotland, 2020c). The grades are associated with particular management advice (below). Importantly category 3 rivers (the poorest grading) are associated with compulsory catch and release and preclude the killing of salmon.
- Category 1: Exploitation is sustainable therefore no additional management action is currently required. This recognises the effectiveness of existing non-statutory local management interventions.
- Category 2: Management action is necessary to reduce exploitation: catch and release should be promoted strongly in the first instance. The need for mandatory catch and release will be reviewed annually.
- Category 3: Exploitation is unsustainable therefore management actions required to reduce exploitation for 1 year i.e. mandatory catch and release (all methods).
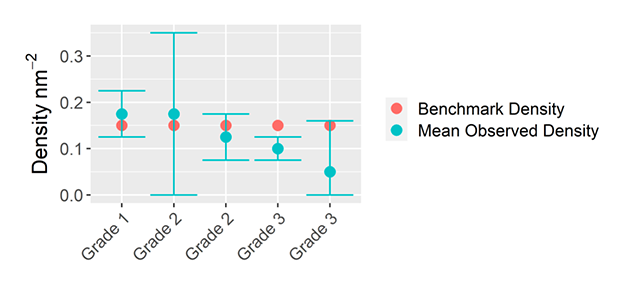
It is possible to obtain status assessments for fry and parr through a similar approach by comparing the regional estimates of mean salmon density (per unit length of river), obtained from the GRTS sampling, with the benchmark regional densities (Malcolm et al., 2019a) to assess how likely it is that a particular area meets its benchmark. Small changes were made to the classification method for NEPS 2021 in comparison to previous years.
- Category 1: The mean density estimate exceeds the benchmark and the lower one-sided 95% confidence interval does not include zero
- Category 2: The mean density estimate exceeds the benchmark but the lower one-sided 95% confidence interval includes zero, or the mean density estimate exceeds 50% of the benchmark and the upper one-sided 95% confidence limit includes the benchmark.
- Category 3: The mean density estimate exceeds 50% of the benchmark but the upper 1-sided 95% confidence limit is below the benchmark, or the mean density estimate is less than 50% of the benchmark
The grades for the two life stages are then combined to provide a single juvenile assessment grade for each year. The combined status favours the better of the two life stage assessments, reflecting the ability of populations to rebound from a single year of poor recruitment. Strong evidence is required that both life stages are failing to meet the benchmark before obtaining a grade 3 categorisation (Fig. 4)
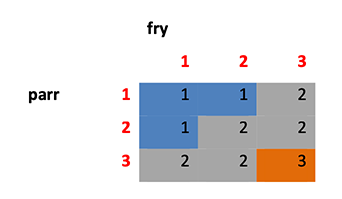
Figure 4 Matrix showing the rule-based system for generating an overall juvenile status assessment (grading) from individual life-stage assessments. Fry grades run horizontally, parr grades run vertically.
Assessing the status of Special Areas of Conservation
NEPS was not explicitly designed to assess the status of SACs. However, post-stratification makes assessment of status possible for some of the larger SACs that exist within the NEPS sample frame (i.e. assessable rivers under the Conservation Regulations). For the purposes of this report, status is only reported where a minimum of five samples were obtained for an SAC within each of the NEPS sampling years.
Site condition monitoring requires that SACs are assigned one of the following categories: Favourable, Unfavourable (with sub-categories Declining, Maintained or Recovering), Partially destroyed or Destroyed. For the purposes of this report it is assumed that Favourable Condition is generally consistent with NEPS Grade 1 and inconsistent with NEPS Grade 3. It is also assumed that an assessment of Destroyed would be consistent with the total absence of salmon across any survey years. These underlying principles were translated into a rules-based assessment so that SAC's characterised by an overall NEPS Grade of 3 in any survey year would be designated as "Unfavourable". In circumstances where no salmon were observed, an assessment of "Destroyed" would apply.
Because NEPS has only operated over three years and the data are broadly incompatible with previous ad-hoc and potentially biased surveys, assessment of trends in abundance are somewhat dubious using these sources of data. However, it is possible to indicate the direction of travel from the three available unbiased NEPS surveys. For the purposes of this report systematic reductions in abundance between 2018, 2019 and 2021 were considered "Declining", while systematic increases between years were considered "Recovering". Where density did not vary systematically across years this was assumed to indicate "No Change". Given that NEPS estimates densities of both fry and parr, trends in either life stage were used to indicate change so long as these trends were not contradictory. In the latter circumstances a classification of "No Change" was applied.
Comparing abundance indicators: mean juvenile salmon density and rod catch
Fisheries assessment methods rely on two key components 1. A target for expectation against which to assess the performance of populations (e.g. a benchmark) and 2. Indicators of abundance. Abundance indicators can include commercial catches, rod catches, fish counters or field survey data such as that generated by NEPS. In the case of juvenile assessment methods that rely on wading and electrofishing it is not possible to sample the whole river system, but the assumption is that the surveyed areas are indicative of the wider river system. Confidence in the approach is strengthened where it can be shown that there is broad consistency with other independently collected indicators of abundance.
Rod catch data are spatially extensive for Scotland, published routinely, provide a useful proxy of adult salmon abundance (Thorley et al., 2005), and, through sophisticated modelling, underpin the adult based assessment methods used to inform Conservation Regulations in Scotland. Relationships between rod catch and mean juvenile salmon density were assessed at two spatial scales. For the national analysis rod catches were summed across Scotland and compared to national estimates of mean salmon density. For the regional comparison, reported rod catches were aggregated to NEPS region and divided by the wetted area of accessible river habitat to obtain a measure of rod catch density. These were then plotted against the regional mean density estimates of fry and parr obtained from NEPS. Data from NEPS 2021 were post-stratified to be consistent with the sample frames for 2018-19. Appropriate time lags were used for these comparisons, with parr assumed to be mostly two years old. For example rod catch data from 2016 were plotted against fry data from 2017 and parr data from 2018. For the regional data an illustrative Ricker stock-recruitment curve was fitted and data points were coloured by their NEPS grade to determine whether Grade 1 assessments were broadly consistent with maximum juvenile production.
Spatial variability in water quality: assessing pressures on salmonids
Water quality samples were obtained at the time of electrofishing and returned to MSS-FFL for analysis. A broad suite of determinands were measured including major cations (sodium: Na, potassium: K, magnesium: Mg, calcium: Ca), anions (sulphate: SO4, Chloride: Cl, nitrate: NO3-N), pH, alkalinity, electrical conductivity (EC), dissolved organic carbon (DOC), phosphate (PO4-P), total dissolved phosphorous (TP), total dissolved nitrogen (TN), Nitrite (NO2-N), total ammonia (NH4-N), Silica (Si), total monomeric aluminium (TM-Al) and labile aluminium (L-Al). The spatial variability of determinands was then mapped to help understand large scale spatial variability in water quality. L-Al data were excluded from the mapping since Al toxicity typically only arises under acidic low pH conditions (Malcolm et al., 2014). There was high correlation between some determinands e.g. alkalinity was strongly correlated with pH, Conductivity, Ca and Mg. Consequently, the list of determinands was reduced to a subset that were relatively poorly correlated (Pearson Correlation Coefficient < 0.8). Specifically: TN, NO3-N, NO2-N, NH4-N, TP, PO4-P, DOC, Si, pH, K, Cl, SO4.
Contact
Email: neps@gov.scot