Demand optimisation in laboratory medicine phase V: final report June 2022
Demand optimisation is defined as the process by which diagnostic test use is optimised to maximise clinical utility, which in turn optimises clinical care and drives more efficient use of associated scarce NHS resources. Report from the National Demand Optimisation Group (NDOG).
Annex 2: User Manual
Here is a link to the user guidance manual and videos - Phase5 Primary Care Dashboard | Tableau Public
User Guidance
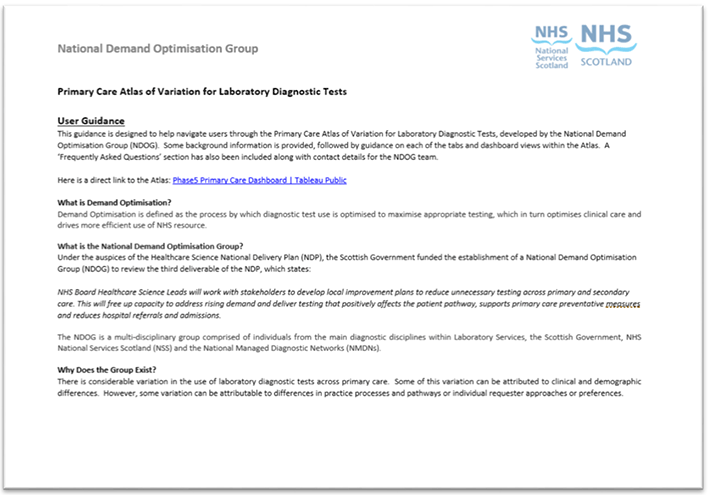
This guidance is designed to help navigate users through the Primary Care Atlas of Variation for Laboratory Diagnostic Tests, developed by the National Demand Optimisation Group (NDOG). Some background information is provided, followed by guidance on each of the tabs and dashboard views within the Atlas. A ‘Frequently Asked Questions’ section has also been included along with contact details for the NDOG team.
What is Demand Optimisation?
Demand Optimisation is defined as the process by which diagnostic test use is optimised to maximise appropriate testing, which in turn optimises clinical care and drives more efficient use of NHS resource.
What is the National Demand Optimisation Group?
Under the auspices of the Healthcare Science National Delivery Plan (NDP), the Scottish Government funded the establishment of a National Demand Optimisation Group (NDOG) to review the third deliverable of the NDP, which states: NHS Board Healthcare Science Leads will work with stakeholders to develop local improvement plans to reduce unnecessary testing across primary and secondary care. This will free up capacity to address rising demand and deliver testing that positively affects the patient pathway, supports primary care preventative measures and reduces hospital referrals and admissions. The NDOG is a multi-disciplinary group comprised of individuals from the main diagnostic disciplines within Laboratory Services, the Scottish Government, NHS National Services Scotland (NSS) and the National Managed Diagnostic Networks (NMDNs).
Why Does the Group Exist?
There is considerable variation in the use of laboratory diagnostic tests across primary care. Some of this variation can be attributed to clinical and demographic differences. However, some variation can be attributable to differences in practice processes and pathways or individual requester approaches or preferences.
What is the Primary Care Atlas of Variation for Laboratory Diagnostic Tests?
The Atlas of Variation contains monthly data on NHS board primary care requesting totals for a specific suite of blood science tests from cancer, cardiac, diabetes and other general pathways. The Atlas consists of three separate dashboards that allow GP practices to compare their request rates with their cluster, health board, national totals and peer group.
What else can I get out of using the Atlas of Variation?
The Atlas of Variation also contains links to educational advice, developed by the National Demand Optimisation Group’s Education Short Life Working Group members. The advice, available for selected tests, is hosted on the Right Decision platform, with direct links from the Atlas. Information includes: background, when to test, when not to test, when to repeat a test and any further reading recommendations. There is also an opportunity for users to test their knowledge. A quality improvement toolkit of resources can also be accessed via the Atlas, should any users wish to scope and implement any quality improvement projects.
Who can I contact for more information?
If you have any further questions or would like more information, you can get in touch with the NDOG team via nss.nationaldemand@nhs.scot
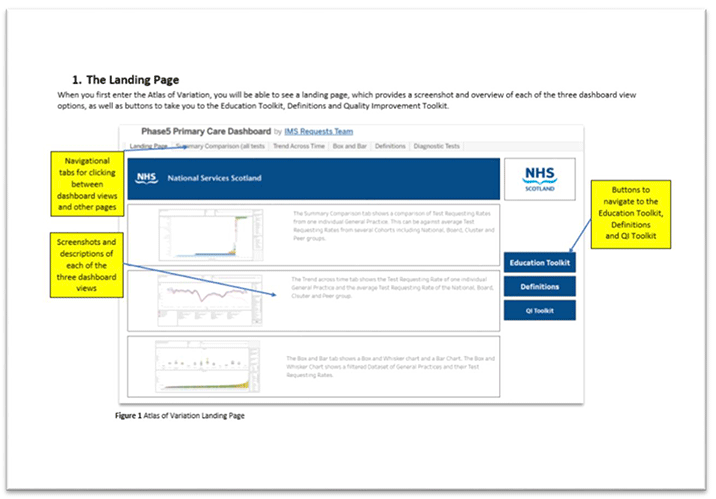
The Landing Page
When you first enter the Atlas of Variation, you will be able to see a landing page, which provides a screenshot and overview of each of the three dashboard view options, as well as buttons to take you to the Education Toolkit, Definitions and Quality Improvement Toolkit.
Content
- Navigational tabs for clicking between dashboard views and other pages
- Screenshots and descriptions of each of the three dashboard views
- Buttons to navigate to the Education Toolkit, Definitions and QI Toolkit
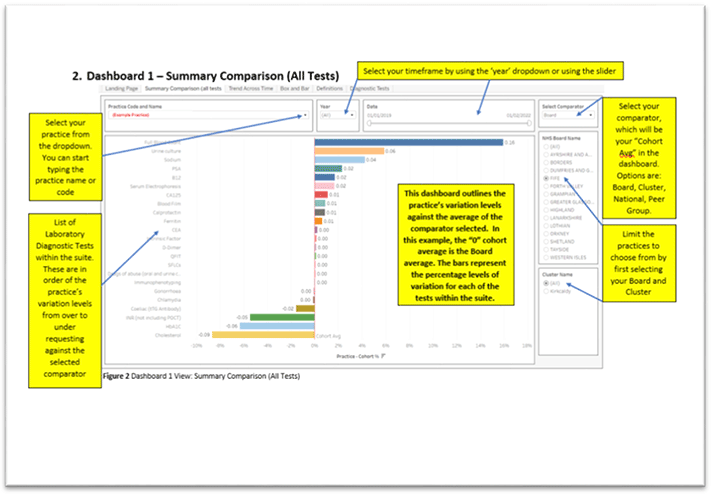
2. Dashboard 1 – Summary Comparison (All Tests)
This dashboard outlines the practice’s variation levels against the average of the comparator selected. In this example, the “0” cohort average is the Board average. The bars represent the percentage levels of variation for each of the tests within the suite.
Content
- Select your practice from the dropdown. You can start typing the practice name or code
- List of Laboratory Diagnostic Tests within the suite. These are in order of the practice’s variation levels from over to under requesting against the selected comparator
- Select your timeframe by using the ‘year’ dropdown or using the slider
- Select your comparator, which will be your “Cohort Avg” in the dashboard. Options are: Board, Cluster, National, Peer Group.
- Limit the practices to choose from by first selecting your Board and Cluster
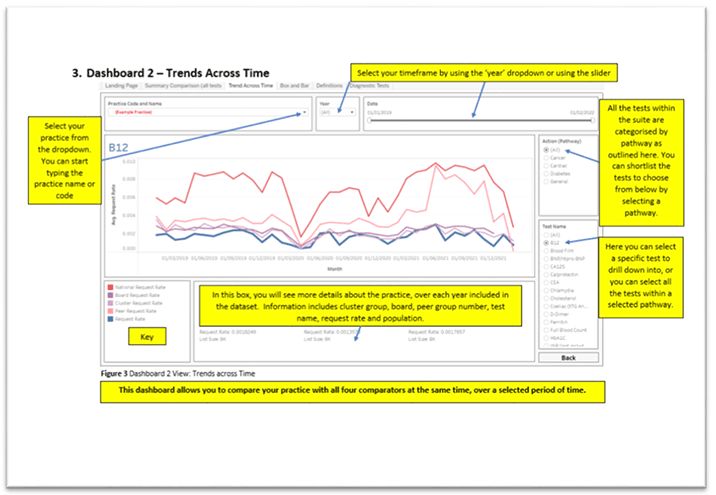
3. Dashboard 2 – Trends Across Time
This dashboard allows you to compare your practice with all four comparators at the same time, over a selected period of time.
Content
- Select your practice from the dropdown. You can start typing the practice name or code
- Select your timeframe by using the ‘year’ dropdown or using the slider
- All the tests within the suite are categorised by pathway as outlined here. You can shortlist the tests to choose from below by selecting a pathway.
- Here you can select a specific test to drill down into, or you can select all the tests within a selected pathway.
- In this box, you will see more details about the practice, over each year included in the dataset. Information includes cluster group, board, peer group number, test name, request rate and population
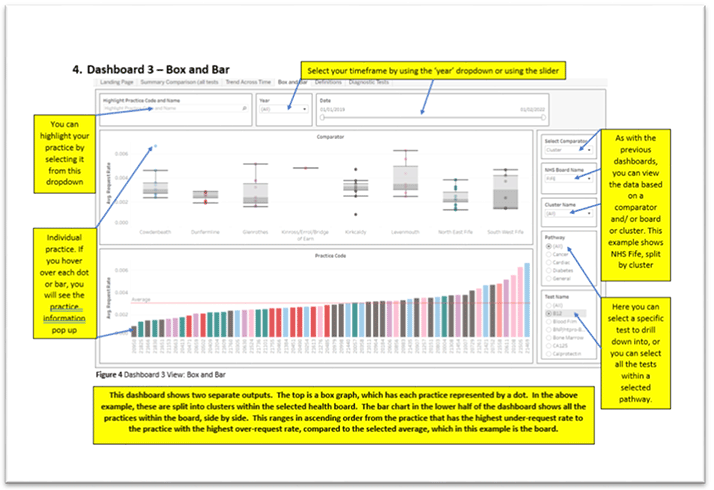
4. Dashboard 3 – Box and Bar
This dashboard shows two separate outputs. The top is a box graph, which has each practice represented by a dot. In the above example, these are split into clusters within the selected health board. The bar chart in the lower half of the dashboard shows all the practices within the board, side by side. This ranges in ascending order from the practice that has the highest under-request rate to the practice with the highest over-request rate, compared to the selected average, which in this example is the board
Content
- You can highlight your practice by selecting it from this dropdown
- Select your timeframe by using the ‘year’ dropdown or using the slider
- As with the previous dashboards, you can view the data based on a comparator and/ or board or cluster. This example shows NHS Fife, split by cluster
- Here you can select a specific test to drill down into, or you can select all the tests within a selected pathway.
- Individual practice. If you hover over each dot or bar, you will see the practice information pop up
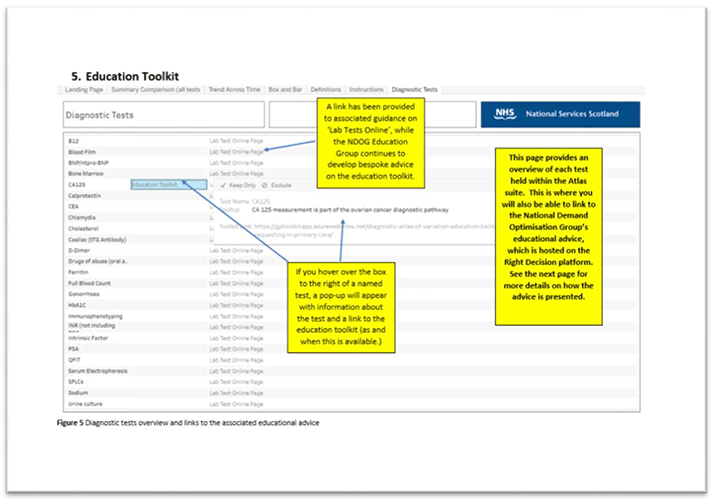
5. Education Toolkit
This page provides an overview of each test held within the Atlas suite. This is where you will also be able to link to the National Demand Optimisation Group’s educational advice, which is hosted on the Right Decision platform. See the next page for more details on how the advice is presented.
Content
- A link has been provided to associated guidance on ‘Lab Tests Online’, while the NDOG Education Group continues to develop bespoke advice on the education toolkit.
- If you hover over the box to the right of a named test, a pop-up will appear with information about the test and a link to the education toolkit (as and when this is available.)
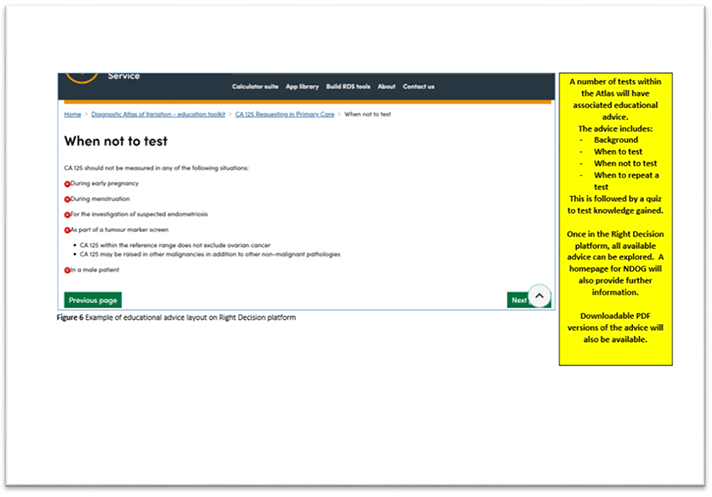
A number of tests within the Atlas will have associated educational advice. The advice includes: - Background - When to test - When not to test - When to repeat a test This is followed by a quiz to test knowledge gained. Once in the Right Decision platform, all available advice can be explored. A homepage for NDOG will also provide further information. Downloadable PDF versions of the advice will also be available.
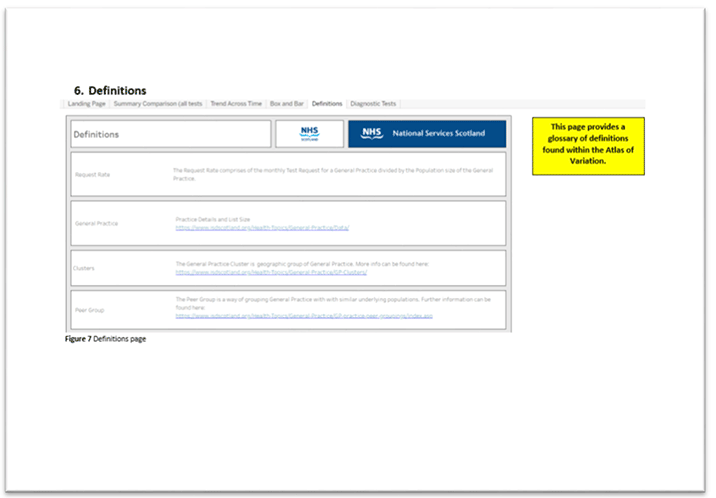
6. Definitions
This page provides a glossary of definitions found within the Atlas of Variation.
7. Quality Improvement Toolkit
The National Demand Optimisation Group (NDOG) has a Short Life Working Group that has been tasked with scoping and developing quality improvement projects, through the utilisation of data held within the Atlas of Variation. This work is in the early stages of development at the moment, however a quality improvement zone will be set up on the NDOG website in the near future, which will contain examples of projects, resources and templates.
In the meantime, a link has been set up from the Atlas of Variation ‘Landing Page’, which will take the user to an existing Quality Improvement Zone managed by NHS Education for Scotland (NES).
8. Instructions/ User Guidance
A tab and button can be accessed from the ‘Landing page’, which takes you to this guidance, as well as several informative videos.
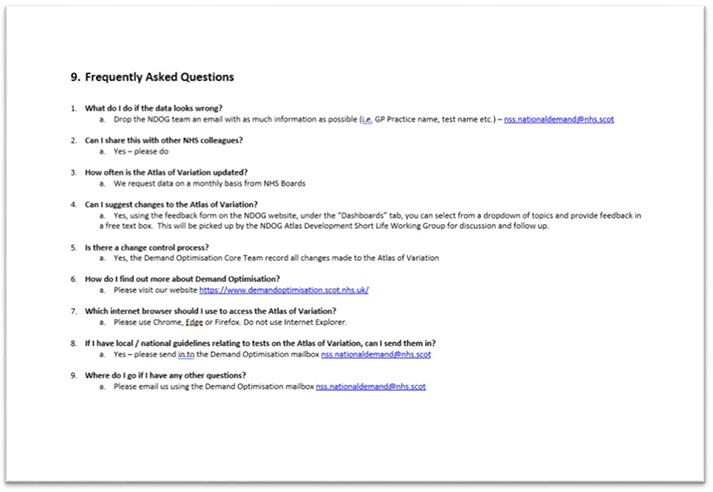
9. Frequently Asked Questions
1. What do I do if the data looks wrong? a. Drop the NDOG team an email with as much information as possible (i.e. GP Practice name, test name etc.) – nss.nationaldemand@nhs.scot
2. Can I share this with other NHS colleagues? a. Yes – please do
3. How often is the Atlas of Variation updated? a. We request data on a monthly basis from NHS Boards
4. Can I suggest changes to the Atlas of Variation? a. Yes, using the feedback form on the NDOG website, under the “Dashboards” tab, you can select from a dropdown of topics and provide feedback in a free text box. This will be picked up by the NDOG Atlas Development Short Life Working Group for discussion and follow up.
5. Is there a change control process? a. Yes, the Demand Optimisation Core Team record all changes made to the Atlas of Variation
6. How do I find out more about Demand Optimisation? a. Please visit our website https://www.demandoptimisation.scot.nhs.uk/
7. Which internet browser should I use to access the Atlas of Variation? a. Please use Chrome, Edge or Firefox. Do not use Internet Explorer.
8. If I have local / national guidelines relating to tests on the Atlas of Variation, can I send them in? a. Yes – please send in to the Demand Optimisation mailbox nss.nationaldemand@nhs.scot
9. Where do I go if I have any other questions? a. Please email us using the Demand Optimisation mailbox nss.nationaldemand@nhs.sco
Contact
Email: Kachi.Okorie@gov.scot