Demand optimisation in laboratory medicine phase V: final report June 2022
Demand optimisation is defined as the process by which diagnostic test use is optimised to maximise clinical utility, which in turn optimises clinical care and drives more efficient use of associated scarce NHS resources. Report from the National Demand Optimisation Group (NDOG).
5. Outputs
5.1 Primary Care Atlas of Variation
The primary care Atlas of Variation for diagnostic laboratory tests was launched nationally on 1 April 2022.
5.1.1 Atlas Development
The Atlas Development short life working group (SLWG) included General Practitioners from NHS Tayside and NHS Shetland, together with Laboratory and Realistic Medicine representation.
In March 2022 the Atlas of Variation held a soft pilot launch in NHS Fife, NHS Tayside and NHS Grampian, and subsequent feedback from stakeholders enabled the SLWG to develop an updated 'statement of requirements.'
Improvement work included: –
- Updating dashboard labels to clarify the content
- The "cohort" dropdown label was changed to "comparator", which was seen as a more accurate descriptor of the function provided
- A new automated function was added to ensure that the same practice is already pre-selected when moving between dashboards, to allow smoother transition
- A percentage rate on the summary of all tests dashboard was added as an alternative selection option to rate per 100 of the population. This was seen as a more helpful comparison. Prior to this change, one user commented, "tests with the highest request rates (e.g., Full Blood Count, sodium) are nearly always at the extremes as small relative differences will always be larger than for tests with low request rates."
A prioritisation exercise was undertaken to identify additional diagnostic tests that could be included within the Atlas of Variation. This can be used to inform any future developments.
A number of stakeholders requested a landing page to provide a high-level overview of the dashboards with a more user-friendly way into the Atlas of Variation. This page was developed (shown in figure 2 below) to provide an overview of the three dashboards as well as buttons to all the other main features within the Atlas of Variation.
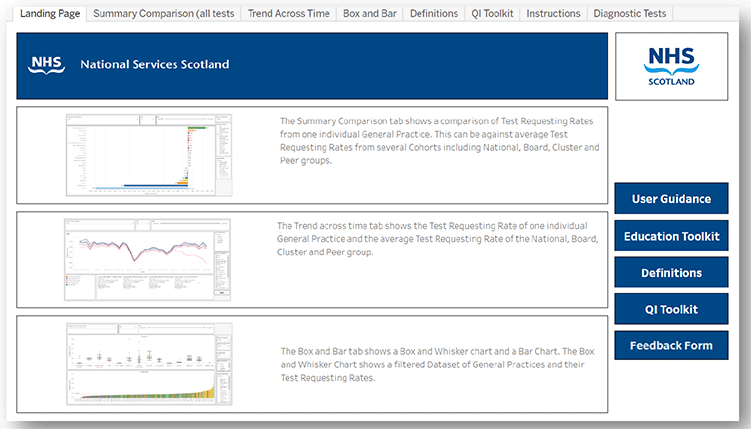
Three separate dashboard views allow the data to be interpreted in a variety of different ways.
The 'Summary Comparison' provides an overview of all the diagnostic tests within the Atlas of Variation suite. This view shows a comparison of test requesting rates from one individual general practice against the selected comparator (national, health board, cluster[4] or peer group[5]), allowing a snapshot of tests requested above and below the average rate of the selected comparator.
The 'Trend Across Time' view allows a general practice to compare their request rates for an individual test (or group of tests) against all four comparators at the same time and provides these rates over a specified timeline. This provides a quick snapshot of how the practice compares to others, and also clearly demonstrates the impact of COVID-19 and the subsequent recovery period. As one user commented, "these graphs are useful for telling the story of impact of COVID on diagnostics, both the reduction in requests during the first (and to a lesser extent second) lockdown. Variation in speed and extent of recovery of both specific tests and for particular practices can also be observed."
The 'Box and Bar' view provides two separate charts. The whisker chart provides a snapshot that highlights any outlier general practices for specific test (or group of tests). The bar chart shows all of the general practices (within the selection) on a side-by-side scale in order of those that are under-requesting the most to those that are over-requesting the most, against the average of the selected comparator. Service users commented that this was especially helpful for comparing practices within the cluster and also allowed for comparison within and between Health Boards to start to identify where specific pathways differ in addition to different practices of individual surgeries.
5.1.2 User Guidance
It was acknowledged that the complexity of the Atlas of Variation necessitated the development of user guidance.
A user guidance manual was created in March 2022, which is provided in Annex 2.
Several short videos were also created to cover each feature and dashboard view within the Atlas of Variation.
5.1.3 Flash Reports
The Atlas Development Short Life Working Group worked on the Phase V Flash Report template (see Annex 3), which was subsequently circulated to the pilot Health Boards (NHS Tayside and NHS Grampian) for feedback. The flash reports were designed to prompt the reader to consider what actions they could possibly take to address this. It also includes a link to the relevant educational advice for that test.
The NDOG have been in discussions with Local Intelligence Service Team (LIST) Analysts to determine the feasibility of incorporating the Atlas of Variation Flash Report information into their existing quarterly GP cluster reports.
5.1.4 Engagement
Throughout Phase V, the NDOG has engaged with a wide range of interested stakeholders to gather feedback, demonstrate the Atlas of Variation (and associated education toolkit) and share general communications about the rollout of the Atlas of Variation.
Stakeholders have included:
- Diagnostics in Scotland Strategic Group (DiSSG)
- Laboratories Executive Board (LEB)
- Scottish Government & Realistic Medicine Leads
- National Services Scotland (NSS) and the National Managed Diagnostic Networks (NMDN)
- Health board laboratory services
- General Practitioners
- Local Intelligence Support Teams (LIST)
- Digital Health and Innovation Centre (Dhi) Scotland
- Royal College of General Practitioners (RCGP)
- NHS Education Scotland (NES)
- Scottish Government Pathway Policy Leads (National Cancer Recovery Group, Cardiac, Diabetes etc.)
- Patients.
See Annex 4 for a high-level stakeholder overview.
The group continues to maintain and regularly update its website with pertinent programme information and links and interacts
with colleagues regularly via the National Managed Diagnostic Networks (NMDN) Twitter account (@NMDNScot).
Throughout the year, NDOG core team members have presented to:
- Institute of Biomedical Science (IBMS) Congress
- National Cancer Recovery Group
- Realistic Medicine Leads, Primary Care Policy Leads and Pathway Policy Leads
- Medical Directors
- Primary Care Leads
- The Improving Together Advisory Group
- LIST.
5.1.5 Primary Care Atlas of Variation Recommendations
It is recommended that Phase VI of the Demand Optimisation programme:
- Ensures ongoing national data collection and population of data from all Health Boards
- Continues to link with PathNexus and LIMS projects to explore how synergies might support automation
- Continues to deliver against agreed Comms plan
- Delivers training modules of how to use the Atlas
- Reviews the current suit of test in order to ensure that the Phase VI test suite is fit for purpose going forward.
5.2 Education
At the beginning of Phase V of the programme it was recognised that the Atlas of Variation presented powerful data but raised questions about practice, providing no direct strategy for behavioural change. The development of an education toolkit would provide information and direction around appropriate test use, translating into change in practice.
The NDOG was tasked with developing and implementing an education toolkit to expedite and maximise the utility, impact and implementation of the Atlas of Variation. An educational toolkit will contribute towards the delivery of standardised diagnostic testing practices across all boards in Scotland, with the aim to reduce harm, waste and unwarranted variation to improve health outcomes.
The toolkit can be accessed here - Diagnostic Atlas of Variation - education toolkit (scot.nhs.uk)
5.2.1 Value Improvement Fund
The NDOG was awarded funding through the Realistic Medicine Improvement Fund (VIF)to develop a suit of educational materials to support the Atlas of Variation.
An Education Short Life Working Group (SLWG) was established to take this work forward, chaired by Ian Godber (Consultant Clinical Scientist, NHS Greater Glasgow & Clyde) Lead Healthcare Scientist. The group has representation from microbiology and virology, biochemistry and haematology.
5.2.2 Education Toolkit Implementation
The decision was made that the education toolkit would be developed on the Right Decision platform and linked via the NDOG website and Atlas of Variation itself. The Right Decision Service is a Once for Scotland platform for health and social care. It delivers evidence-based guidelines, pathways, shared decision aids and risk scoring tools directly into the hands of health and social care staff. The service is accessible online and via mobile apps. It is funded by the Scottish Government and has been developed in partnership with health and social care staff across Scotland. A template was developed and refined to capture the key sections of the proposed guidance, including the e-learning questions.
The educational guidance covers the following key areas:
- Background
- When to test
- When to repeat a test
- When not to test
- Further references and reading
- Quiz questions
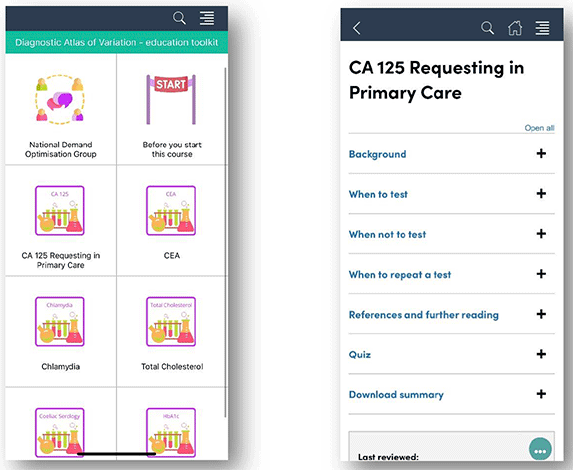
5.2.3 Benefits of an Education Toolkit
Anticipated benefits of the educational toolkit include:
- Contributing towards the delivery of more standardised diagnostic testing practices across all boards in Scotland
- QI work informed by the data in the and associated education toolkit should emerge and complement work on care pathways including diabetes, heart disease, cancer and respiratory Atlas of Variation Cost efficiency – resources expended on testing can be optimised
- Encouraging those that may have been hesitant to request a test to do so in line with the advice provided, leading to appropriate diagnoses and improved outcomes
- Support General Practitioners (GPs) in requesting the most appropriate diagnostic test.
The success of the educational toolkit will be measured as follows:-
Process Measures
1. The % of the identified top 20 tests with guidelines in place on appropriate use
2. The % of agreed NHS Boards receiving reports on test requesting patterns
Outcome Measures
1. Optimisation of test requesting across identified tests (% reduction in variation to be agreed within individual quality improvement plans), i.e. standard deviation should decrease
2. Toolkit in use across 50% of GP practices across participating areas
3. Number of GPs accessing toolkit within participating boards increasing through quarterly reporting
Balance Measures
1. Data collection remains at 95% of current levels
2. Fewer than 10% of labs raise issues of increased testing beyond current capacity
3. No decrease in number of people accessing the Atlas
A poster titled "An Educational Toolkit for Demand Optimisation when using the Atlas of Variation in Laboratory Diagnostic Testing" was displayed at the NES Annual Virtual Conference, further promoting its use and importance.
An education-themed newsletter was also shared in June 2022 to promote the education toolkit, highlight progress to date and encourage feedback.
5.2.4 Education Recommendations
It is recommended that the NDOG and Education Short Life Working Group focus on the following, during the next phase of the programme:
- Continued engagement with the Right Decision app to complete suite of education materials
- Ongoing Educational advice developed and embedded in the Atlas
- Align targeted unwarranted variation from the primary care Atlas to the availability of educational advice available
5.3 Quality Improvement
A Quality Improvement (QI) SLWG has been established which includes NHS Education for Scotland Quality Improvement course alumni who can support GPs to deliver projects within their practice or clusters. GP clusters are typically groups of between five to eight GP practices in a close geographical location.
The NDOG has also been working with a number of policy teams from Scottish Government (Cancer, Diabetes, Cardiac) to look at synergies across pieces of work. In particular, the NDOG is supporting national work around diabetes pathways, providing HbA1c cluster-level requesting information and data examples for inclusion in a report that will enable clusters to see all diabetes pathway data in one place. Below are a couple of examples of QI work now in progress.
5.3.1 Example: HbA1c
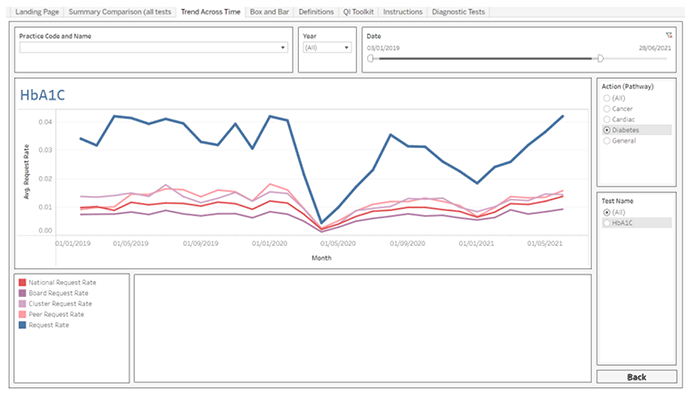
NHS Fife were given access to an early version of the Atlas of Variation as part of a pilot exercise, one practice in particular noticed that their HbA1c request rates were significantly higher on average than all of their comparators.
The 'Trends Across Time' dashboard allows practices to drill down into specific tests and lets them compare their request rates with the average rates of their health board, cluster, peer group and the national rate. This was where it became clear that there was significant variation for the practice in question, as shown in figure 4 below.
The practice manager provided the following insight:
"We made changes to our requesting template in cyberlabs, removing the HbA1c test due. This change came after figures were shared of NHS Fife testing rates and we were shocked to find that [example practice] were substantially more than other practices.
We removed the HbA1c testing from our regular chronic disease template to ensure it was only used when required."
The results of this change can be seen in figure 5 below.
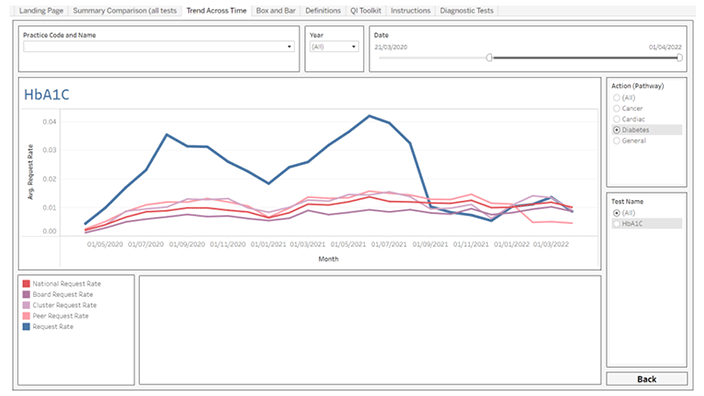
As the above graphic demonstrates, after implementing this change, the practice is now very much in line with its comparators. From 1st September 2021 to 31st March 2022 around 882 unnecessary tests were avoided, (or an average of 1,512 per annum). The average cost of an HbA1c test is £4.20. When considering a drop in average test requests from 183 to 57. This generates an annual saving of £6,350.40.
This is just an example of one test, for one practice in Scotland.
5.3.2 Example: NHS Grampian Practice Variation
A QI project is underway in NHS Grampian to look at the underlying causes of unwarranted variation in requesting patterns. Practices within a single cluster have been approached to take part in this work and the following objectives have been outlined:
- Identify practices at the lower and higher ends of request rate scale to understand and assist with associated issues, leading to a reduction in unwarranted variation and allowing the support of service efficiency and sustainability within the system.
- Investigate local challenges and promote a just healthcare system for all, attempting to mitigate potential risks of health inequalities.
- Promote the Atlas of Variation as a tool to support a personalised approach to care, reduce unwarranted variation, reduce harm and waste and manage risk better in primary care blood testing.
- Develop multiple points of access to the Atlas of Variation database via TRACK care, Realistic Medicine, ISD Primary Care, iHub – to promote awareness and assist with informed decision making.
- Communicate and encourage Minimum Testing Intervals (MTI), the right test for the right patient at the right time approach.
- Provide support and guidance to practices and cluster leads to explore variation in request rates, identified through data analysis.
5.3.3 Quality Improvement Recommendations
It is recommended that the NDOG and Quality Improvement Short Life Working Group focus on the following, during the next phase of the programme:
- Develop quality assurance process of regular reporting of analytical data associated with the Atlas that highlights unwarranted variation across primary care
- Align Atlas data with improvement plans in Primary Care with targeted reporting to GPs of the test(s) highlighted, and monitor impact over 6 months
- Scope automation of flash reports, ensuring the data shared is meaningful (i.e., reports are only generated where variation is present)
- Work with the national Improving together Advisory Group to contribute to a refreshed national framework for Clusters
- Connect laboratory Atlas data for diabetes to the wider datasets from Scottish Care Information – Diabetes Collaboration (SCI-DC), Public Health Scotland (PHS), Scottish Therapeutics Utility (STU) for each cluster, which allows them to understand their prevalence, referral, prescribing and management of type 2 diabetes, alongside a narrative with tools and resources to support Realistic Medicine approach to person centred care and planning.
- Explore where demand optimisation could add value to programmes in cancer and diabetes diagnosis and monitoring
- Actively promote use of QI toolkits and embed within local practice
Contact
Email: Kachi.Okorie@gov.scot