Building Standards verification performance framework - national customer satisfaction survey: survey findings 2021
Results from the National Customer Satisfaction Survey 2021 giving a summary of local authority performance of the National Performance Framework.
Appendix 1: Results by Local Authority verifier size
11.1. Main Survey Data by Local Authority Verifier Size
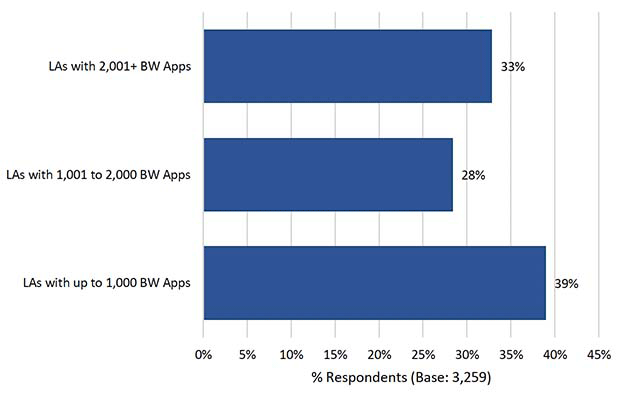
1. The charts in this section present the main survey data according to the size of the local authority verifier. In this context, size is defined as the number of building warrant applications made by customers within the 2020-2021 financial year. Three size bandings have been derived, as follows:
Table 11.1.a Size bandings per number of applications
Small – Up to 1,000 applications
- Aberdeen City
- Angus
- Argyll & Bute
- Clackmannanshire
- Dundee City
- East Ayrshire
- East Lothian
- East Renfrewshire
- Eilean Siar
- Falkirk
- Inverclyde
- Midlothian
- Moray
- North Ayrshire
- Orkney
- Scottish Borders
- Shetland
- South Ayrshire
- Stirling
- West Dunbartonshire
Medium – 1,001 to 2,000 applications
- Aberdeenshire
- Dumfries & Galloway
- East Dunbartonshire
- Perth & Kinross
- Renfrewshire
- South Lanarkshire
- West Lothian
Large – 2,001+ applications
- City of Edinburgh
- Fife
- Glasgow City
- Highland
- North Lanarkshire
Source: Pye Tait Consulting 2021
Source Pye Tait Consulting 2021
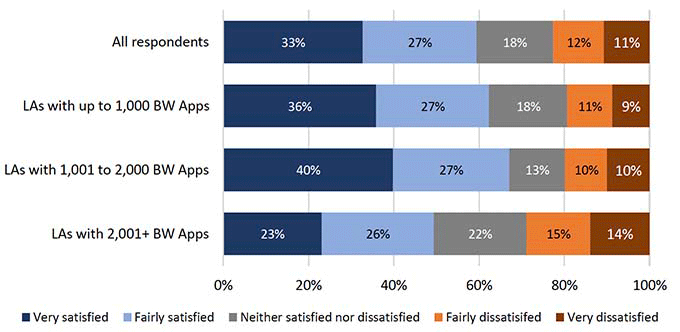
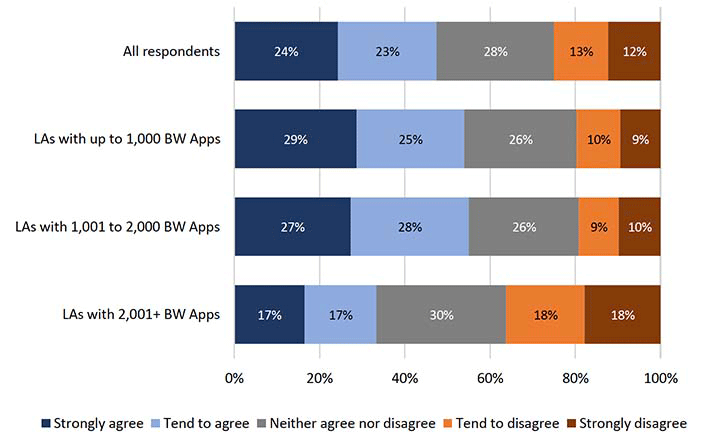
11.2. Overall Satisfaction and Meeting Expectations
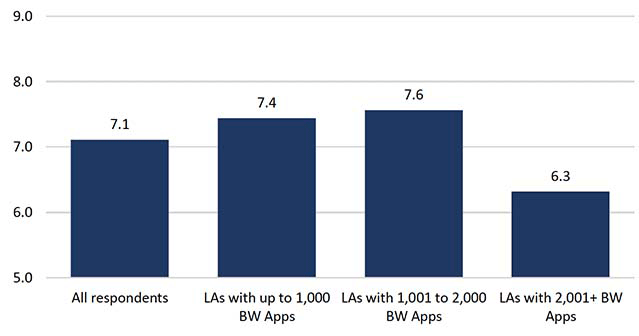
Source Pye Tait Consulting 2021
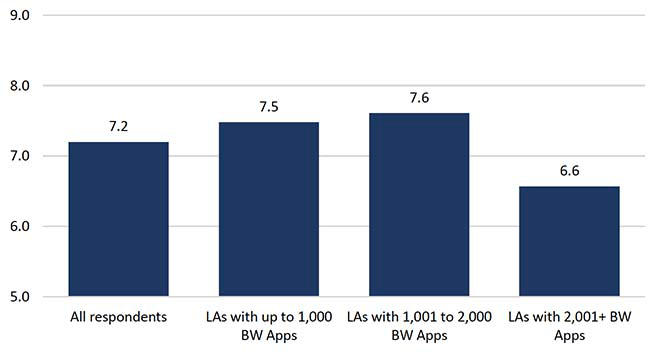
Source Pye Tait Consulting, 2021
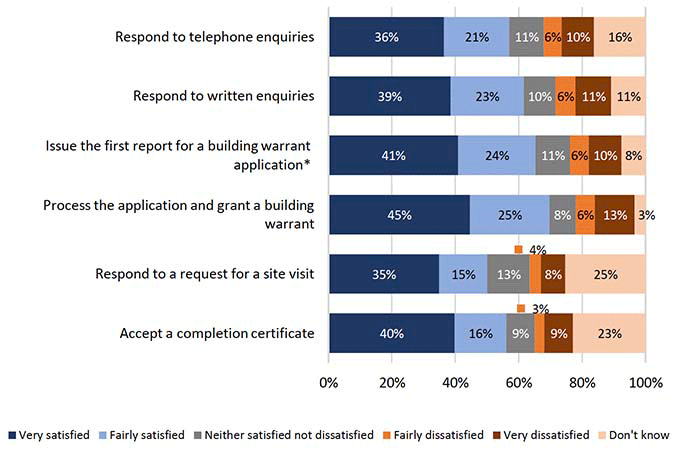
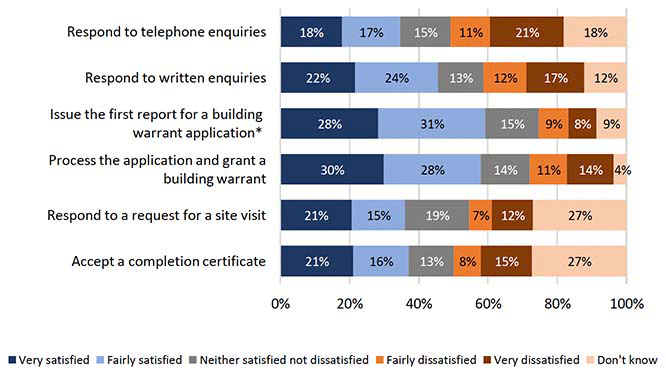
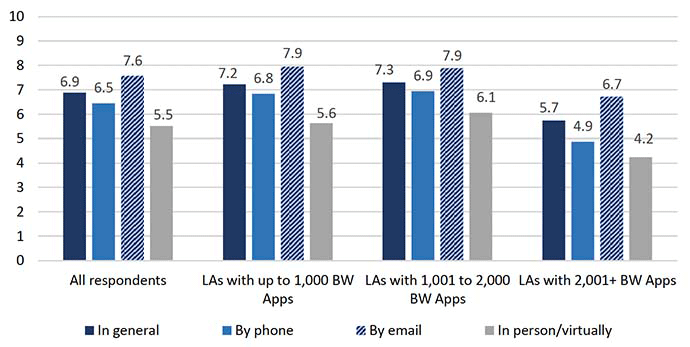
11.3. Timeliness
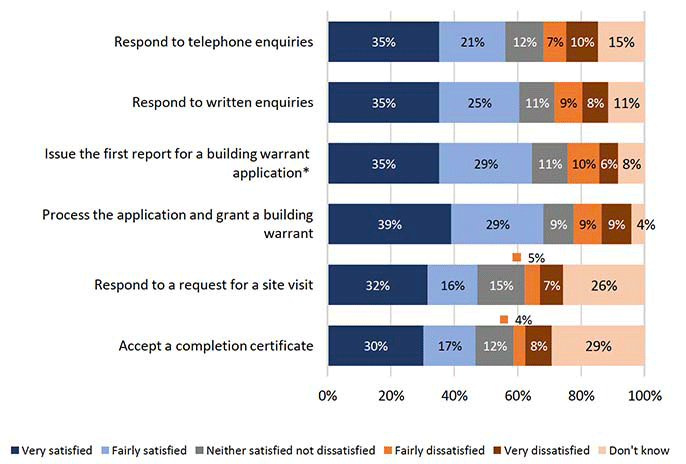
Notes * (e.g. detailing non-compliance or further information requested)
Source Pye Tait Consulting, 2021
Notes * (e.g. detailing non-compliance or further information requested)
Source Pye Tait Consulting, 2021
Notes * (e.g. detailing non-compliance or further information requested)
Source Pye Tait Consulting, 2021
Source Pye Tait Consulting, 2021
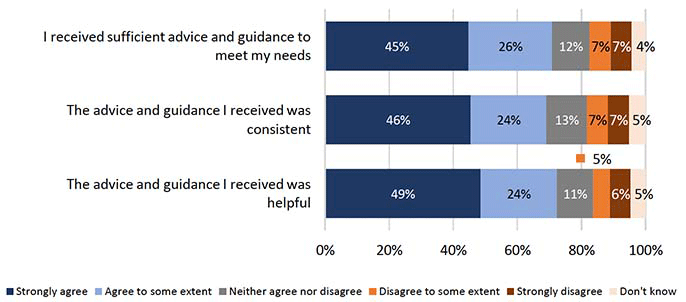
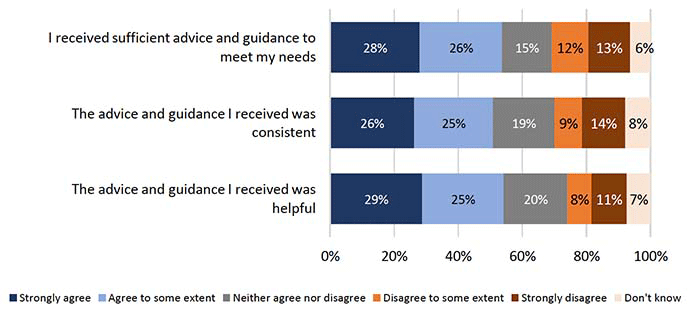
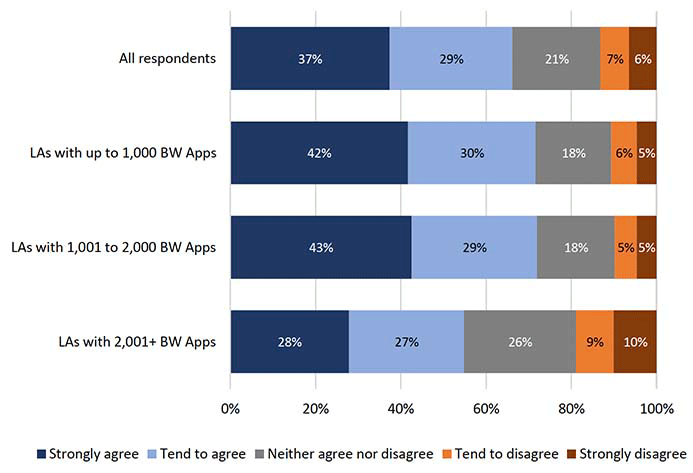
11.4. Advice and Guidance
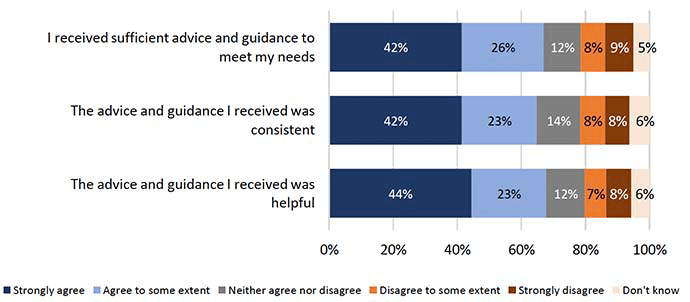
Source Pye Tait Consulting, 2021
Source Pye Tait Consulting, 2021
Source Pye Tait Consulting, 2021
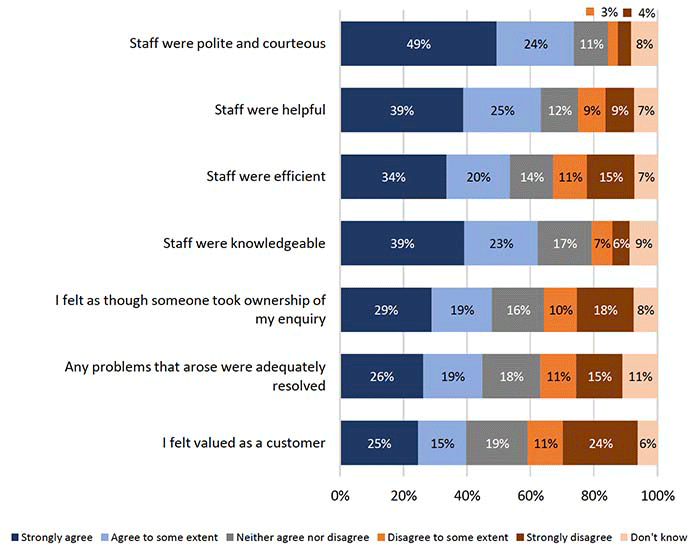
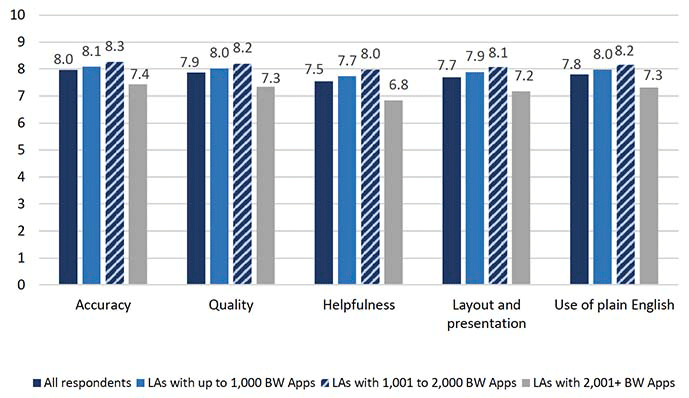
11.5. Quality of Service
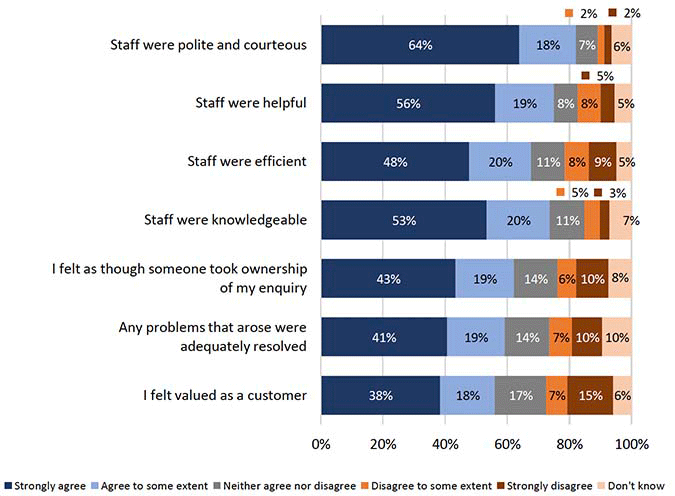
Source Pye Tait Consulting, 2021
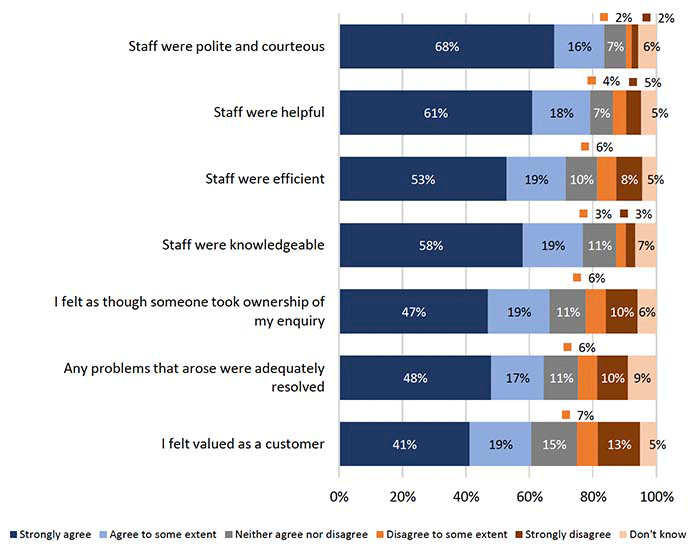
Source Pye Tait Consulting, 2021
Source Pye Tait Consulting, 2021
11.6. Inspections
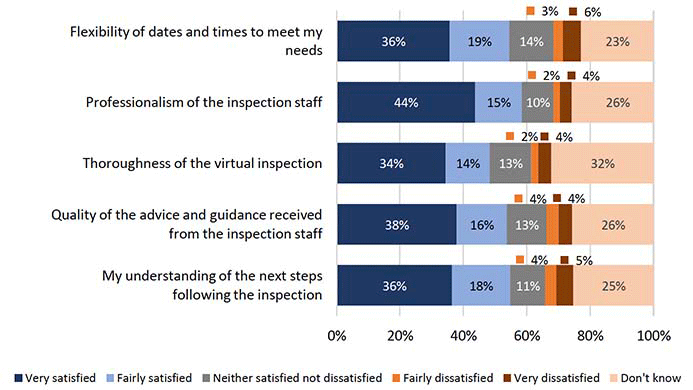
Source Pye Tait Consulting, 2021
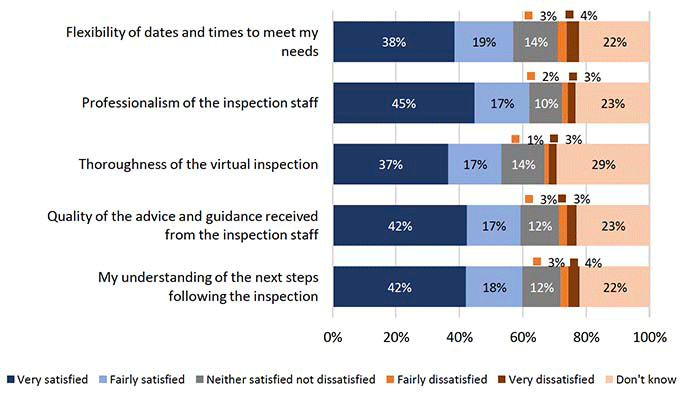
Source Pye Tait Consulting, 2021
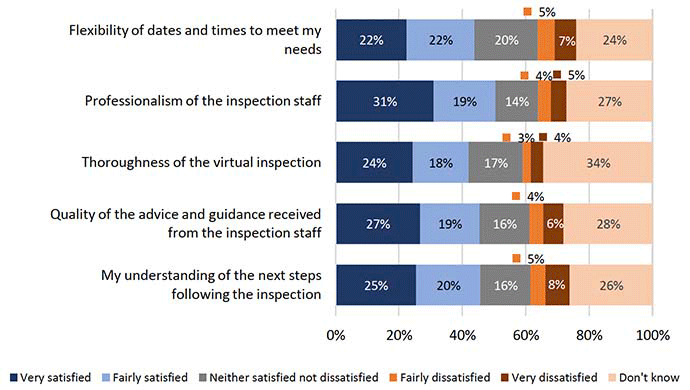
Source Pye Tait Consulting, 2021
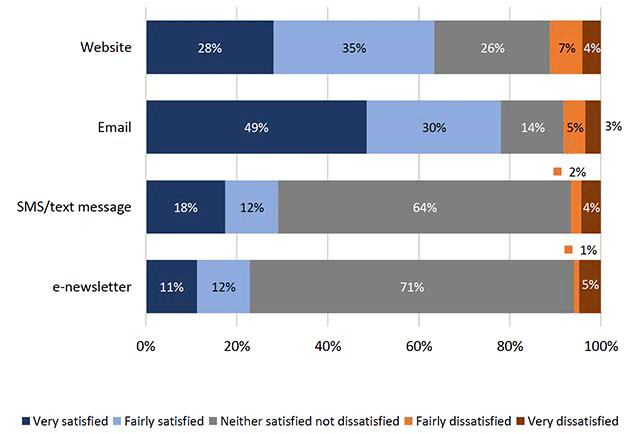
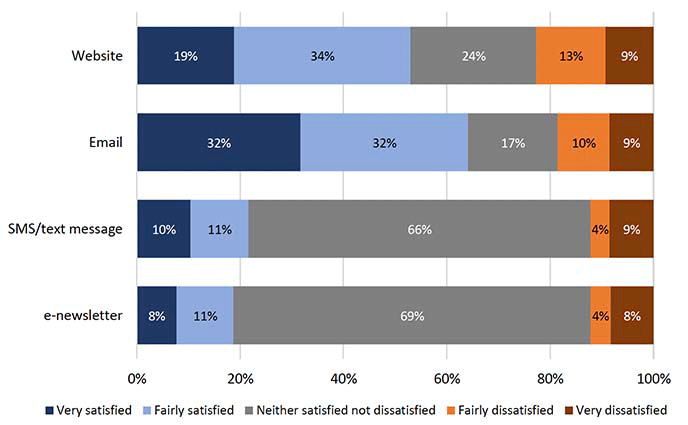
11.7. Communications
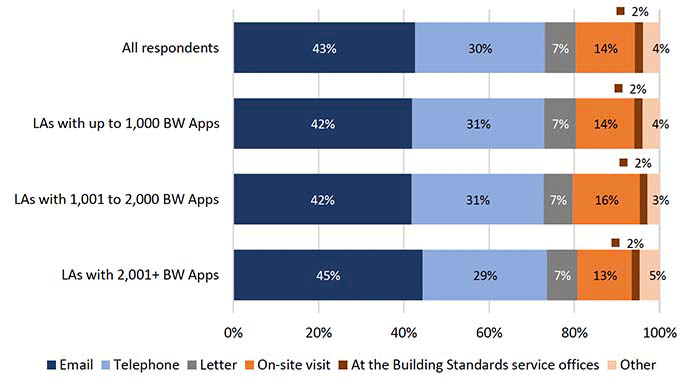
Source Pye Tait Consulting, 2021
Source Pye Tait Consulting, 2021
Source Pye Tait Consulting, 2021
Source Pye Tait Consulting, 2021
Source Pye Tait Consulting, 2021
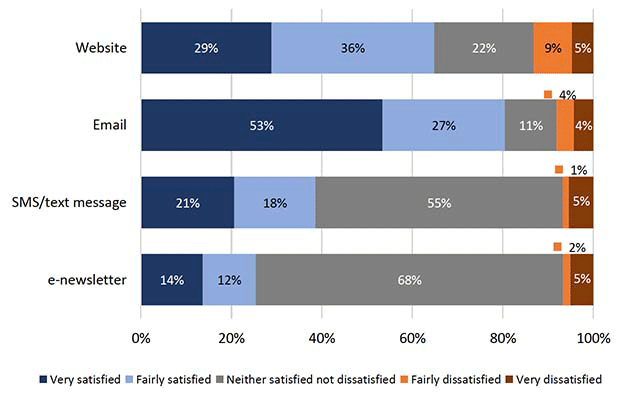
11.8. Accessibility
Source Pye Tait Consulting, 2021
Source Pye Tait Consulting, 2021
Source Pye Tait Consulting, 2021
Contact
Email: buildingstandards@gov.scot