National Care Service - social care support and service provision: evidence
Overview of the key national trends in social care service provision and support in Scotland. It is part of a collection of contextual evidence papers, setting out key sources of information about social care and related areas in Scotland.
3. Social Care Services and Support – Trends and Analysis
3.1 Trends in Self-Directed Support[4]
Self-directed Support (SDS) was introduced in Scotland on 1st April 2014 following the Social Care (Self-directed Support) (Scotland) Act 2013. Its introduction means that everyone eligible for social care and support has the right to choice, control and flexibility to meet their personal outcomes. Local authorities are required to ensure clients are offered a range of choices on how they receive their social care services and support. Self-directed Support allows people to choose a number of different options for getting support.
The person’s individual budget can be:
Option 1: Taken as a Direct Payment.
Option 2: Allocated to an organisation that the person chooses – the council holds the budget but the person is in charge of how it is spent.
Option 3: The person chooses to allow the council to arrange and determine their service.
Option 4: The person can choose a mix of these options for different types of support.
| 2017/18 | 2018/19 | 2019/20 | 2020/21 | |
|---|---|---|---|---|
| Option 1 | 9,095 | 9,305 | 9,415 | 9,495 |
| Option 2 | 7,460 | 7,020 | 9,030 | 8,735 |
| Option 3 | 81,955 | 91,560 | 86,200 | 92,795 |
| Option 4 | 4,485 | 5,010 | 5,440 | 5,340 |
| Any SDS Option | 93,900 | 102,905 | 99,245 | 105,790 |
| Implementation Rate | 77.1% | 81.3% | 81.5% | 84.4% |
Sources: Public Health Scotland
It should be noted that people can choose more than one Self-directed Support option, so the total number of options chosen will be higher than the number of people involved in choosing their support. The implementation rate represents the proportion of those people who received social care support and services who received their support through Self-directed Support. In 2020/21, 84.4% of people receiving social care support and services were provided with Self-directed Support, up from 77.1% in 2017/18.
In 2020/21, there were 105,790 people who chose to receive their support through one or more of the Self-directed Support options. Consistently over time, the most frequent choice is Option 3, where the person chooses to allow the health and social care partnership to arrange their services. In 2020/21, there were 92,795 people who chose Option 3, which represents around 88% of people who choose at least one Self-directed Support option. The percentage of people choosing Option 1 (9%), Option 2 (8%) and Option 4 (5%) has remained relatively stable since 2017/18.
3.2 Trends in Care at Home Hours
This section presents national figures for care at home services provided or purchased by Health and Social Care Partnerships in Scotland. It therefore excludes any privately funded provision (on which data is not collected nationally). Care at home services give people the support, practical help and personal care that they need to live as independently as possible in the community (this includes sheltered housing and equivalent accommodation)[7].
| Year | Number of people | Number of hours |
|---|---|---|
| 2010 | 66,225 | 632,160 |
| 2011 | 63,460 | 607,415 |
| 2012 | 62,830 | 627,380 |
| 2013 | 61,070 | 631,145 |
| 2014 | 61,735 | 678,890 |
| 2015 | 61,500 | 700,335 |
| 2016 | 59,775 | 676,515 |
| 2017 | 59,640 | 696,620 |
| 2018 | 59,940 | 702,885 |
| 2019 | 59,875 | 686,130 |
| 2020 | 59,000 | 721,265 |
| 2021 | 59,960 | 733,505 |
Sources: Public Health Scotland
In 2021, there were an estimated 59,960 people in Scotland receiving care at home during the census week (25 - 31 March). This compares to 66,225 in 2010, which equates to a 9% decrease. Between 2010 and 2016 the number of people receiving care at home decreased, but since then the numbers have been broadly similar at just under 60,000.
In 2021, the total number of hours of care at home during census week was 733,505, a slight increase from 2020. In general, care at home hours have increased year on year between 2010 and 2021, with only a few yearly decreases (2011, 2016 and 2019).
The decrease in the number of people who have been receiving care at home coupled with the rise in the overall number of hours of care at home means the average (mean) hours per person has increased from 9.5 hours in 2010 to 12.2 hours in 2021.
Sources: Public Health Scotland
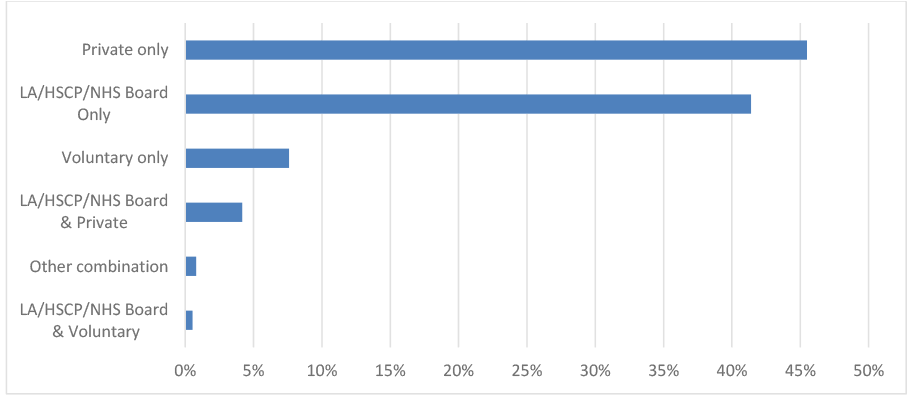
Over the last decade, Local Authority (LA)/Health & Social Care Partnership (HSCP)/NHS Boards have been increasingly purchasing social care and support services from the private and voluntary sector rather than providing it directly[10]. In 2021, 41% of care at home clients received their care via Local Authority/Health & Social Care Partnership/NHS Board services only. Around 45% of care at home clients received their Local Authority/Health & Social Care Partnership/NHS Boards funded care only from private sector providers.
Figure 2, below, shows the distribution of care at home hours for people of all ages. The majority of care at home clients tend to receive smaller amounts of care per week. Around 62% received less than 10 hours of care per week, while 11% received more than 20 hours of care per week in March 2021.
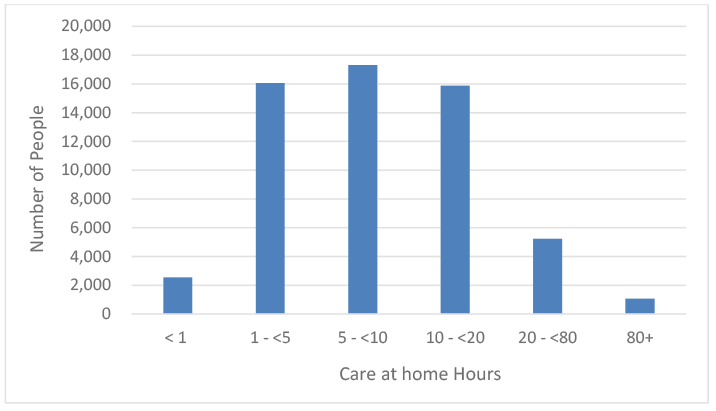
Source: Public Health Scotland
3.3 Trends in Community Alarms and Telecare
The use of equipment and technology can help people live safely and independently at home. Telecare is the remote or enhanced delivery of care services to people in their own home by means of telecommunications and computerised services. Telecare usually refers to sensors or alerts which provide continuous, automatic and remote monitoring of care needs, emergencies and lifestyle changes, using information and communication technology (ICT) to trigger human responses, or shut down equipment to prevent hazards.
Community alarms are considered to be the basic, introductory level of telecare. Typically a community alarm includes a button/pull cord/pendant which transfers an alert/alarm/data to a monitoring centre or individual responder.
| 2015/16 | 2016/17 | 2017/18 | 2018/19 | 2019/20 | 2020/21 | |
|---|---|---|---|---|---|---|
| Community alarm only | 90,380 | 88,270 | 83,475 | 82,225 | 82,035 | 83,145 |
| Telecare only | 6,920 | 4,710 | 16,250 | 15,695 | 14,650 | 15,290 |
| Receiving both community alarm and telecare | 29,490 | 35,770 | 32,195 | 38,975 | 35,845 | 31,695 |
| Total community alarms and/or telecare | 126,790 | 128,750 | 131,915 | 136,900 | 132,535 | 130,130 |
Sources: Public Health Scotland
In 2020/21, around 130,130 people were in receipt of a community alarm and/or telecare package. The number of people in receipt of community alarm and/or telecare packages increased year-on-year between 2015/16 and 2018/19 before declining in the most recent two years (2019/20 and 2020/21). This decline may have been due to the Covid-19 pandemic.
3.4 Trends in Care Home Provision
This section presents national figures about care homes and care home residents in Scotland based on the Scottish Care Home Census (SCHC)[12]. The SCHC collects information about care home residents regardless of whether they are funded publically or privately. The Care Home Census includes all care homes for adults aged 18 years and over in Scotland, including care homes for older people (65 years and over) and for those with learning disabilities, mental health problems, physical and sensory impairment, acquired brain injury, alcohol and drug problems, and blood borne viruses.
A ‘care home’ provides 24-hour care to its residents, and residents within the same care home may receive residential care or residential and nursing care if this is required by the individual[i]. Further information about the strengths and limitations of the Scottish Care Home Census can be found in the publication ‘Data Resource Profile The Scottish Social Care Survey (SCS) and the Scottish Care Home Census (SCHC)[13]’.
Scotland’s population is ageing with an increasing number of people in older age groups compared with previous decades[14]. The gradual rise in the number of older people has not been accompanied by an increase in the provision of care home places. Proportionally, more people with care and support needs are living at home[15].
As at 31 March 2021:
- There were 1,069 care homes for adults and 40,632 registered places. This compared to 1,329 care homes for adults and 42,810 registered places in 2011. A 20% and 5% reduction respectively.
- There were an estimated 33,353 residents. This was 11% fewer than 31 March 2011 (37,511 residents).
- The estimated percentage occupancy was 82%, compared with 88% on 31 March 2011.
- Around 63% of care homes for adults were run by the private sector. This compared to around 55% as at 31 March 2011. Across all sectors (public, private and voluntary / not for profit) there has been a decrease in the number of care homes for adults between 2011 and 2021, but the largest decrease (38%) has been in the voluntary sector.
- The above trends have continued during the Covid-19 pandemic. In particular, the voluntary / not for profit sector has seen the largest decline in number of care homes, registered places and therefore, number of residents between 2019 and 2021.
- There has been a large reduction in the estimated number of short stay and respite admissions to care homes between 2018/19 and 2020/21. This may be connected to the Covid-19 pandemic. Similarly, there has been a large reduction in people being discharged from care homes over the same time period (excluding deaths, which increased over the Covid-19 pandemic).
- Residents in care homes for older people accounted for 91% of residents in all care homes for adults (30,502 out of 33,353).
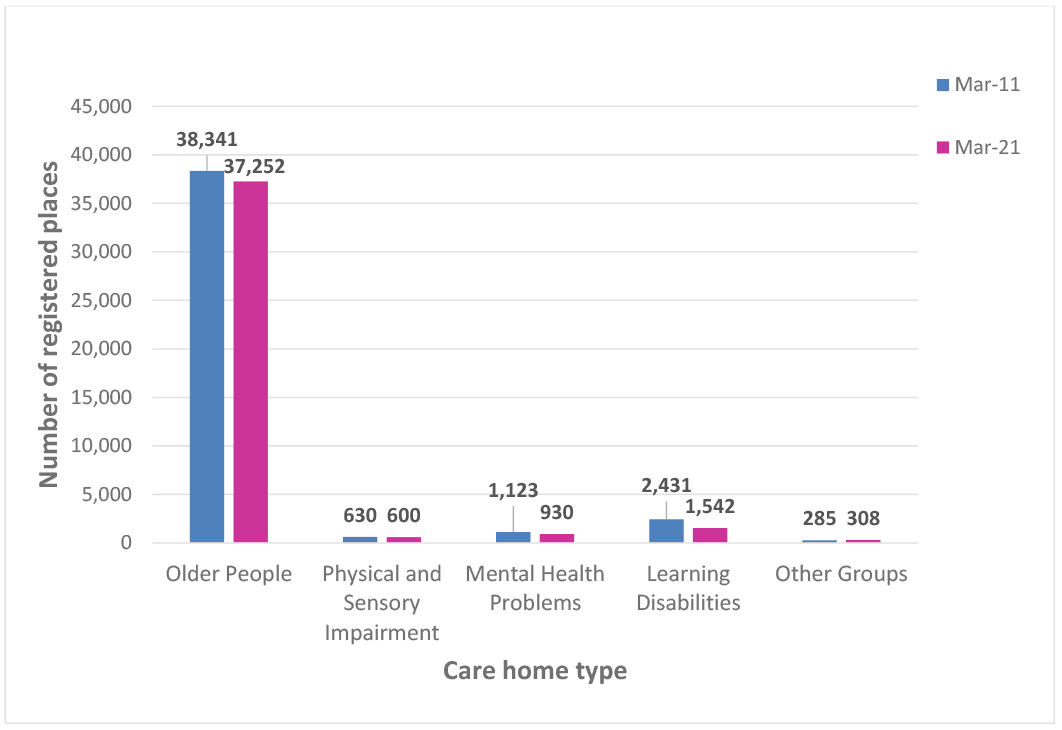
Sources: Scottish Care Home Census, Public Health Scotland and Care Inspectorate
| Key Statistic | 2011 | 2012 | 2013 | 2014 | 2015 | 2016 | 2017 | 2018 | 2019 | 2020 | 2021 | % change 2011 to 2021 | % change 2019 to 2021 |
|---|---|---|---|---|---|---|---|---|---|---|---|---|---|
| Total Number of Care Homes for Adults | 1,329 | 1,307 | 1,282 | 1,249 | 1,216 | 1,175 | 1,142 | 1,126 | 1,102 | n/a | 1,069 | -20 | -3 |
| Local Authority/Health Board Sectors | 203 | 203 | 199 | 185 | 178 | 167 | 160 | 151 | 146 | n/a | 142 | -30 | -3 |
| Private Sector | 725 | 715 | 716 | 711 | 701 | 704 | 691 | 691 | 689 | n/a | 677 | -7 | -2 |
| Voluntary or Not for Profit Sector | 401 | 389 | 367 | 353 | 337 | 304 | 291 | 284 | 267 | n/a | 250 | -38 | -6 |
| Total Number of Registered Places | 42,810 | 42,807 | 42,755 | 42,502 | 42,026 | 41,461 | 40,926 | 41,007 | 41,032 | n/a | 40,632 | -5 | -1 |
| Local Authority/Health Board Sectors | 5,162 | 5,147 | 5,114 | 4,763 | 4,680 | 4,502 | 4,274 | 4,211 | 4,160 | n/a | 4,219 | -18 | 1 |
| Private Sector | 31,662 | 31,705 | 31,677 | 31,856 | 31,566 | 31,583 | 31,483 | 31,597 | 31,868 | n/a | 31,757 | 0 | 0 |
| Voluntary or Not for Profit Sector | 5,986 | 5,955 | 5,964 | 5,883 | 5,780 | 5,376 | 5,169 | 5,199 | 5,004 | n/a | 4,656 | -22 | -7 |
| Total Number of Residents | 37,511 | 37,335 | 36,578 | 36,751 | 36,193 | 36,621 | 35,989 | 35,202 | 35,630 | n/a | 33,353 | -11 | -6 |
| Local Authority/Health Board Sectors | 4,606 | 4,492 | 4,334 | 4,071 | 3,917 | 3,836 | 3,762 | 3,701 | 3,469 | n/a | 3,198 | -31 | -8 |
| Private Sector | 27,457 | 27,513 | 26,926 | 27,297 | 27,064 | 27,850 | 27,471 | 26,750 | 27,579 | n/a | 26,066 | -5 | -5 |
| Voluntary or Not for Profit Sector | 5,448 | 5,330 | 5,318 | 5,383 | 5,212 | 4,935 | 4,756 | 4,751 | 4,582 | n/a | 4,089 | -25 | -11 |
Sources: Scottish Care Home Census, Public Health Scotland and Care Inspectorate
Note: The Scottish Care Home Census did not run in 2020 due to the Covid-19 pandemic.
3.5 Free Personal and Nursing Care
Since July 2002, people aged 65 and over can no longer be charged for personal care services provided in their own home. For those aged under 65, free personal care was introduced in April 2019.
In 2020/21[16]:
- There were 46,820 people aged 65+ who received a personal care service in their own home, receiving an average 8.8 hours per week.
- There were 28,120 long-stay residents aged 65+ in care homes in Scotland. Of these, 6,870 self-funding care home residents aged 65+ received both Free Nursing Care payments and Free Personal Care payments, and a further 3,550 self-funders received Free Personal Care payments only.
In the last quarter of 2020/21[17]:
- There were 12,110 people aged 18 – 64 receiving personal care at home, compared to 10,550 in the last quarter of 2018/19 (prior to the extension). The number of hours provided increased with the extension of Free Personal Care to under 65s in 2019, but decreased by nearly 10% in 2020/21.
- There were 3,350 long-stay care home residents aged 18 – 64 in Scotland, with 120 self-funding residents receiving Free Personal Care payments. In addition, 60 self-funding care home residents aged 18 – 64 received Free Nursing Care payments.
Contact
Email: SWStat@gov.scot