National Care Service - children's social services: overview
Overview of social services provided to children and families in Scotland. It forms one of a collection of contextual papers about social care and related areas in Scotland, linking to the National Care Service consultation.
Workforce
This section relates to the workforce involved in the processes described above, using SSSC sources. Where possible, the most recent available data is reported.
9.1 Headcount and composition
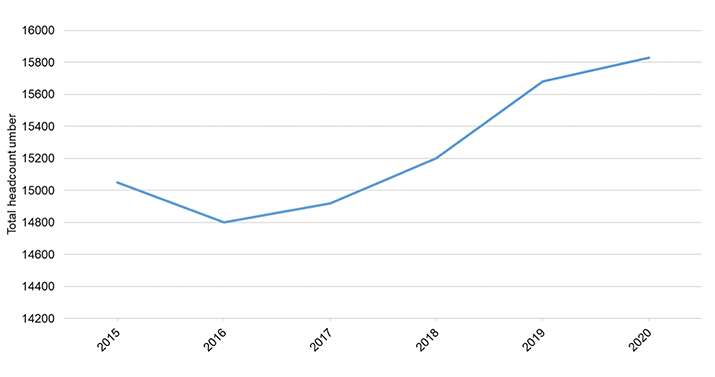
In 2020, the overall headcount for children's social services was 15,830 – a 5% increase since 2015 (Table 10). The two largest subsectors in children's social services were residential child care[21] (accounting for 55% of the total headcount), and fieldwork services[22] (accounting for 37% of the total headcount). The Public Service Reform Scotland Act 2010 distinguishes between registered care services on one hand, and social work services (of which fieldwork services are the essential part) on the other.
Since 2015, the greatest percentage increase in headcount was observed in residential childcare (+13%). Meanwhile, the greatest percentage decrease was observed for fostering services (-14%).
| Children's service | 2015 | 2020 | % change since 2015 |
|---|---|---|---|
| Adoption | 460 | 420 | -9% |
| Fieldwork | 5,960 | 5,920 | -1% |
| Fostering | 980 | 840 | -14% |
| Residential child care | 7,650 | 8,650 | +13% |
| Total | 15,050 | 15,830 | +5% |
This excludes:
- personal assistants employed directly by recipients of self-directed support (SDS) - these are thought to work primarily with adults;
- "headquarters" staff in private and voluntary sector care providers who aren't employed directly in a registered care service; and
- staff employed by private and voluntary sector providers which have been commissioned by local authorities to deliver some of the local authority's social work functions.
Headcount of filled posts; a small amount of double-counting of individuals may exist. Figures are rounded to the nearest 10 which means that individual columns may not sum to the totals. All estimated total staff figures are rounded to the nearest 10 to express the uncertainty inherent in these estimates.
Between 2015 and 2016 the headcount of staff working in children's social services decreased slightly, before gradually increasing thereafter (Chart 13).
9.2 Employer type
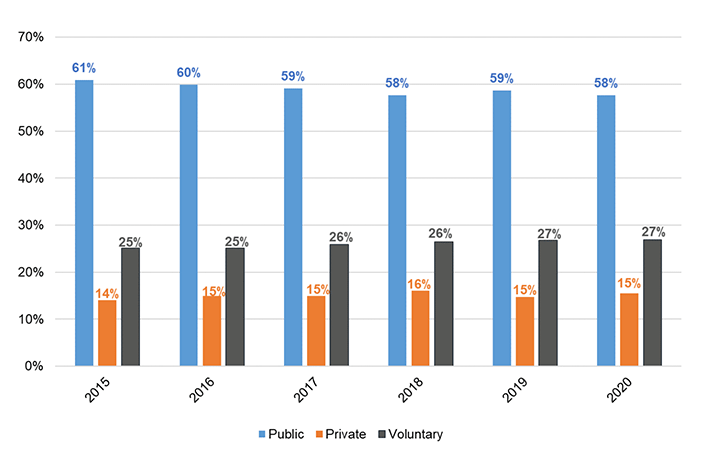
In 2020, 58% (9,120) of children's social services workforce were employed by a public employer, 27% (4,250) were employed by a voluntary sector employer, and 15% (2,450) were employed by the private sector (Table 11).
| Children's service | Public | Private | Voluntary | Total |
|---|---|---|---|---|
| Adoption | 330 | - | 90 | 420 |
| Fieldwork | 5,920 | - | - | 5,920 |
| Fostering | 430 | - | 410 | 840 |
| Residential child care | 2,440 | 2,450 | 3,750 | 8,650 |
| Total | 9,120 | 2,450 | 4,250 | 15,830 |
Headcount of filled posts; a small amount of double-counting of individuals may exist. Figures are rounded to the nearest 10 which means that individual columns may not sum to the totals. All estimated total staff figures are rounded to the nearest 10 to express the uncertainty inherent in these estimates.
Since 2015, the distribution of workforce across the public, private and voluntary sectors has remained relatively stable (Chart 14).
9.3 Residential child care services
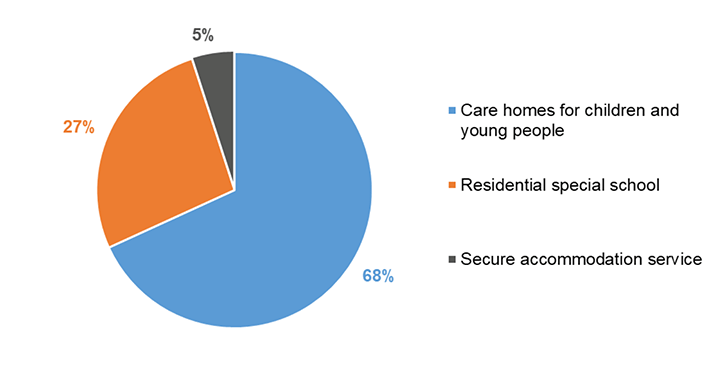
This section focuses on additional data breakdowns for residential child care services sub-sector. Please note that the more detailed breakdowns are only currently available for 2019. This sub-sector includes:
- Care homes for children and young people – provide care and accommodation for looked after children with no specific further needs.
- Residential special schools – provide care and accommodation for children with additional educational needs.
- Secure accommodation services – provide care and accommodation for looked after children in a secure environment.
In 2019[23], 8,420 staff worked in residential child care services, with the largest proportion (68%) working within care homes for children and young people (Chart 15).
Of all residential child care staff, 29% were employed by a public sector employer, 27% by a private sector employer, and 43% by a voluntary sector employer.
| Service type | Public | Private | Voluntary | Total |
|---|---|---|---|---|
| Care homes for children and young people | 2,440 | 1,790 | 1,510 | 5,740 |
| Residential special school | 0 | 510 | 1,750 | 2,260 |
| Secure accommodation service | 20 | 0 | 400 | 420 |
| Residential child care | 2,460 | 2,300 | 3,660 | 8,420 |
9.3.1 Post characteristics
The majority (67%) of staff in residential child care worked in a full time post, with a median of 37 hours worked across all staff. Further breakdowns by service type are presented in Table 13.
| Service type | Part time | Full time |
|---|---|---|
| Care homes for children and young people | 36% | 64% |
| Residential special school | 29% | 71% |
| Secure accommodation service | 20% | 80% |
| Residential child care | 33% | 67% |
In terms of job function, the majority of residential child care staff (86%) constituted care staff. A smaller proportion included auxiliary staff (8%) and managers (6%). Further breakdowns by service type are presented in Table 14.
| Service type | Auxiliary | Care | Managers |
|---|---|---|---|
| Care homes for children and young people | 4% | 90% | 6% |
| Residential special school | 16% | 78% | 6% |
| Secure accommodation service | 22% | 73% | 4% |
| Residential child care | 8% | 86% | 6% |
In terms of contract type, 80% of residential child care staff were on permanent contracts. Further breakdowns by service type are presented in Table 15.
| Service type | Permanent | Other |
|---|---|---|
| Care homes for children and young people | 79% | 21% |
| Residential special school | 81% | 19% |
| Secure accommodation service | 84% | 16% |
| Residential child care | 80% | 20% |
Other includes the following type of contracts: temporary, bank, sessional, casual/relief, as well as other/not known.
9.3.2 Demographics
The median age of staff in residential childcare was 42 years. Further breakdowns by service type are presented in Table 16.
| Service type | Median Age |
|---|---|
| Care homes for children and young people | 42 |
| Residential special school | 40 |
| Secure accommodation service | 33 |
| Residential child care | 42 |
The majority (70%) of the residential child care workforce were female. Further breakdowns by service type are presented in Table 17.
| Service type | Female | Male |
|---|---|---|
| Care homes for children and young people | 73% | 27% |
| Residential special school | 65% | 35% |
| Secure accommodation service | 60% | 40% |
| Residential child care | 70% | 30% |
9.4 Fieldwork Services
This section draws from Local authority post types tables published by the SSSC, the most recent of which relates to 2020 (as at first Monday in December). Please note that these figures are different from those reported for 2019 as these relate to different published data and time periods.
This data includes all filled posts in local authority social work services where those employed do not work in a registered care service. This therefore covers staff working primarily in fieldwork social work services.
In 2020, 5,916 staff worked in fieldwork social work services. The majority of this workforce were female (85%).
9.4.1 Post characteristics
The majority (70%) of staff in fieldwork social work services worked in a full time post. In terms of job function, 39% of the fieldwork services work force constituted main grade social workers and 17% included social work assistants. Proportions of other roles are summarised in Table 18.
| Role | Number of staff | % of all staff |
|---|---|---|
| Service managers | 112 | 2% |
| Team leaders/managers | 368 | 6% |
| Senior social workers | 453 | 8% |
| Main grade social workers | 2,292 | 39% |
| Advocacy/rights staff | 13 | 0% |
| Senior occupational therapists | 0 | 0% |
| Occupational therapists | 14 | 0% |
| Other qualified fieldwork staff | 846 | 14% |
| Trainee social workers | 9 | 0% |
| Social work assistants | 994 | 17% |
| Occupational therapists assistants | 2 | 0% |
| Support services (including admin/clerical) | 813 | 14% |
| Total | 5,916 | 100% |
This does not include central/strategic staff.
Contact
For queries relating to a child at risk of harm please contact the appropriate local authority directly.
For queries relating to this publication contact: childrens.statistics@gov.scot