Publication - Research and analysis
Monthly economic brief: July 2021
The monthly economic brief provides a summary of latest key economic statistics, forecasts and analysis on the Scottish economy.
Consumption
Consumer sentiment has continued to strengthen over the first half of 2021.
Consumer sentiment
- Consumer sentiment in Scotland has continued to strengthen since the start of the year with the Scottish Consumer Sentiment Indicator rising to 3.8 in June, notably improved from the series low levels of sentiment in the second half of 2020.
- The general improvent in sentiment since then reflects a combination of factors. Firstly, while consumers continue to consider that current circumstances regarding the economy, financial security and and attitute to spending are worse than they were in the previous year, this has been to a progressively lesser extent in recent months and as such sentiment regarding current circumstances has been strengthening.
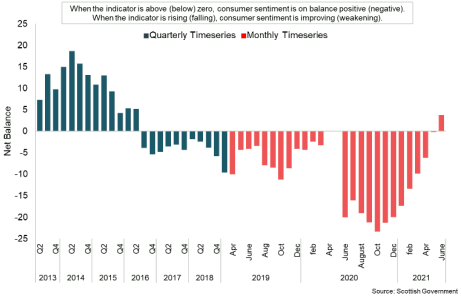
- Secondly, looking ahead to the next 12 months, respondents expect the economy and their household finances to improve over the coming year (relative to the current situation), and while the economy expectations indicator eased back in June, taken together, expectations for the outlook have improved.[18]
- Sentiment indicators continue to be highly sensitive to the rapidly moving developments on the pandemic and the unprecedented economic impacts that we have seen over the past 16 months. As such, they will be a key indicator in understanding the level to which a recovery in consumer sentiment feeds through to changes in consumption over the course of the year.
Retail sales and visits to retail hubs
- At a Great Britain level, retail sales volumes have strengthened since the start of the year and have risen back above pre-pandemic levels. Over the 3-months to June, the volume of sales rose 12.2%, with strong growth in non-food sales (23.6%) and automotive fuel sales (35.8%) as restrictions on retail eased in April and people continued to increase their amount of travel.[19]
- However on a monthly basis, most of the growth was in April (9.3%) and has moderated over May (-1.3%) and June (0.5%), however the level of sales is 9.5% above its pre-pandemic level in February 2020.
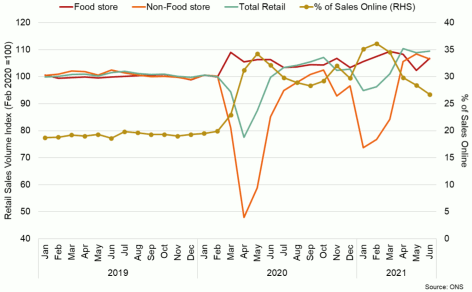
- In June, the proportion of retail sales conducted online remained notably higher than prior to the pandemic at 26.7%, compared to 20% in February 2020. However, the share of sales online continued to fall in June, down from 28.4% in May and from its peak of 36.1% in February, with most retail sectors reporting a fall in their proportions of online sales as consumers returned to physical stores.
- Google mobility data for Scotland show visits to retail picked up sharply in April and May as restrictions eased having been over 60% below the pre-pandemic level at the start of the year. The pace of recovery has been more moderate over June and July and on average has remained around 6% below pre-pandemic levels.
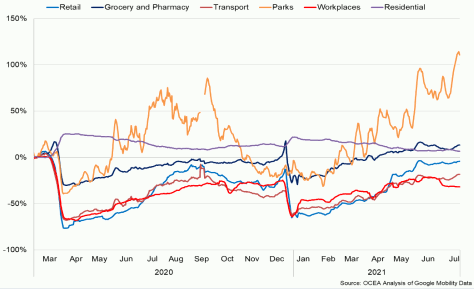
- The stabilisation in the number of visits to retail may be linked to movements that can be seen across the other indicators. For example, movement in transport has also stabilised at 22% below its pre-pandemic level over June and July while visits to workplaces are 31% below pre-pandemic levels in July (though the fall from June will in part reflect the start of school holidays).
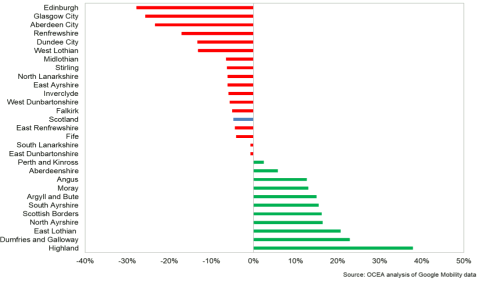
- At a regional level, visits to retail and recreation hubs compared to pre-pandemic levels continue to vary across different Local Authorities in Scotland. [20] In July, Google Mobility data show visits are furthest below pre-pandemic levels in the city areas of Edinburgh (-28%), Glasgow (-26%) and Aberdeen (-23%) and are furthest above in Highland (+38%) and Dumfries and Galloway (+23%).
Household Savings and Consumer Credit
- At an aggregate level, household savings have increased significantly during the pandemic and consumers have made significant net-repayments on consumer credit, as restrictions have caused expenditure to fall while support schemes have helped protect household incomes. This has not been the case across the whole economy, with lower income households facing more significant financial challenges.
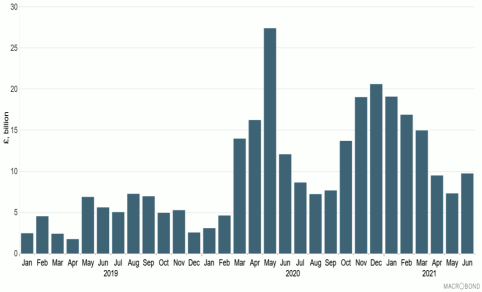
- Bank of England data show that at an aggregate level, net flows from households into deposit-like accounts was £9.8 billion in June, up from £7.3 billion in May. This remains relatively high compared to pre-pandemic levels when the average net inflow in the year to February 2020 was £4.7 billion. However, this has fallen from periods of more elevated inflows over the past sixteen months during which the average inflow has been £14 billion.[21]
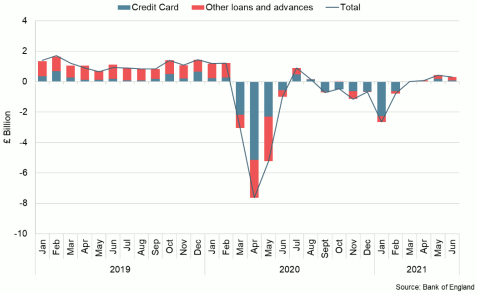
- Consumers have also made significant net-repayments of credit since the start of the pandemic with average net repayments between March 2020 and February 2021 of £1.9 billion per month.
- Since March, consumers have marginally increased net borrowing, with latest data for June showing an increase of £0.3 billion with additions in both ‘other loans and advances’ such as car dealership finance and personal loans and credit card lending. However, the increase in net borrowing remains significantly lower than the pre-pandemic monthly average of £1.1 billion in the year to February 2020.
- Overall, the latest data show the pace of household savings has slowed relative to the start of the year while households have on balance started to gradually increase borrowing as restrictions have eased. The extent to which households subsequently spend accumulated savings and further increase borrowing as restrictions ease remains uncertain. As the outlook improves, latest survey data show an increasing share of people planning to spend a proportion of their additional savings.[22]
Interest rate and inflation
- The inflation rate has risen sharply in recent months, both in the UK and internationally. The UK Consumer Prices Index (CPI) increased by 2.5% in the 12 months to June, up from 2.1% in May, its highest rate since August 2018.[23]
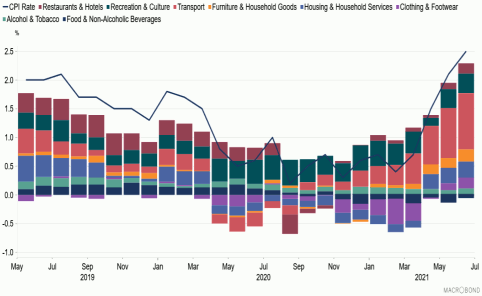
- The increase in June was relatively broad based with upward contributions from transport (principally second-hand cars and motor fuels), restaurants and hotels, food and non-alcoholic beverages, and clothing and footwear. There continue to be some base effects that are playing out in the 12-month inflation rate with comparisons to the early stages of the pandemic when lockdown lead to a sharp fall in demand.
- The CPI rate is currently above the Bank of England’s 2% inflation target. At their June meeting, the Monetary Policy Committee (MPC) made no change to monetary policy, maintaining the Bank Rate at 0.1% and the current programme of Quantitative Easing.[24]
- The MPC expect the inflation rate to temporarily rise above 3% in 2021 before easing back towards the 2% target. This in part reflects the fading out of previous energy price falls while more recent rises in energy prices feed through.
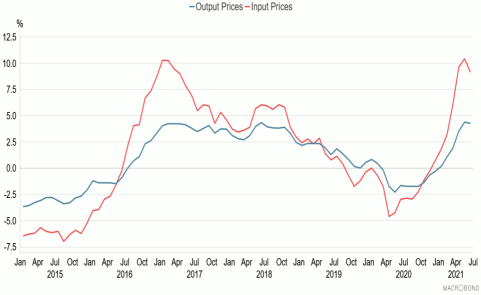
- On the supply side, input cost pressures (e.g. raw materials) have risen sharply over the past year which are expected to further pass through to consumers as demand strengthens. Producer input price inflation was 9.1% in June while output price inflation was 4.3%; both having fallen slightly compared to May, however remain at rates similar to those last seen in 2017.[25]
- Wider PMI business survey evidence points to supply chain pressures intensifying in recent months and contributing to this in both the manufacturing and construction sectors, with firms facing material shortages and increased levels of purchases and stocking, while supplier delivery times have deteriorated.
Contact
Email: OCEABusiness@gov.scot