Publication - Research and analysis
Monthly economic brief: February 2021
The monthly economic brief provides a summary of latest key economic statistics, forecasts and analysis on the Scottish economy.
Output
Scotland’s GDP data for November showed a fall in output for the first time in six months as restrictions were tightened across the UK to suppress a resurgence of coronavirus.
- Scotland’s GDP fell 1.4% in November (UK: -2.6%), having grown for six consecutive months following the sharp fall in March/April when GDP fell by almost a quarter during the initial national lockdown.
- The growth in output between May and October reflected the reopening and resumption of business and consumer activity as national lockdown restrictions eased during the summer months. Over that period, 76% of the fall in output in March and April was recovered.
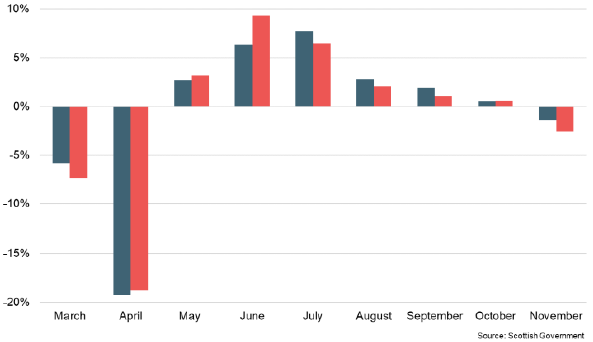
- However, as in the UK as a whole, the pace of recovery slowed considerably towards the end of the third quarter with ongoing weakness in domestic and international demand, particularly in the service sector, and the introduction of regional restrictions on activity in October.
- The fall in output in November was driven by a 2.2% fall in Service sector output, reflecting the industries most directly impacted by the restrictions in place during the month. Output from Accommodation and Food Services fell 28.3%; Arts, Culture and Recreation fell 15.4% and Wholesale, Retail and Motor Trades fell 3.4% (with a sharp fall in non-food retail output).
- Production output grew 0.8% and Construction by 1.8%, however both sectors posted their lowest rates of growth in recent months.
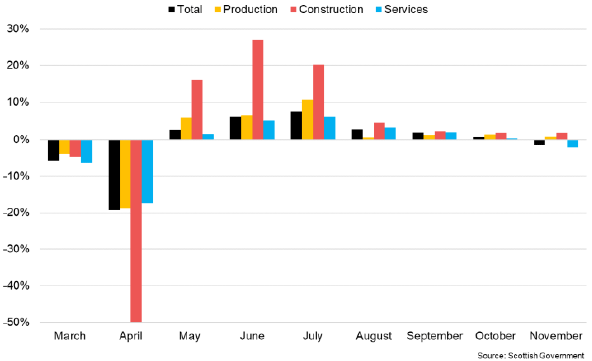
- Overall, Scotland’s GDP is 7.1% lower than its pre-pandemic level in February (UK: ‑8.5%), demonstrating that progress back to pre-pandemic levels has been made.
- However there are notable differences in the pace of recovery across sectors. Output in the Production sector is 1.6% above its pre-pandemic level in February, driven mainly by a strong pick-up in Manufacturing output, while Construction output remains 6.1% below and Services 9.2% below. However, the largest differences persist in the Services sector with Accommodation and Food Services 59.2% below its level in February and Arts, Culture and Recreation 39.6% below.
- The overall pattern of Scottish GDP during the pandemic has broadly been in line with the UK as a whole. However, a combination of structural differences between sectors and differences in the timing and nature of restrictions across the UK is reflected in the different growth rates between months.
- Differences in the structure of economies and the stringency of restrictions explain, in part, why the UK, Euro Area and US economies have experienced different economic impacts. However, differences in how components of GDP are calculated across countries makes international comparisons complex.
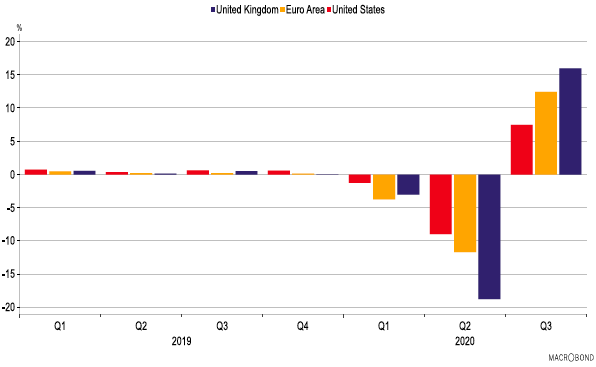
- Latest quarterly data show UK GDP grew 16.0% in Q3 (following an 18.8% fall in Q2), while the US grew 7.5% (following a fall of 9.0%) and the Euro Area grew 12.4% (following a fall of 11.7%).
- Flash estimates for Q4 2020 show the US continued to grow in the final quarter of the year though at a much reduced rate (1.0%), while the Eurozone contracted over the quarter (-0.7%).
Contact
Email: OCEABusiness@gov.scot