Publication - Research and analysis
Monthly economic brief: August 2021
The monthly economic brief provides a summary of latest key economic statistics, forecasts and analysis on the Scottish economy.
Output
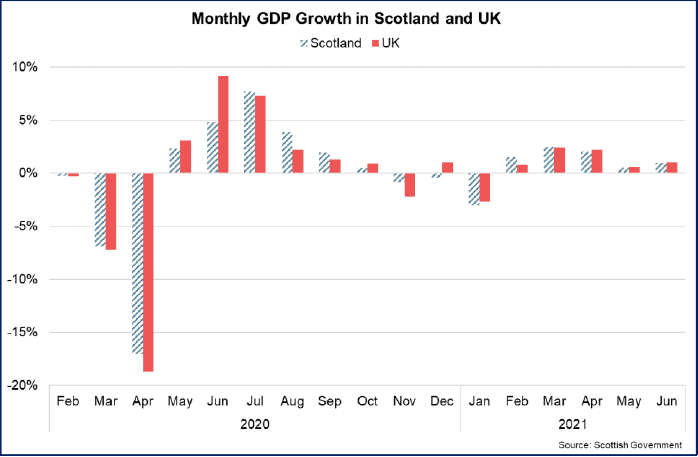
Scotland’s GDP grew 0.9% in June, but is 2.1% below pre-pandemic levels.
- Scotland’s GDP grew 0.9% in June (UK: 1.0%), its fifth consecutive month of growth. GDP continues to follow a similar pattern to the UK as a whole,[1] with growth over the month driven by the services (1.2%) and production (0.5%) sectors offsetting a fall in construction sector output (-1.4%).
- The phased easing of restrictions in April and May on consumer facing services and the movement of people was a key enabler of the output growth, as an increasing number of businesses reopened and consumer demand strengthened.
- Further easing of restrictions in June included the move to Level 1 across much of mainland Scotland. This enabled restrictions on hospitality to ease and in the services sector the largest contribution to growth was from accommodation and food services (22.9%), for the third month in a row.
- Production sector output in June was largely driven by increases in electricity and gas supply (9.7%), which offset falls in water supply and waste management (-2.2%) and manufacturing (-1.4%). Mining and quarrying remained unchanged on May.
- The fall in construction output in June came on the back of stronger growth earlier in the year and followed a similar pattern to the UK as a whole.
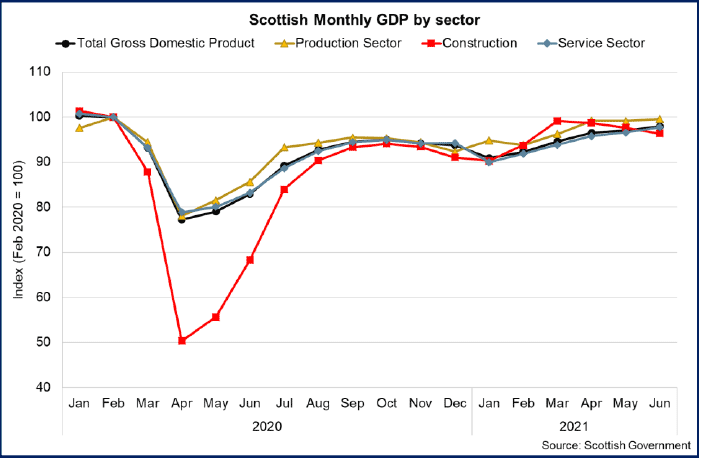
- The five consecutive months of growth between February and June mean that Scotland’s GDP has recovered from the recent fall in output over November to January and has continued to recover back to its pre-pandemic level in February 2020 (having initially fallen to 22.8% below in April 2020). In June, Scotland’s GDP was 2.1% below its pre-pandemic level and is at its highest level during the pandemic.
- However there remain significant differences across sectors in the pace of recovery, which largely reflects the restrictions that have been in place and the extent to which this has impacted demand and trading capacity across sectors.
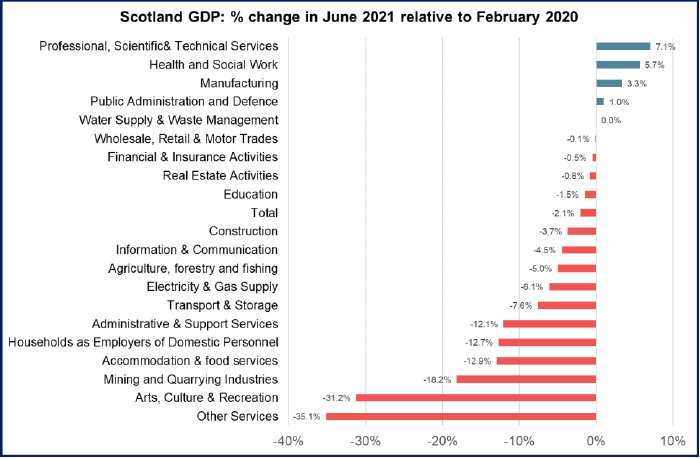
- While there are month to month variations, parts of the economy are generally operating above their pre-pandemic levels of output. For example, manufacturing output in June was 3.3% above its February 2020 level.
- The service sector is mixed with parts (private and public) currently operating above their pre-pandemic levels and others below. Output from professional, scientific & technical services (+7.1%) has recovered relatively quickly from an initial fall of 6% in output at the start of the pandemic as businesses were in a position to adapt (e.g. working from home) and demand recovered.
- Consumer facing parts of the services sector however have been more directly impacted by restrictions on activity over the course of the year (e.g. requirements to close), and as such output remains further below pre-pandemic levels of output. The phased easing of restrictions on non-essential retail and hospitality over April and May and the move to Level 1 in June, has resulted in more rapid recovery over the last couple of months in these sectors as businesses have opened and resumed trading. For example, accommodation and food services output grew 57.1% in April, 31.7% in May, 22.9% in June and is now 12.9% below its pre-pandemic level, while arts, culture and recreation output grew 1.7% in April, 10.3% in May, 2.3% in June and is 31.2% below.
Contact
Email: OCEABusiness@gov.scot